Pulsations and Pre-He White Dwarf in the Post-mass Transfer Eclipsing System WASP 1021-28
Abstract
We present results from VLT/UVES spectra and TESS photometric observations of the pulsating EL CVn binary WASP 1021-28, containing a He-core white dwarf precursor (pre-He WD). Double-lined radial velocities were measured with the atmospheric parameters of = 7411 K, [M/H] = 0.340.05 dex, and = 86.64.0 km s-1 for the more massive primary. Combining these measurements and TESS data from four sectors allowed the direct calculation of accurate values for the absolute parameters of each component and the distance to the system. The third-light source of = 0.029 may be the outer tertiary object previously discovered by SPHERE/IRDIS observations. WASP 1021-28 A is located near the blue edge of the Dor instability strip, and the less massive companion is concurrent with the He-core WD model for metallicity = 0.02 and mass = 0.191 . The value and the Galactic kinematics demonstrate that the program target belongs to the thin-disk population. We iteratively prewhitened the entire TESS residuals and extracted four and nine significant signals in two ranges of 1.122.25 day-1 and 111.25139.24 day-1, respectively. A signal of = 1.31865 day-1 in the low-frequency region can be attributed to the Dor pulsation of WASP 1021-28 A, and the high frequencies may be extremely low-mass pre-He WD oscillations. The results presented here provide valuable information on the evolution of short-period EL CVn stars proposed as inner binaries of hierarchical triple systems and the multiperiodic pulsations.
keywords:
binaries: eclipsing - binaries: spectroscopic - stars: fundamental parameters - stars: individual (WASP 1021-28) - stars: oscillations (including pulsations).1 INTRODUCTION
This study is a continuation of a series of papers that measure the fundamental parameters and pulsation frequencies for each component of the EL CVn-type binaries, thereby understanding their physical properties and evolutionary states (see Lee et al. 2024). The eclipsing binaries (EBs) are post-mass transfer systems, comprised of a main-sequence (MS) star of spectral type A or F and an extremely low-mass white dwarf precursor (pre-ELM WD) with a mass below 0.3 M⊙. The pre-ELM WDs are known to be the result of non-conservative mass transfer evolution during the red-giant branch (RGB) phase of a binary system, rather than a single star, given the age of the Universe. They are the remnants of helium (He) cores that evolved from the more massive component in the initial MS binaries, and are called proto-/pre-He WD. Comprehensive reviews of the EL CVn stars appear in Maxted et al. (2014a), van Roestel et al. (2018), and Lee et al. (2020). To further develop this subject, we explore another such EL CVn binary, WASP 1021-28 (1SWASP J102122.83-284139.6; TIC 192990023, TYC 6631-538-1, 2MASS J10212283-2841395, Gaia DR3 5462478705727653248; = 11.12, = 0.39; = 10.43, = 0.07).
The target star was announced as an EL CVn-type EB by Maxted et al. (2014a) based on archival data from the WASP survey. Using the light curve fitting, they reported that WASP 1021-28 is a well-detached stellar system with the following binary parameters: inclination angle = 82.10.6 deg, photometric mass ratio = 0.1430.027, relative radii = 0.37070.0034 and = 0.07670.0010, and luminosity ratio = 0.10260.0011. Maxted et al. (2014a) also compared model and observed flux distributions that lead to effective temperatures of = 7300300 K and = 9800500 K. The subscript A denotes the larger and brighter primary star eclipsed in the secondary minimum, and the hotter companion is indicated by subscript B. On the other hand, Lagos et al. (2020) discovered an additional object, from VLT/SPHERE observations, that is 1.0 arcsec away from the EB and fainter by = 3.5950.008 mag, using the IRDIS DBI mode in the filter and the 185-mas diameter coronagraph NALCYJHS (Beuzit et al. 2008; Dohlen et al. 2008; Vigan et al. 2010; Guerri et al. 2011). They estimated the mass and temperature of the tertiary object to be about 0.6 M⊙ and 37004000 K, respectively, corresponding to a spectral type of approximately K9 V (Pecaut & Mamajek 2013). The probability of being aligned by chance with a background source is only 0.04%.
While writing this paper, Çakirli et al. (2024) reported an analysis of the same VLT/UVES spectra and TESS light curve that we used. We believe that our results will help to better understand the absolute properties of WASP 1021-28 and the multiperiodic oscillations excited in each component. In this paper, we compare their results with ours and present in detail the pulsation features and evolutionary state of the double-line EL CVn EB.
2 TESS PHOTOMETRY AND ECLIPSE TIMES
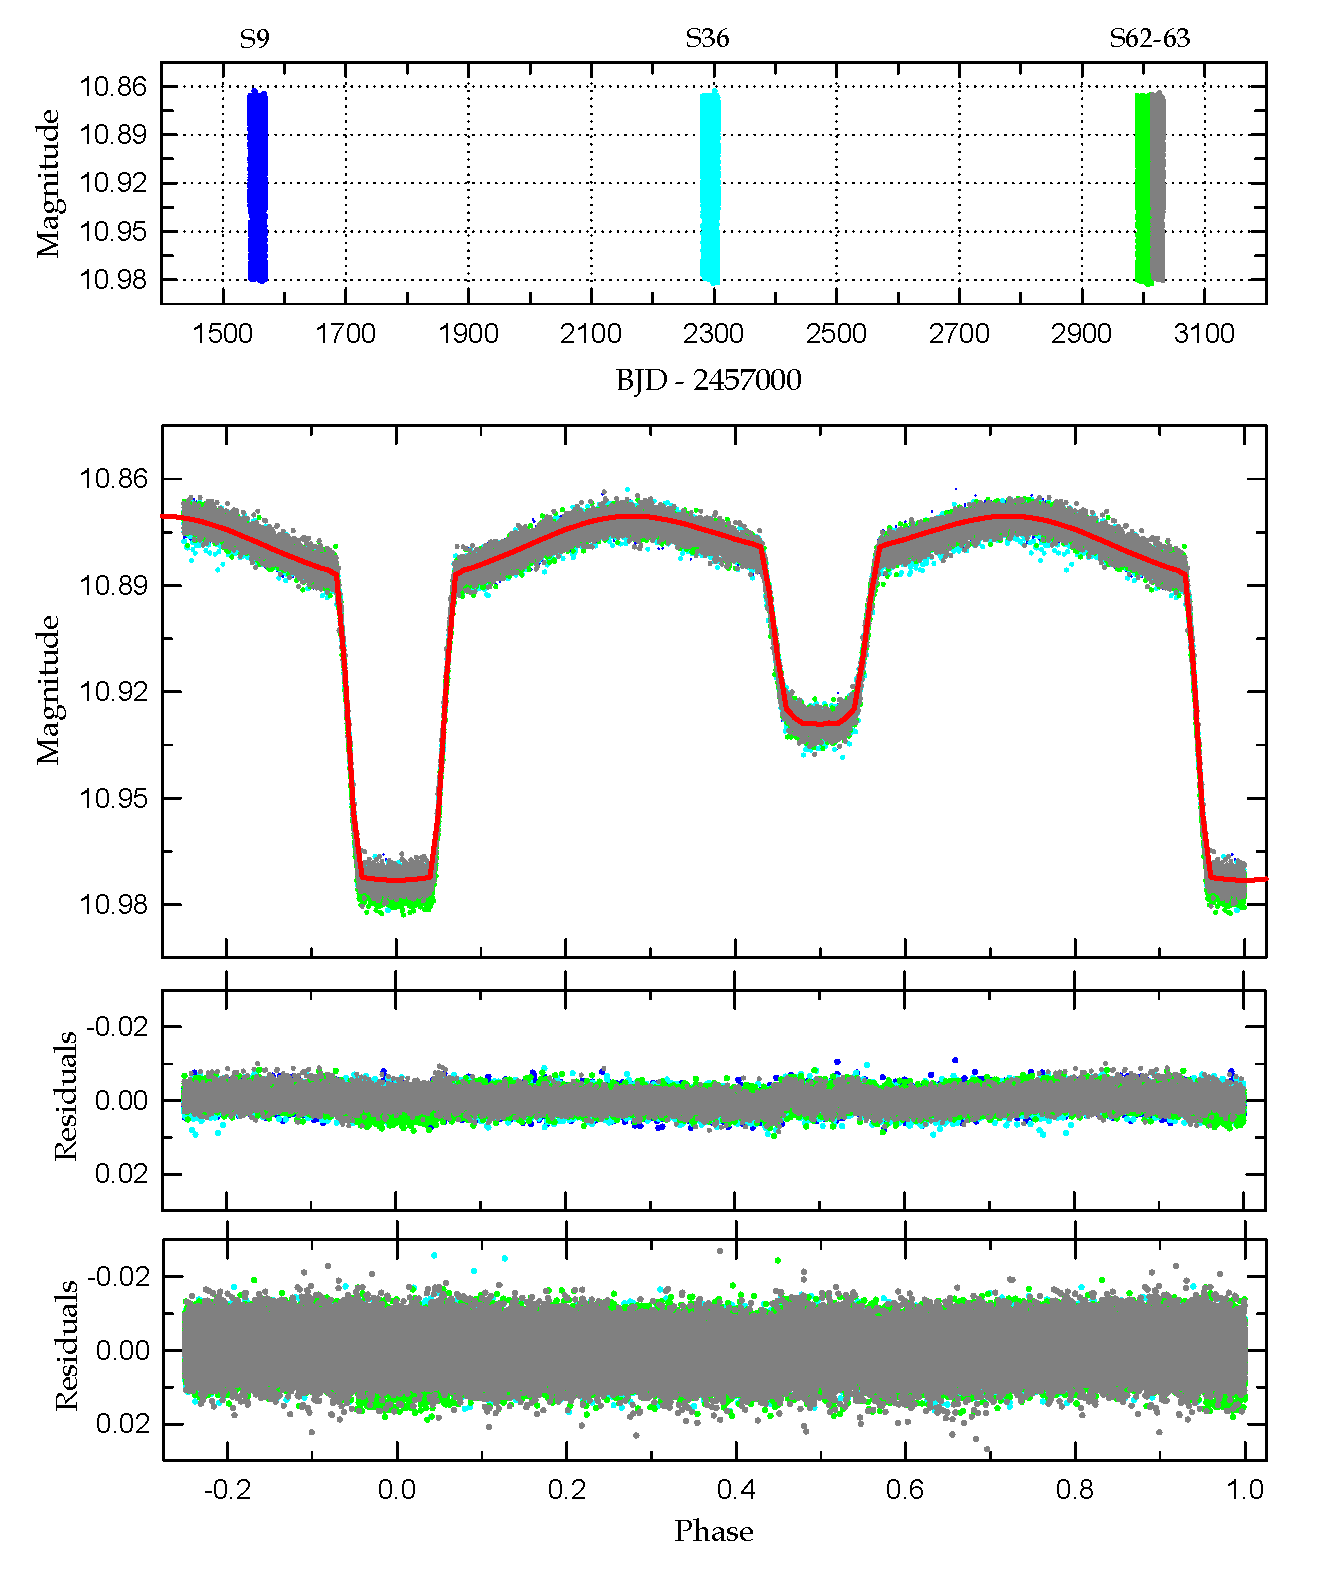
WASP 1021-28 was observed as part of the TESS photometric survey (Ricker et al. 2015) to search for small transiting exoplanets. The satellite observations were conducted in Sectors 9 (S9), 36 (S36), 62 (S62), and 63 (S63) between 2019 March and 2023 April. The S9 data were acquired in 2-min sampling mode only, while the other ones were collected at both 2-min and 20-s cadences. We downloaded the TESS observations from the MAST archive111https://archive.stsci.edu/, which are available at http://dx.doi.org/10.17909/0d6n-4767. The simple aperture photometry data (SAP-FLUX) were processed and used in this study employing the same approach as previously applied (Lee et al. 2017, 2024). To convert the flux to magnitude units, we took the TESS magnitude at maximum light to be = 10.871 (Paegert et al. 2022). The resulting time-series data are presented in Figure 1. The total time span of these observations is about 1490 days, with observation gaps of 714 and 684 days between S9 and S36 and between S36 and S62, respectively. The average of the CROWDSAP factors reported in the four sectors is 0.99150.0030, which suggests that the TESS measurements of WASP 1021-28 are hardly influenced by surrounding sources.
To measure the eclipse mid-times of WASP 1021-28, we applied the Kwee & van Woerden (1956) method to each eclipse curve in the TESS data. In total, 91 primary and 90 secondary minimum epochs were extracted from the 2-min (S9) and 20-s (S36, S62-63) cadences, which are summarized in Table 1. A linear least-squares fit to the primary minima yielded the following orbital ephemeris for the TESS data of WASP 1021-28:
| (1) |
where the numbers in parentheses are the 1-error values. The TESS orbital period (), corresponding to the frequency = 1.1100031 0.0000001 day-1, is slightly longer than the value (0.90089800.0000002 days) derived from the WASP archive data (Maxted et al. 2014a).
3 VLT/UVES SPECTROSCOPY AND DATA ANALYSIS
High-resolution spectroscopy of WASP 1021-28 was performed between 2014 November 22 and 2015 February 17 in the context of ESO under programme 094.D-0027(A), which was devoted to observing EL CVn-type binaries containing pre-He WDs. The spectroscopic observations were made with the UVES Spectrograph (Dekker et al. 2000) attached to the VLT 8.2-m telescope at Paranal in Chile. The blue (wavelength range 3282–4563 Å) and red (wavelength range 5655–9464 Å) arms with slit widths of 0.8 arcsec were adopted, providing dispersions of 49,620 and 51,690, respectively. The observation instrument setup and data reduction for the target star are identical to those for WASP 0346-21 (Lee et al. 2024). A total of seven reduced spectra were acquired at the ESO Science Archive Facility222https://archive.eso.org/scienceportal/home and utilized in our study. They consist of three observed spectra, each with an integration time of 120 s, most of which have a signal-to-noise ratio (SNR) of about 30. We normalized the archival data by applying a spline3 function.
The UVES spectral analysis was carried out in the same manner as in the study by Lee et al. (2024). For the RV measurements of WASP 1021-28, we applied the broadening function (BF) formalism (Rucinski 2002) built in the RaveSpan software (Pilecki et al. 2017) to the normalized echelle spectra. This method is particularly useful for multiple or binary systems where the rotational broadening between the component stars differs significantly, and can provide better resolution profiles than the cross-correlation function (Rucinski 2002, 2004). In this analysis, we adopted a template spectrum from the model grids of LTE synthetic spectra by Coelho et al. (2005).
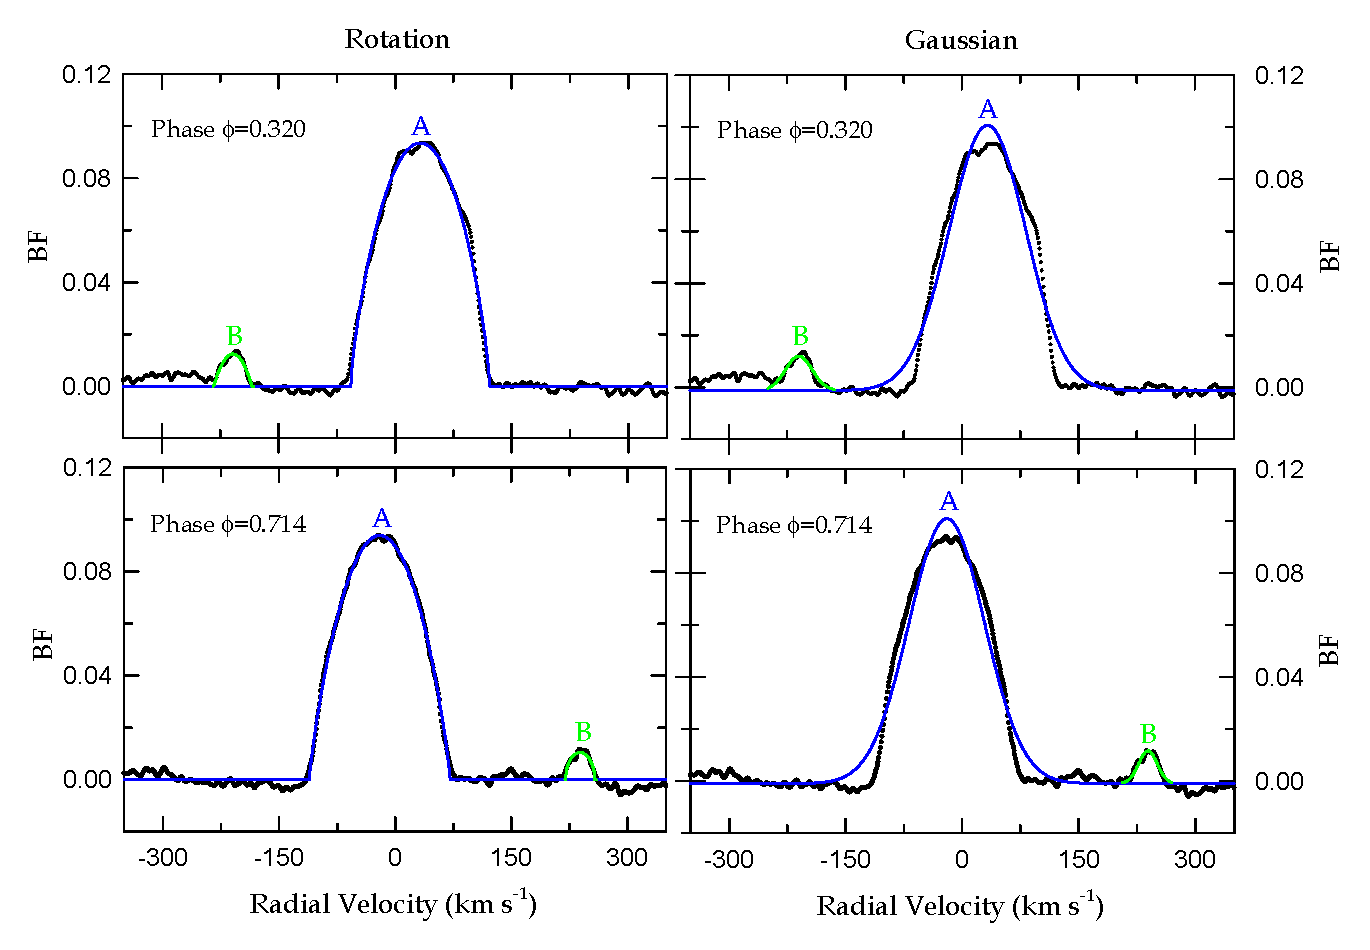
The low SNR spectral lines of WASP 1021-28 B can be challenging to detect because of its low luminosity. We scrutinized the trailed spectra to identify the spectral regions where the absorption lines of both components are observable (e.g., Lee et al. 2023). Our examination uncovered two specific regions of 4440–4520 Åand 6320–6405 Å, which clearly show the absorption lines of both components moving along the binary’s orbital motion. We also applied the BF method to regions excluding Balmer lines with wide wings and where telluric lines are sparse, and found binary features in the region 4160–4280 Å, in addition to the two ranges previously revealed. The observation times of the blue- and red-arm data are less than 1 second apart, and the preliminary measurement errors of RVs are larger than the velocity change caused by the time difference. Therefore, to extract the RVs of the EB components, three spectral ranges of 4160–4280 Å, 4440–4520 Å, and 6320–6405 Åwere analyzed simultaneously using rotation and Gaussian profile functions separately.
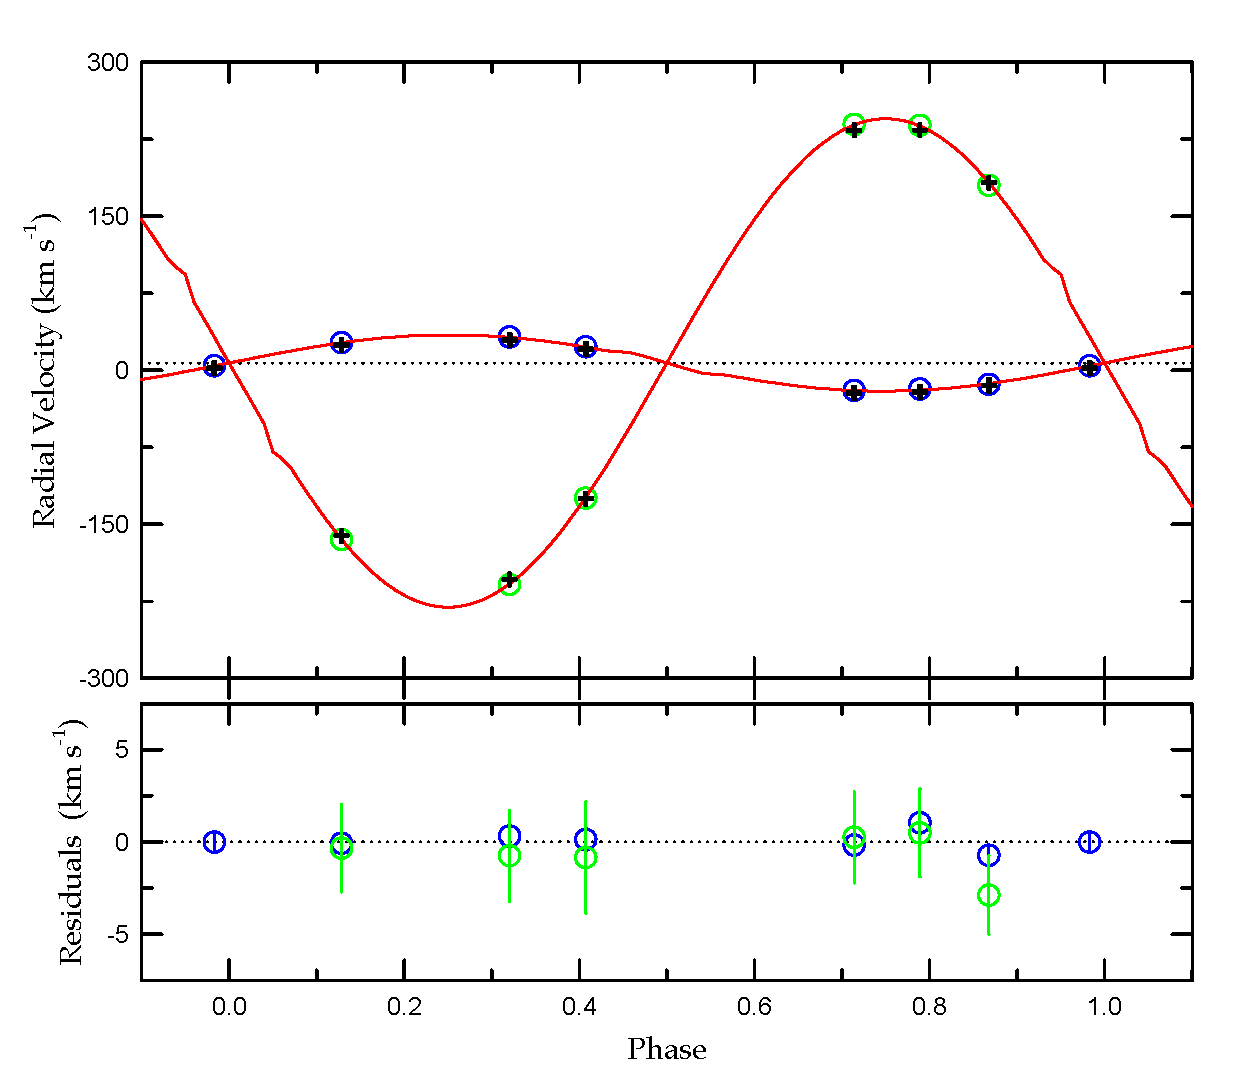
Figure 2 shows the sample BF profiles at quadrature phases, where the rotation functions in the left panels describe the BFs much better than the Gaussian functions in the right panels. Consequently, we chose the RV measurements obtained from the rotation profile fits as the final values presented in Table 2 and Figure 3. Çakirli et al. (2024) also adopted the BF method of the RaveSpan to obtain the UVES RVs, but applied a Gaussian function to each spectral signal instead of a rotation function. Our and their RVs differ on average by = km s-1 and = km s-1 for the A and B components, respectively, and these errors are expressed as 1 values from the standard deviations.
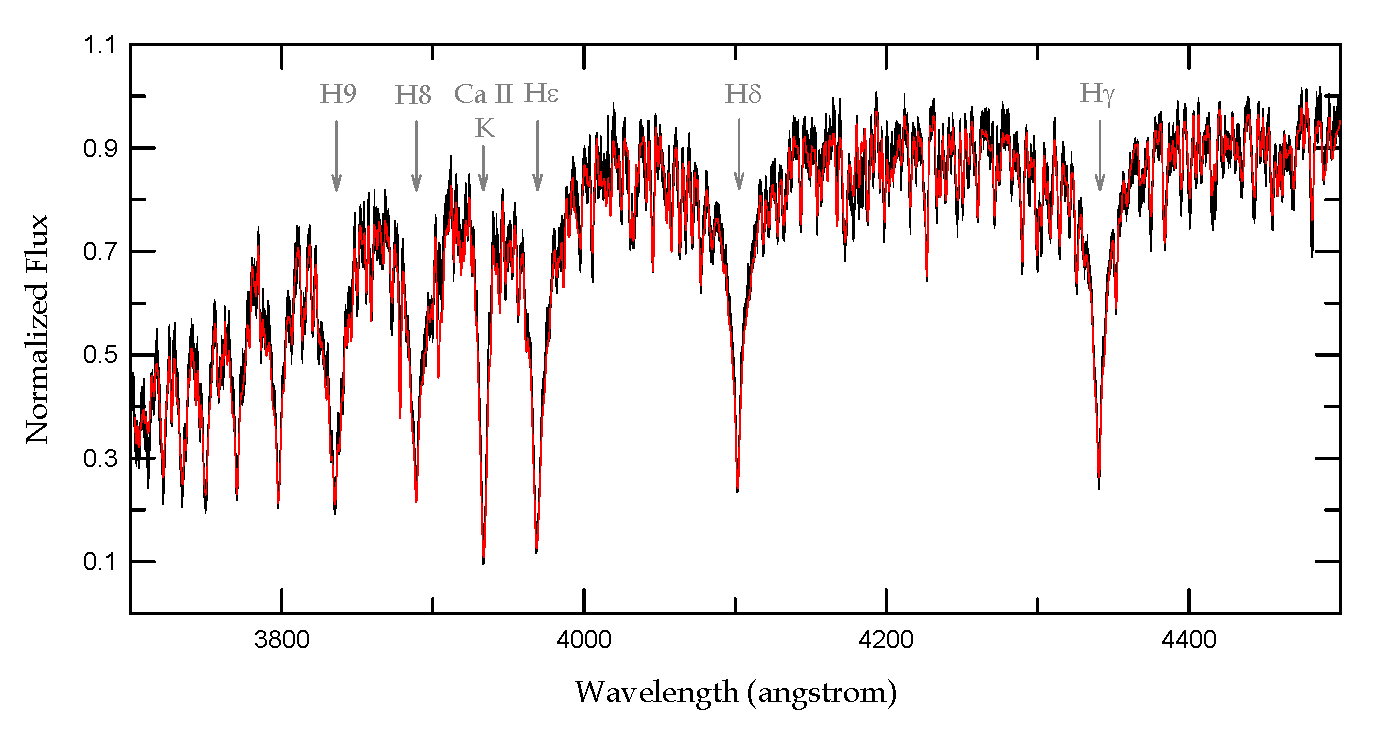
The atmospheric properties of WASP 1021-28 A were derived using the grid search software package GSSP333https://fys.kuleuven.be/ster/meetings/binary-2015/gssp-software-package (Tkachenko 2015), which compares the observed target spectra with grids of synthetic model spectra and minimizes the statistic between them. For this, we utilized the UVES spectrum of the orbital phase 0.983 (BJD 2,456,983.82076) obtained during the primary eclipse. The synthetic model grids were generated over the ranges of effective temperature = 68008000 K, metallicity [M/H] = 0.5+0.5 dex, and projected rotational velocity sin = 80120 km s-1. In these grids, the surface gravity, and micro- and macro-turbulence velocities were set to (cgs) = 4.16 (see Section 4), and = 2.0 km s-1 and = 19.9 km s-1 from the iSpec code (Blanco-Cuaresma et al. 2014). The GSSP runs focused on the wavelength range 3700–4200 Å, which includes absorption lines that are very sensitive to atmospheric parameter estimations. The grid search results yielded the optimal values for three atmospheric parameters: = 7411 K, [M/H] = 0.340.05 dex, and = 86.64.0 km s-1. Figure 4 displays our best-fit synthetic model superimposed on the observed spectrum at the conjunction phase.
Our value is in close agreement with the effective temperatures of 7300300 K, 7378140 K, and 729441 K from Maxted et al. (2014a), the TESS Input Catalogue (Paegert et al. 2022), and the Gaia DR3 archive (Gaia Collaboration 2022), respectively. In contrast, Çakirli et al. (2024) reported atmospheric parameters of 7650 K, 0.200.03 dex, and 822 km s-1 in the same order as before using the iSpec code. While their metallicity and rotational rate match our measurements within the range of 3 errors, the temperature deviates significantly from all other measurements, including ours.
4 BINARY MODELING
As stated in the Introduction, EL CVn stars are very promising binaries for investigating the absolute properties and evolutionary history of pre-ELM WDs. These studies require reliable measurements of the mass, radius, temperature, and luminosity of each binary component, which are achieved using precise light and spectral data. In particular, the mass ratio (), a key parameter in binary star modeling, can be accurately measured directly from the double-lined RVs. The TESS observations in Figure 1 are typical EL CVn light curves showing both a total eclipse at the primary minimum and an out-of-eclipse ellipsoidal variation, with no notable differences between the sectors utilized. For a unique solution for WASP 1021-28, we adopted the EB modeling code (hereafter W-D code) that was developed by Wilson & Devinney (1971) and steadily improved over the past 50 years (see van Hamme & Wilson 2007; Kallrath 2022). The full 2-min TESS light curves were analyzed with the UVES RV measurements in the same way as for WASP 0346-21 (Lee et al. 2024). The mean time difference between the primary and secondary minimum epochs in the TESS data is 0.450480.00049 days. This value corresponds to half the orbital period, suggesting that the EB target is likely in a circular orbit ( = 0.0).
From our spectral analysis, we set the effective temperature of WASP 1021-28 A to = 7411 K and its rotation parameter to = 0.8900.042, which is the ratio of the observed and the synchronous rotation . The bolometric albedos and gravity-darkening coefficients of the component stars were given as = 1.0 and = 1.0, respectively, as expected for the temperatures. The logarithmic limb-darkening law was chosen, and its parameters and were fixed from the van Hamme (1993) tables provided in the W-D code. WASP 1021-28 B was assumed to be in a rotation state synchronized with the system’s orbital motion. The spectroscopic orbital elements of the mass ratio, semi-major axis, and systemic velocity were initialized to = 0.116, = 4.77 R⊙, and = 6.6 km s-1 by a combination of our sinusoidal fits to RV curves and the photometric solution of Maxted et al. (2014a). Other adjustable parameters in this modeling are the orbital epoch () and period (), the inclination (), the surface potentials () of both stars, the secondary’s temperature (), the primary’s luminosity (), and the third light ().
Most short-period EL CVn EBs are proposed to be inner close pairs of hierarchical triples that host circumbinary companions (Lagos et al. 2020; Lee et al. 2024). The TESS light and UVES RV measurements of WASP 1021-28 were not simultaneous and the time interval between them is more than 4 yr. Therefore, unlike the simultaneous analysis of Çakirli et al. (2024), we modeled the two types of observations separately and repeatedly. First, we solved the 2-min sampling TESS data using the initial spectroscopic elements. Then, the double-lined RV curves were solved applying the photometric parameters computed in the previous step. We re-performed the light curve analysis with the updated RV parameters. This procedure was detailed in Lee et al. (2024), and the final results are presented in Table 3 along with those of Çakirli et al. (2024). The model fits to the light and RV curves are plotted as the solid lines in Figures 1 and 3, indicating that the binary star model represents both datasets well. Our parameter errors were obtained via the error estimation method of Southworth & Bowman (2022), which utilizes the variation of each free parameter from various model fits using different inputs and alternative approaches.
Looking at Table 3, the modeling parameters that show the largest difference between our and Çakirli et al. (2024) solutions are the luminosities ( and ) contributed by each component to the total brightness of the potential triple star in the TESS band. Our third light ( = 0.029) is about 4 times smaller than that ( = 0.120) of Çakirli et al. (2024), resulting in an orbital inclination that is about 2 deg smaller. The light contribution of 2.9 % is in satisfactory agreement with that (3.5 %) obtained from the magnitude difference of = 3.5950.008 mag between WASP 1021-28 AB and the tertiary object detected by Lagos et al. (2020). The source could then be a distant outer tertiary observed in the SPHERE/IRDIS band images, gravitationally bound to the eclipsing pair of WASP 1021-28. On the other hand, our errors in the light curve parameters are generally higher than those of Çakirli et al. (2024), while the errors in the velocity parameters are about one order of magnitude smaller, and so is the mass ratio ( = /). Regarding the spectroscopic orbits, the main difference between us and them is the method for measuring the RVs. The BF profiles for the UVES spectra were better described by a rotational function than by a Gaussian function, so we prefer our RV measures.
The absolute parameters of WASP 1021-28 were derived using our light and velocity solution, and are summarized at the bottom of Table 3. In this calculation, the effective temperature and bolometric magnitude of the Sun were given as ⊙ = 5780 K and ⊙ = +4.73, and the bolometric correction (BC) of each component was obtained through temperature calibration (Flower 1996, Torres 2010). We also determined the distance of WASP 1021-28 as 5589 pc by applying the apparent maximum light and color excess of = 11.1150.011 and () = 0.0390.009 (Paegert et al. 2022) to the well-known equation of , where the interstellar extinction and the EB’s total absolute magnitude = 2.2910.034. This distance represents a parallax of 1.7920.029 mas, which matches well with the measurement of 1.8070.020 mas (Gaia Collaboration 2022), corresponding to a distance of 5536 pc.
5 PULSATIONAL CHARACTERISTICS
The fundamental parameters of WASP 1021-28 indicate that the more massive A component is a normal MS of spectral type A9, while the hotter B companion is a He-core WD precursor. Thus, the two components are likely to be a Sct/ Dor variable and a pulsating WD in the same order (Maxted et al. 2013, 2014b; Wang et al. 2020; Hong et al. 2021; Lee et al. 2023, 2024). Çakirli et al. (2024) analyzed separately three TESS datasets (S9, S36, S6232), separated by observational gaps. Using the SNR4 criterion, they found 17 frequencies in S9, 15 in S36, and 14 in S6263. However, only three frequencies of 24.4 day-1, 112.4 day-1, and 126.7 day-1 were detected together in all three datasets, the first of which is 22 times the orbital frequency (22). Our frequency search for WASP 1021-28 was conducted using the software PERIOD04 (Lenz & Breger 2005) with successive prewhitening (Lee et al. 2014).
For a useful Fourier analysis, we used the TESS residual lights cleaned with the W-D model curve. Analysis of the model-subtracted data revealed several peak signals that were multiples of the orbital frequency , where is an integer. Since WASP 1021-28 favors a circular orbit in both the TESS observations and binary modeling, it is difficult to attribute these harmonics to tidal excited pulsations, which would typically occur in binary systems with high eccentricities of (Guo 2021). The orbital harmonic oscillations may primarily result from systematic trends and orbital effects not being completely removed from the observed TESS data. Therefore, we first removed the orbital frequencies from the light curve residuals, and then conducted the prewhitening process on the immune data up to the Nyquist limit .
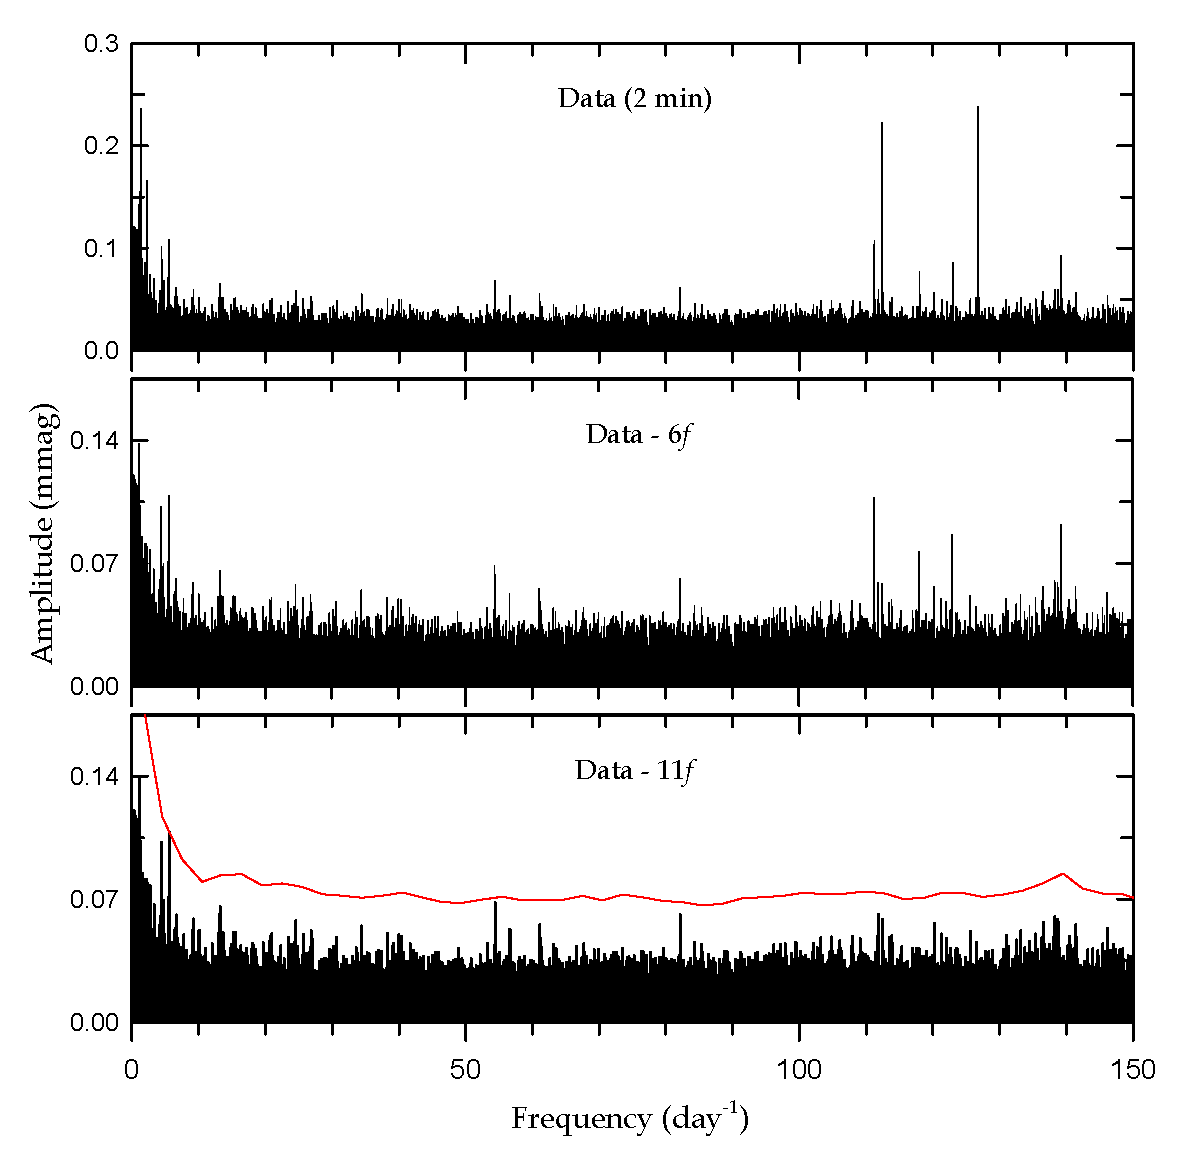
Figure 5 shows the amplitude spectra for the entire 2-min sampling data of S9, S36, S62, and S63 from the PERIOD04. Here, the frequency signals are clearly visible in two main parts: the low-frequency region day-1 and the high-frequency region 100150 day-1. In contrast, there was no noticeable signals in the frequency range over 150 day-1. Our repeated prewhitening continued until no frequency had an SNR greater than 5 (Baran & Koen 2021; Bowman & Michielsen 2021). As a consequence, we found 11 frequency peaks (4 low and 7 high) in the full-phase 2-min cadences. Frequencies between 13 and 45 day-1 found in each dataset by Çakirli et al. (2024) were either removed as orbital harmonics or did not meet the SNR5 criterion.
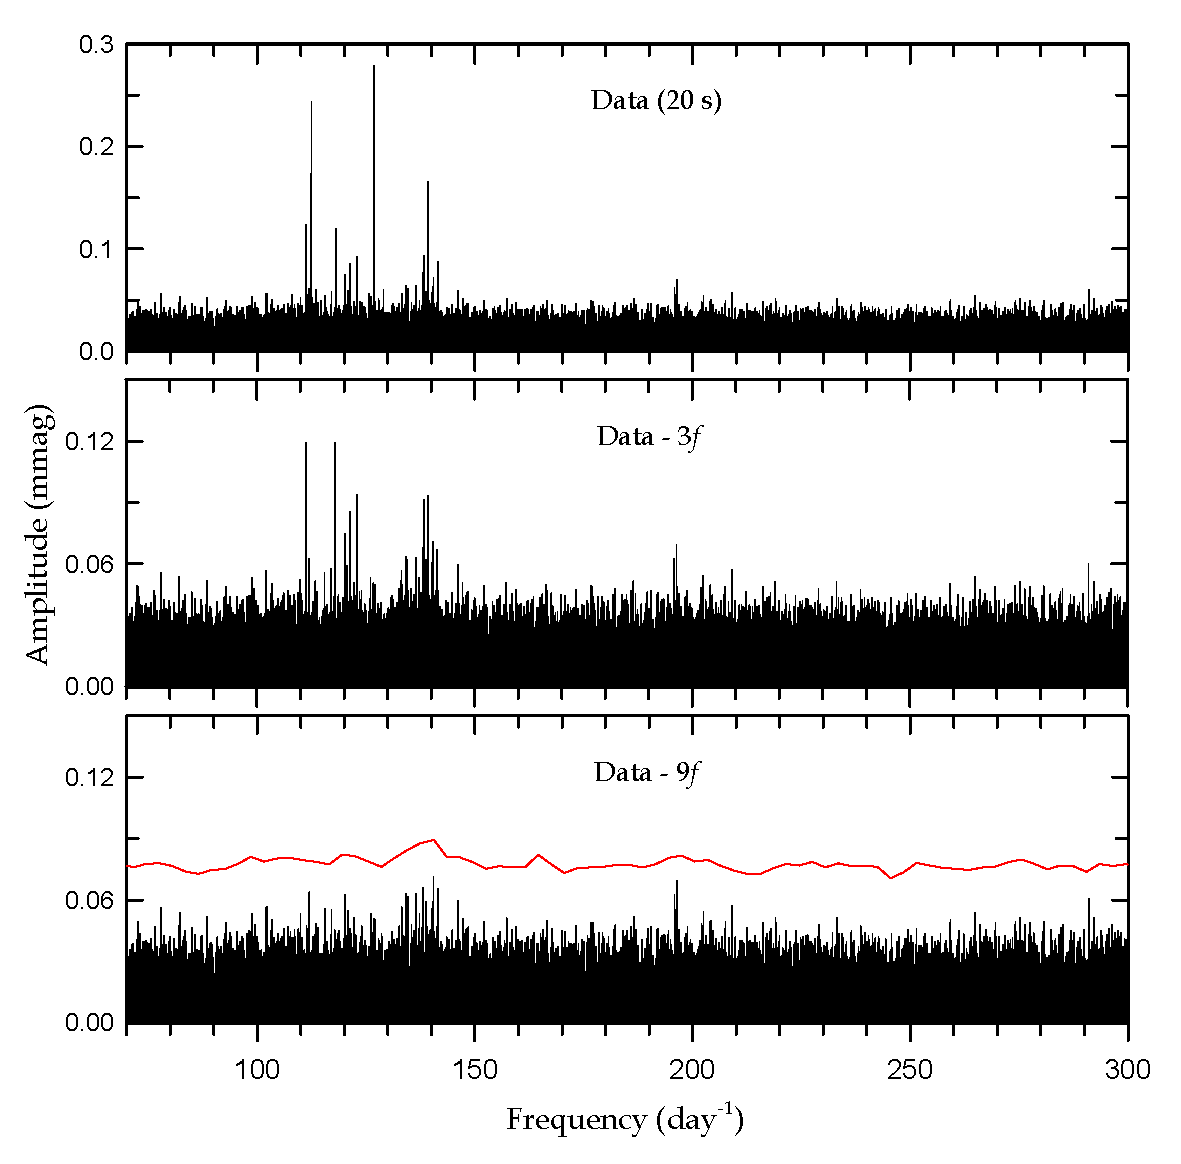
In the 3rd and 4th panels of Figure 1, the scatter band of the 2-min cadence residuals is about half that of the 20-s ones, which means that the former data is more precise than the latter and can better detect relatively low frequencies such as Sct and Dor pulsations. Nevertheless, the ultra-short cadences of 20 s would be more useful for uncovering the high-frequency signals from the pre-He WD. We introduced PERIOD04 for all 20-s residual lights except for the primary eclipse time data, where the B component is completely obscured by the MS star. In this analysis, our interest was focused on the oscillations of the pre-He WD companion with frequencies higher than 70 day-1. The PERIOD04 periodograms for the 20-s cadences with prewhitening applied are illustrated in Figure 6. We found two additional frequencies (121.33540 day-1 and 138.30988 day-1) in the analysis of 20-s sampling data compared to the 2-min data analysis. Our final results are summarized in Table 4, ordered by frequency.
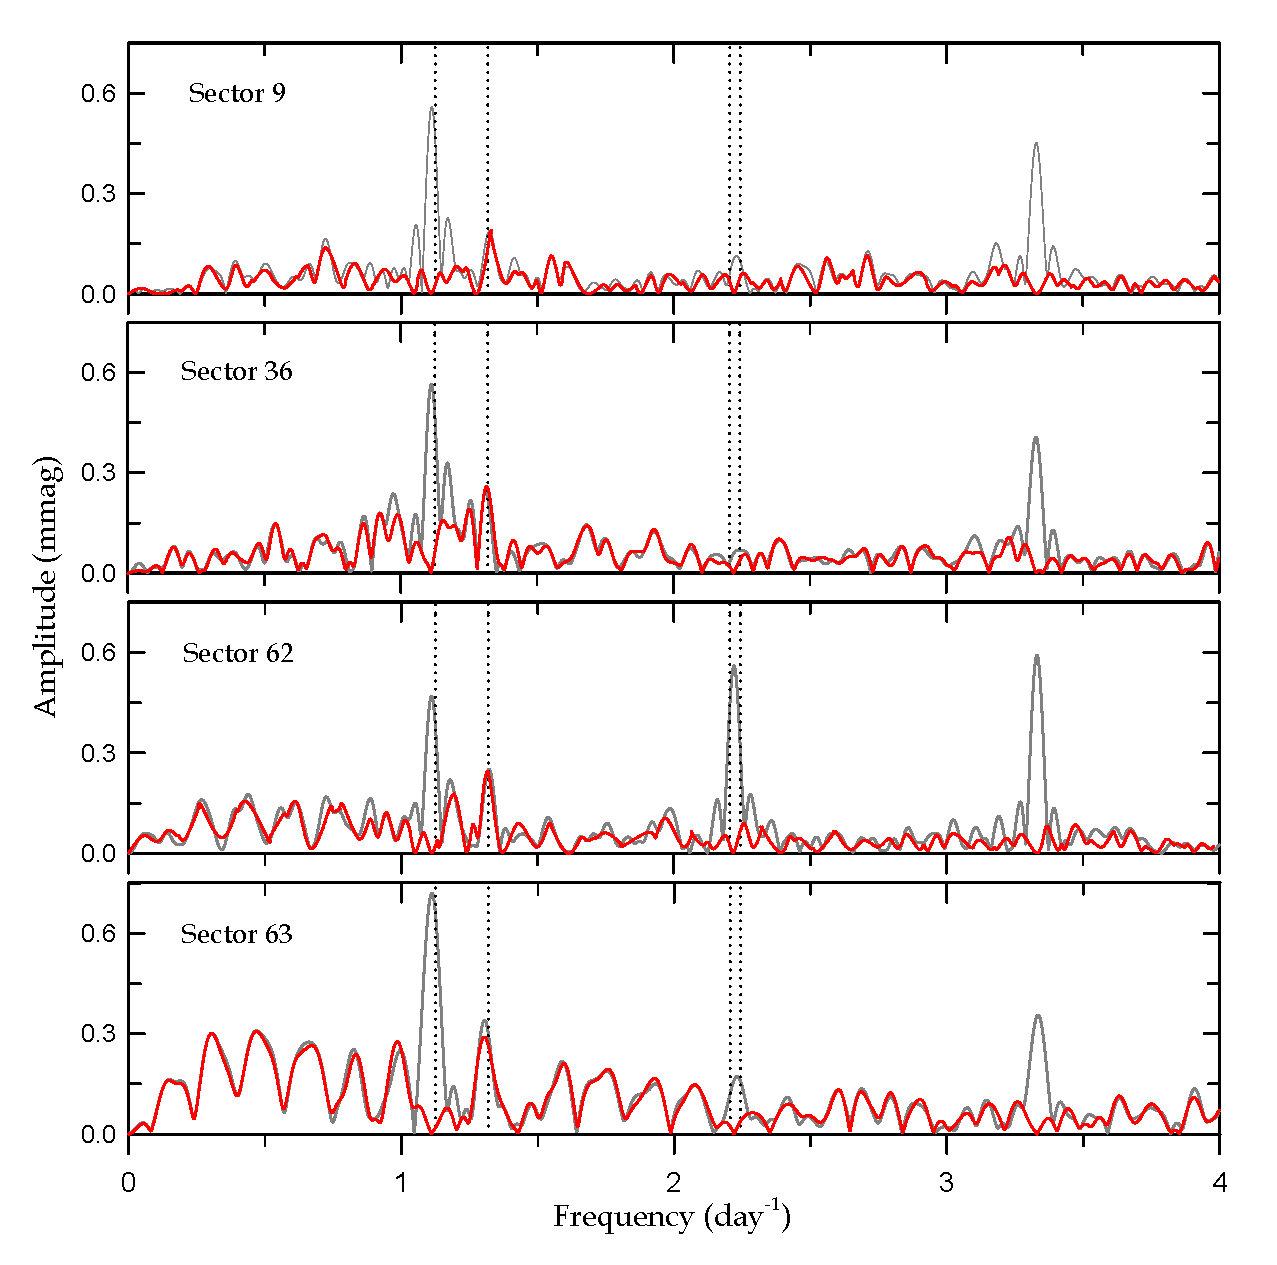
When analyzing data from multiple sectors, the long-term observation gaps between them can introduce artifact frequencies in the low frequency region due to uncorrected trends in the data. In order to validate the low frequencies detected in the full 2-min cadence data of WASP 1021-28, we analyzed the residual lights for each sector separately. The amplitude spectra of each of the four sectors (S9, S36, S62, and S63) are presented in Figure 7, where the gray and red lines represent the periodograms for the W-D model residuals and the immune data with orbital frequencies removed from them, respectively. In this figure, the frequency is present in all sectors and its SNR is greater than 4 in three sectors except S63. In contrast, the other three low frequencies are absent in any sector and are thought to be aliasing sidelobes derived from the orbital frequencies. The result of this process indicates that the low frequency of = 1.31865 day-1 is likely a Dor oscillation of WASP 1021-28 A and the high frequencies are pre-ELM variables associated with its hot companion. However, the low-frequency signal is not dominant compared to its surrounding noise peaks, so our interpretation of is preliminary and requires further verification.
6 DISCUSSION AND CONCLUSIONS
We present the UVES spectra and TESS photometric data of WASP 1021-28 to characterize a post-mass transfer EB, consisting of an A-type MS primary and a pre-He WD, and the pulsations in each component. The double-lined RVs were derived from a rotation function fitted to each BF profile rather than a Gaussian function, and the atmospheric parameters for the A component were computed with the GSSP package from the observed spectrum at a conjunction phase of 0.983, as follows: = 7411 K, [M/H] = 0.340.05 dex, and = 86.64.0 km s-1. The spectroscopic measurements were modeled in combination with the full 2-min TESS data. The modeling result, summarized in Table 3, provided the best-fit solution for the light and RV curves, and thus the absolute dimensions for each component. The mass and radius of the primary component were derived to within 1 % precision, and those of the less massive companion to about 1 % and 2 %, respectively. The observed indicates that WASP 1021-28 A is currently in a sub-synchronous state.
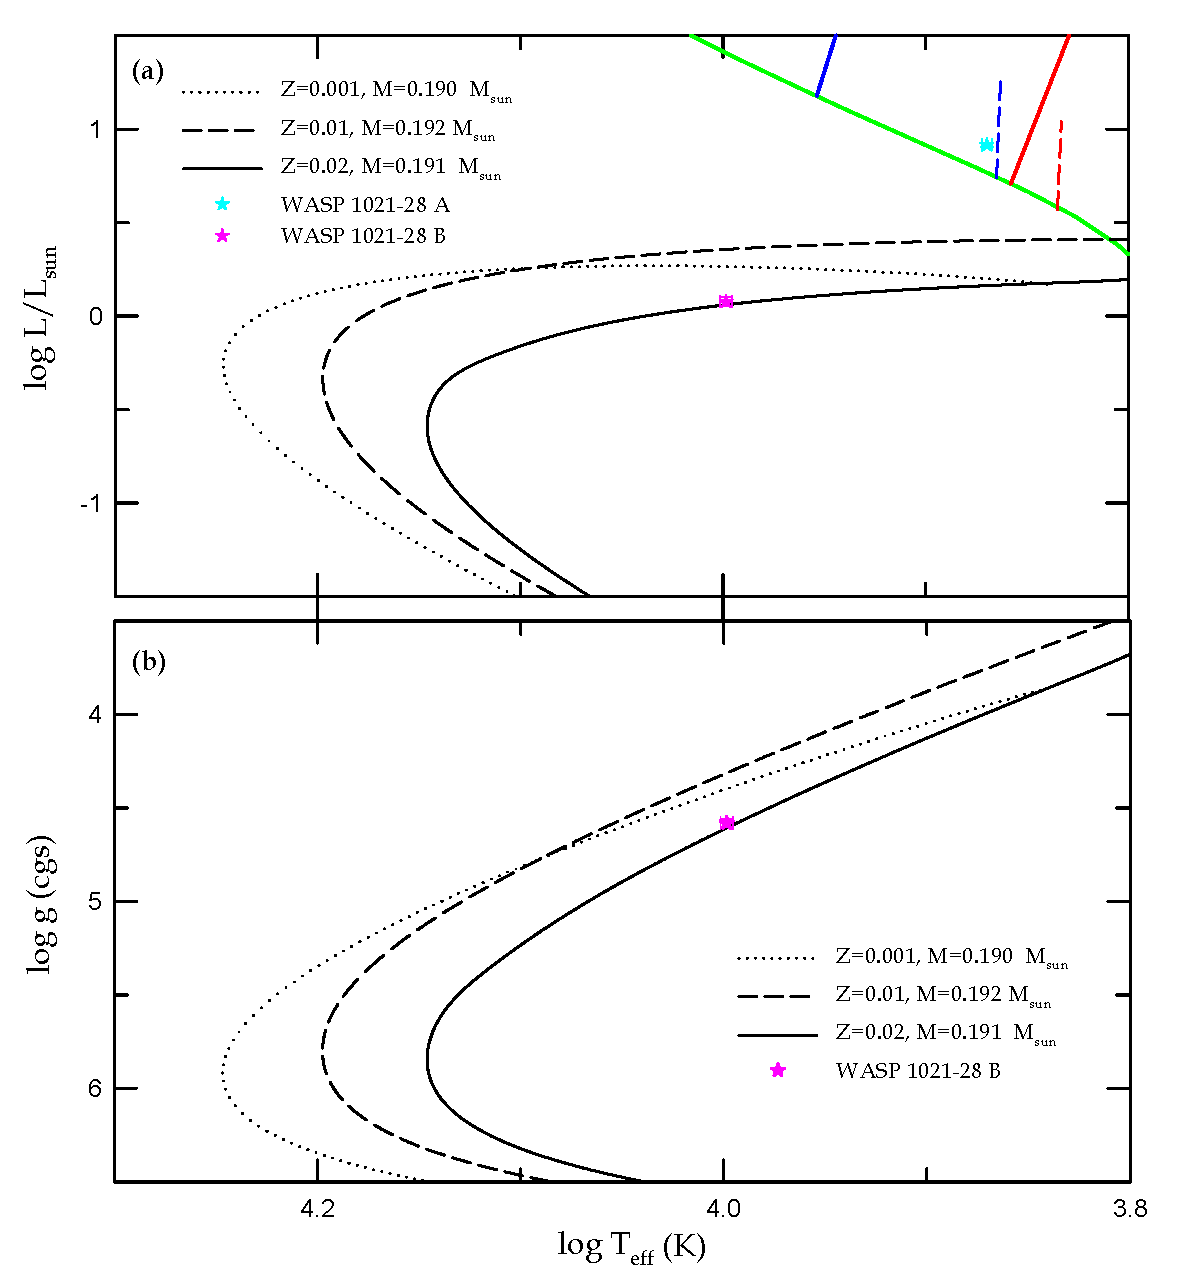
The absolute parameters of WASP 1021-28 were used to trace the evolutionary sequence and current state of the EL CVn binary in the Hertzsprung-Russell (H-R, upper) and (lower) diagrams of Figure 8. Here, the EB components are presented as cyan and pink star symbols. The oblique blue and red lines in the H-R diagram represent the empirical instability regions for the Sct (solid) and Dor (dashed) variables, which indicates that WASP 1021-28 A is a candidate intermediate-mass pulsator located on the zero-age MS. In these diagrams, the black dotted, dashed, and solid curves display the evolutionary sequences of the ELM WDs with metallicities and masses (, ) of (0.001, 0.190), (0.01, 0.192), and (0.02, 0.191), respectively (Istrate et al. 2016). As can be seen, WASP 1021-28 B matches well with the WD model for = 0.02 and = 0.191 and may be a precursor of a He-core WD evolving toward higher temperature at the midpoint of a constant luminosity stage.
To assign the population membership of WASP 1021-28, we calculated the space motion of ()444Positive toward the Galactic center, Galactic rotation, and North Galactic Pole. = (, , ) km s-1 and the Galactic orbit of (, )555Angular momentum in the direction and eccentricity = ( kpc km s-1, ), following the same procedure and solar values as Lee et al. (2020). The kinematic data for WASP 1021-28 are located near the center of the thin-disk regions in the and diagrams presented by Pauli et al. (2006). The population classification agrees well with the = 0.02 value obtained by comparing our absolute properties with ELM WD models, indicating that WASP 1021-28 is a member of the thin-disk population.
Lagos et al. (2020) reported the presence of a new K-type star at 1.0 arcsec from WASP 1021-28 AB using the high-contrast SPHERE/IRDIS images in the band. However, we did not detect such an object in the UVES spectra, excluding the EB components. This non-detection is due to the fact that the spectroscopic observations were made with a slit width of 0.8 arcsec, which is narrower than the separation between the eclipsing pair and the tertiary object. In the binary modeling, we conducted the search and detected a third light of 2.9 %, which is significantly different from that (12 %) of Çakirli et al. (2024) but consistent with the light contribution from the potential tertiary detected by Lagos et al. (2020). As presented in Section 2, the CROWDSAP value of 0.99150.0030 for WASP 1021-28 indicates that most of the TESS flux measurements come from the target star, with the remaining approximately 1 % being contaminated. Our source is then thought to be the outer tertiary of Lagos et al. (2020) around WASP 1021-28 AB. The circumbinary object would have removed most of the angular momentum from the early MS binary and contributed to its evolution into the current close pair with a short period. Moreover, the sub-synchronous rotation revealed in this paper may be affected by the perturbations of the circumbinary companion (Fuller & Felce 2023). All of these indicate that WASP 1021-28 is a post-mass transfer EB, with a distant -type tertiary and characterized by multiperiodic pulsations, making it a good benchmark target for studying the evolution and asteroseismology of EL CVn stars.
Acknowledgments
This paper includes VLT/UVES spectra made with ESO under programme 094.D-0027(A) and photometric data collected by the TESS mission. We wish to thank David E. Mkrtichian for his careful reading and valuable comments on the frequency analysis. This research has made use of the Simbad database maintained at CDS, Strasbourg, France, and was supported by the KASI grant 2025-1-830-05. M.-J.J. was supported by the grant number RS-2024-00452238 from the National Research Foundation (NRF) of Korea.
DATA AVAILABILITY
The data underlying this article will be shared on reasonable request to the first author.
References
- Baran & Koen (2021) Baran A. S., Koen C., 2021, AcA, 71, 113
- Beuzit et al (2008) Beuzit J.-L. et al., 2008, Proc. SPIE, 7014, 701418
- Blanco-Cuaresma et al (2014) Blanco-Cuaresma S. et al., 2014, A&A, 569, A111
- Bowman & Michielsen (2021) Bowman D. M., Michielsen M., 2021, A&A, 656, A15
- Cakirli et al (2024) Çakirli Ö., Hoyman B., Oz̈darcan O., 2024, MNRAS, 533, 2058
- Coelho et al (2005) Coelho P., Barbuy B., Melendez J., Sciavon R. P., Castilho B. V., 2005, A&A, 443, 735
- Dekker et al (2000) Dekker H. et al., 2000, Proc. SPIE, 4008, 534
- Dohlen et al (2008) Dohlen K. et al., 2008, Proc. SPIE, 7014, 70143L
- Flower (1996) Flower P. J., 1996, ApJ, 469, 355
- Fuller & Felce (2023) Fuller J., Felce C., 2023, MNRAS, 527, L103
- GAIA (2022) Gaia Collaboration 2022, VizieR Online Data Catalog, I/355
- Guerri et al (2011) Guerri G. et al., 2011, ExA, 30, 59
- Guo (2021) Guo Z., 2021, FrASS, 8, 67
- Hong et al (2021) Hong K. et al., 2021, AJ, 161, 137
- Istrate et al (2016) Istrate A. G. et al., 2016, A&A, 595, A35
- Kallinger et al (2008) Kallinger T., Reegen P., Weiss W. W., 2008, A&A, 481, 571
- Kallrath (2022) Kallrath J., 2022, Galaxies, 10, 17
- Kwee & van Woerden (1956) Kwee K. K., van Woerden H., 1956, BAN, 12, 327
- Lagos et al (2020) Lagos F. et al., 2020, MNRAS, 499, L121
- Lee et al (2024) Lee J. W., Hong K., Jeong M.-J., Wolf M., 2024, ApJ, 973, 113
- Lee et al (2017) Lee J. W., Hong K., Kim S.-L., Koo J.-R., 2017, ApJ, 835, 189
- Lee et al (2023) Lee J. W., Hong K., Park J.-H., Wolf M., Kim D.-J., 2023, AJ, 165, 159
- Lee et al (2014) Lee J. W., Kim S.-L., Hong K., Lee C.-U., Koo J.-R., 2014, AJ, 148, 37
- Lee et al (2020) Lee J. W., Koo J.-R., Hong K., Park J.-H., 2020, AJ, 160, 49
- Lenz & Breger (2005) Lenz P., Breger M., 2005, Comm. Asteroseismology, 146, 53
- Maxted et al (2014a) Maxted P. F. L. et al., 2014a, MNRAS, 437, 1681
- Maxted et al (2014b) Maxted P. F. L. et al., 2014b, MNRAS, 444, 208
- Maxted et al (2013) Maxted P. F. L. et al., 2013, Natur, 498, 463
- Paegert (2022) Paegert M. et al., 2022, VizieR Online Data Catalog, IV/39
- Pauli et al (2006) Pauli E.-M., Napiwotzki R., Heber U., Altmann M., Odenkirchen M., 2006, A&A, 447, 173
- Pecaut & Mamajek (2013) Pecaut M. J., Mamajek E. E. 2013, ApJS, 208, 9
- Pilecki et al (2017) Pilecki B. et al., 2017, ApJ, 842, 110
- Ricker et al (2015) Ricker G. R. et al., 2015, JATIS, 1, 014003
- Rucinski (2002) Rucinski S. M., 2002, AJ, 124, 1746
- Rucinski (2004) Rucinski S. M., 2004, in IAU Symp. 215, Stellar Rotation, ed. A. Maeder & P. Eenens (San Francisco, CA: ASP), 17
- Southworth & Bowman (2022) Southworth J., Bowman D. M., 2022, The Observatory, 142, 161
- Tkachenko (2015) Tkachenko A., 2015, A&A, 581, A129
- Torres (2010) Torres G., 2010, AJ, 140, 1158
- van Hamme (1993) van Hamme W., 1993, AJ, 106, 209
- van Hamme & Wilson (2007) van Hamme W., Wilson R. E., 2007, ApJ, 661, 1129
- van Roestel et al (2018) van Roestel J. et al., 2018, MNRAS, 475, 2560
- Vigan et al (2010) Vigan A. et al., 2010, in In the Spirit of Lyot 2010. p. E48
- Wang et al (2020) Wang K., Zhang X., Dai M., 2020, ApJ, 888, 49
- Wilson & Devinney (1971) Wilson R. E., Devinney E. J., 1971, ApJ, 166, 605
| BJD | Error | Epoch | Min | |
|---|---|---|---|---|
| 2,458,544.64284 | 0.00015 | 0.00002 | II | |
| 2,458,545.09330 | 0.00008 | 0.00001 | I | |
| 2,458,545.54347 | 0.00016 | 0.00029 | II | |
| 2,458,545.99450 | 0.00009 | 0.00029 | I | |
| 2,458,546.44472 | 0.00027 | 0.00006 | II | |
| 2,458,546.89497 | 0.00010 | 0.00014 | I | |
| 2,458,547.34582 | 0.00018 | 0.00026 | II | |
| 2,458,547.79634 | 0.00010 | 0.00034 | I | |
| 2,458,548.24629 | 0.00019 | 0.00016 | II | |
| 2,458,548.69701 | 0.00010 | 0.00011 | I |
| BJD | Phase | ||||
| (2,450,000+) | (km s-1) | (km s-1) | (km s-1) | (km s-1) | |
| 6983.82076 | 0.9831 | 0.54 | … | ||
| 6999.79441 | 0.7139 | 0.61 | 2.48 | ||
| 7018.85191 | 0.8678 | 0.50 | 2.13 | ||
| 7040.70821 | 0.1284 | 0.59 | 2.38 | ||
| 7041.86050 | 0.4074 | 0.62 | 3.02 | ||
| 7056.61863 | 0.7890 | 0.62 | 2.39 | ||
| 7070.61081 | 0.3204 | 0.58 | 2.46 | ||
| † and are the RV measurements of the primary and secondary stars, | |||||
| respectively, and and are their uncertainties. | |||||
| Parameter | Çakirli et al. (2024) | This Paper | |||
|---|---|---|---|---|---|
| Primary (A) | Secondary (B) | Primary (A) | Secondary (B) | ||
| (BJD) | 2,458,544.6430(3) | 2,458,545.093506(75) | |||
| (day) | 0.9008982(3) | 0.900898230(62) | |||
| (deg) | 85.19(4) | 83.216(85) | |||
| (K) | 7600(50) | 10,251(200) | 7411(40) | 9965(70) | |
| 2.995(1) | 3.220(2) | 2.886(21) | 2.958(31) | ||
| a | 2.007 | 2.010 | |||
| 1.0 | 1.0 | 0.890(42) | 1.0 | ||
| , | 0.337b | 0.292b | 0.522, 0.261 | 0.410, 0.199 | |
| 0.806(1) | 0.074 | 0.8980(22) | 0.0729 | ||
| c | 0.120(1) | 0.0291(20) | |||
| (pole) | … | … | 0.3602(27) | 0.0770(18) | |
| (point) | … | … | 0.3729(31) | 0.0776(19) | |
| (side) | … | … | 0.3681(30) | 0.0771(18) | |
| (back) | … | … | 0.3708(31) | 0.0776(19) | |
| (volume)d | 0.3562(1) | 0.07830(7) | 0.3665(30) | 0.0772(19) | |
| Spectroscopic orbits: | |||||
| (BJD) | … | 2,456,983.8361(22) | |||
| (R⊙) | 4.646(13) | 4.764(15) | |||
| (km s-1) | 5(2) | 6.98(23) | |||
| (km s-1) | 27(3) | 233(7) | 27.82(32) | 237.95(76) | |
| 0.116(15) | 0.1169(14) | ||||
| Absolute dimensions: | |||||
| () | 1.48(13) | 0.17(3) | 1.602(11) | 0.187(2) | |
| () | 1.65(5) | 0.36(1) | 1.746(15) | 0.368(9) | |
| (cgs) | 4.17(1) | 4.55(5) | 4.159(8) | 4.580(22) | |
| () | … | … | 0.302(8) | 3.78(29) | |
| (km s-1) | 93(3) | 20.5(6) | 98.02(86) | 20.65(51) | |
| (km s-1) | 82(2) | 26(4) | 86.6(4.0) | … | |
| () | 0.91(5) | 0.12(4) | 0.915(12) | 0.077(25) | |
| (mag) | 2.46(13) | 4.45(10) | 2.442(30) | 4.538(62) | |
| BC (mag) | … | … | 0.035(1) | 0.242(15) | |
| (mag) | … | … | 2.407(30) | 4.780(64) | |
| Distance (pc) | 513(19) | 558(9) | |||
| a Potential for the inner critical Roche surface. | |||||
| b Linear limb-darkening law was used. | |||||
| c Value at 0.25 orbital phase. | |||||
| d Mean volume radius. | |||||
| Frequency | Amplitude | Phase | SNRc | Remark | |
| (day-1) | (mmag) | (rad) | |||
| 1.124950.00004 | 0.1880.056 | 1.340.87 | 5.77 | ||
| 1.318650.00003 | 0.2370.060 | 5.610.74 | 6.77 | Dor | |
| 2.205170.00003 | 0.2040.051 | 6.160.74 | 6.79 | ||
| 2.243330.00004 | 0.1790.051 | 5.000.83 | 6.03 | ||
| 111.251320.00003 | 0.1190.027 | 2.660.67 | 7.52 | pre-ELMV | |
| 112.427760.00002 | 0.2410.027 | 1.330.33 | 15.16 | pre-ELMV | |
| 118.010160.00003 | 0.1160.027 | 3.640.68 | 7.35 | pre-ELMV | |
| 121.335400.00005 | 0.0820.028 | 1.991.01 | 4.96 | pre-ELMV | |
| 122.982000.00004 | 0.0940.027 | 2.700.85 | 5.87 | pre-ELMV | |
| 126.746210.00001 | 0.2800.026 | 5.740.27 | 18.31 | pre-ELMV | |
| 138.309880.00005 | 0.0920.031 | 1.581.00 | 5.04 | pre-ELMV | |
| 139.229540.00004 | 0.1030.031 | 1.020.89 | 5.64 | pre-ELMV | |
| 139.231630.00002 | 0.1940.031 | 5.610.47 | 10.69 | pre-ELMV | |
| a Listed in order of frequency. | |||||
| b Parameters’ errors were obtained following Kallinger, Reegen & Weiss (2008). | |||||
| c Calculated in a range of 5 day-1 around each frequency. | |||||