The Fe II problem in NLS1s
Abstract
For more than twenty years, strong FeII emission lines have been observed in Active Galactic Nuclei and in particular in Narrow Line Seyfert 1 galaxies. A quick overview of the observations and of the models proposed to interpret the Fe II spectrum is given. The influence of atomic data and of physical parameters are discussed, and it is shown that the strengths of the Fe II lines cannot be explained in the framework of photoionization models. A non-radiative heating, for instance due to shocks, with an overabundance of iron, can help to solve the problem. A comparison with other objects emitting intense Fe II lines favors also the presence of strong outflows and shocks. We suggest some issues in the context of AGN evolution.
keywords:
galaxies: active; quasars: emission lines; Fe II1 Introduction
Emission lines of Fe II have been identified in the spectra of the first quasars by Greenstein and Schmidt (1964), and soon after by Wampler and Oke (1967). In 1968, Sargent identified several strong Fe II blends in the active galaxy 1 Zw 1. The importance of Fe II in astrophysical objects prompted a meeting gathering specialists from different fields, organized in 1979 in Madrid by Mike Penston, and another one organized in 1987 in Capri by Viotti, Vittone, and Friedjung. In the meantime, several theoretical works aimed at explaining the formation of Fe II lines were published. Rapidly it was realized that Fe II lines are more intense when the broad lines are narrow, but this was attributed to the difficulty of deblending the lines. Now it is well known that they are very intense in NLS1s. In 1992 Boroson and Green identified the optical Fe II lines as the eigenvector 1 in their statistical study.
In the next section we recall the main characteristics of the Fe II atom, and in Section 3, the observational data. In Section 4 we discuss the processes of line formation, and we address in Section 5 the question of whether Fe II in NLS1s can be explained in the framework of photoionization models. In Section 6 we recall the characteristics of other objects displaying intense Fe II lines, and we suggest a clue to the Fe II problem which matches well the picture of NLS1s.
2 The Fe II atom and its spectrum
There are at least three reasons why the Fe II spectrum is so peculiar. First, as the 3d-shell is half-filled, thousands of transitions can occur. Second, FeI is easily ionized in a weakly ionized medium (Ionization Potential IP=7.9 eV), while Fe II is not (IP=16.2 eV). And third, a temperature 6000 K is sufficient to excite Fe II.
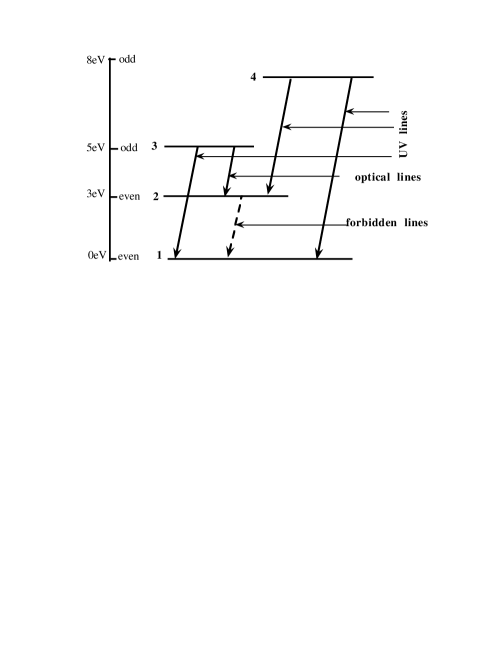
The Fe II atom can be shown schemantically by 4 levels (see Netzer, 1988) producing four types of lines (cf. Fig. 1):
-
•
Transitions between odd 5eV levels and even ground levels produce permitted UV multiplets in the range 2000 - 3000Å. The most intense multiplets are UV1, UV2, UV3, UV35, UV36, UV62, UV63 and UV64.
-
•
Transitions between odd 9eV and even 3eV levels give rise to permitted multiplets such as UV191 around 1786Å.
-
•
Transitions between even 3eV levels and even ground levels are forbidden optical multiplets, and are weak or not observed in AGN.
-
•
Transitions between odd 5eV levels and even 3eV levels correspond to the permitted optical multiplets 27, 28 and 29, around 4000Å, to the well-known feature at 4570Å including mainly multiplets 37 and 38, to multiplets 48 and 49 around 5300Å, to multiplet 40 at 6516Å, etc…
A more complete Fe II atom is given by the Grotrian diagram of the reduced atom configuration limited to 14 levels (Moore & Merill, 1968).
3 Observations of Fe II in NLS1s and in quasars
In the optical, generally only the feature around 4570Å is measured, with large variations between different authors. There are very few measurements in the UV. Moreover models are required to determine the level of the continuum, owing to the numerous lines and the Balmer continuum (cf. Wills et al., 1985). Large discrepancies arise, even on the identifications of the lines (ex: Fe III instead of Fe II is now identified in the spectrum of 1 Zw1 by Laor et al., 1997). Table 1 presents the average values of a few important features measured in the composite QSO spectrum of Francis et al. (1991), in the composite spectrum of X-bright and X-faint QSO of Green (1998), and in the well-known prototype NLS1 galaxy 1 Zw1. In 1 Zw1 the sum of all the Fe II lines is larger than in QSOs, and Fe IIUV is Fe IIopt (Fe IIUV measures the emission in the range 2000- 3000Å, and Fe IIopt the emission in the range 3500-6000Å). Moreover, the measured Fe IIopt is probably an underestimation as suggested by computations of Joly (1987) which show that Fe IIopt 10 Fe II4570.
| 688 QSO | 60 X-bright | 54 X-faint | 1 Zw1 | |
|---|---|---|---|---|
| Francis | Green 1998 | Green 1998 | ||
| et al. 1991 | ||||
| FeII2400/H | 1.2 | 0.6 | 0.8 | 2 |
| FeIIUV/H | 3.3 | 4.4 | ||
| FeII4570/H | 0.5 | 0.4 | 0.6 | 1.3-1.7 |
| FeIIopt/H | 2.6 | 6.7 | ||
| FeIItot/H | 6. | 11. |
A number of correlations have been observed:
-
•
A large Fe II4570/H ratio and a strong equivalent width W(Fe II4570) correlate with a small FWHM(H) ratio (Boroson et al., 1985, Zheng & O’Brien, 1990, Zheng & Keel, 1991).
-
•
A large Fe II4570/H ratio correlates with a weak [OIII]/H ratio (Boroson & Green, 1992, and subsequent papers).
-
•
A large Fe II4570/H ratio correlates with a blue asymmetry of H (Boroson & Green, 1992, and subsequent papers).
-
•
AGN with a large Fe II4570/H ratio have steep IR-X indices (Lawrence et al., 1997) and a steep soft X-ray continuum (Wilkes et al., 1987, Wang et al., 1996).
-
•
A large Fe II4570/H ratio corresponds to a high soft X-ray variability (Moran et al. 1996)
-
•
Fe II is strong in low ionization BAL QSOs (Hartig & Baldwin, 1986, Wampler, 1988, Junkharinen et al., 1987, Weyman et al., 1991, Sprayberry & Foltz, 1992, Boroson & Meyers, 1992).
-
•
Fe II is weak in steep spectrum radio sources (Boroson & Green, 1992).
-
•
A strong W(Fe II4570) correlates with a large R, the radio core/lobe brightness ratio in radio sources (Joly, 1991).
-
•
A large Fe II/[OIII] ratio correlates with a large R (Jackson & Browne, 1991).
4 Formation of the Fe II spectrum
Important improvements were introduced since the first model computations.
-
•
The number of levels of the Fe II model atom has been increased: Collin et al. (1986, 1988) and Joly (1981, 1987) used a 14-level atom; Krolik & Kallman (1988) used a 16-level atom; Wills et al. (1985) used 1084 multiplets, corresponding to 3407 lines; Verner et al. (1999) used 371 levels producing 68635 lines; Sigut and Pradhan (2000) are preparing an atom with 827 levels.
-
•
Experimental values for all energy levels are now available; photoionization and recombination processes are obtained from Opacity Project calculations and transition probabilities and collision strengths are estimated now with less than 30 uncertainty for strong lines.
Several possible excitation processes have been extensively discussed.
-
•
Continuum fluorescence (i.e. absorption of continuum photons by Fe II transitions, Phillips, 1978, 1979), has been shown to be inefficient unless the covering factor of the central source by the BLR is 1 and the turbulent velocity is very large (Collin et al. 1979, 1980)
-
•
Line fluorescence has also been considered for exciting high levels. Self fluorescence was studied by Netzer & Wills (1983) as well as other line fluorescence. Penston (1988) noticed that unexpected UV multiplets in the symbiotic star RR Telescopi are issued from high levels which could be excited by L. A strong efficiency requires a large turbulent velocity. Although the efficiency of the process can be high (Sigut & Pradhan, 1998; Verner et al., 1999), it is not able to double the whole Fe II flux but it can at least explain the excitation of specific lines (such as Fe II UV191).
-
•
In fact, collisional excitation is the most efficient process in AGN. It requires a high density and T 5000K as shown by Joly (1981, 1987, 1991).
5 Models
5.1 Photoionization models
Immediately after the discovery of the presence of Fe II lines in AGN spectra, it was clear that they should be formed in a dense medium, comparable to the Broad Line Region (BLR), since Fe II forbidden lines are absent. Therefore people tried to account for the Fe II spectrum in the framework of the BLR photoionization models developed in the eighties. The first models were those of Kwan and Krolik (1981) and of Netzer (1980). Netzer & Wills (1983) and Wills et al. (1985) introduced a much larger number of levels for Fe II. Photoinization models computed by Collin et al. (1986, 1988) have a small number of levels, but they solve the exact line transfer and for some of their models, the physical conditions in the BLR mimic an accretion disk. Krolik & Kallman (1988) computed photoionization models with several ionizing continua. Ferland & Persson (1989) computed CaII and Fe II models with very large thickness and low density. Sigut & Pradhan (1998) coupled the computation with CLOUDY of the structure of the emission region with a Fe II atom including 3400 transitions, with an exact line transfer of L aimed at determining accurately the influence of the fluorescence. Finally, Verner et al. (1999) used CLOUDY for an Fe II atom of 371 levels. Note that all these computations except those of Collin et al. (1986, 1988), and partly those of Sigut & Pradhan (1998), solve the line transfer with the so-called “escape probability approximation”, which is not well adapted to thick inhomogeneous media, in particular to visible permitted Fe II lines whose transfer is strongly linked with that of the (optically thick) Balmer continuum. Moreover, L fluorescence requires a thorough treatment of the line transfer taking into account partial redistribution.
| model | model | model | mixed | composite | 1 Zw1 | |
|---|---|---|---|---|---|---|
| 1 | 2 | 3 | model | QSO | ||
| L/H | 1.4 | 8 | 8 | 5 | 4.5 | 5 |
| FeIIUV/L | 0.55 | 0.4 | 0.64 | 0.47 | 0.7 | 1 |
| FeIIopt/H | 3.6 | 1.8 | 2.8 | 2.6 | 2.6 | 6.7 |
| FeIIUV/Fe IIopt | 0.2 | 1.8 | 1.8 | 0.8 | 1.3 | 0.7 |
| FeIItot/H | 5.4 | 5. | 8. | 5.1 | 6. | 11. |
Model 1: Collin et al. (1988), with low excitation, hydrostatic equilibrium as in an accretion disc, (Bac)=4;
Models 2 and 3: Wills et al. (1985), with high excitation, constant pressure and iron abundance solar and 3 times solar, respectively;
Mixed model: 45 Model 1 + 55 Model 2.
Table 2 compares the observations with three photoionization models providing the strongest Fe II lines. For all models, Fe II emission is weak compared to that observed in 1 Zw1, the prototype of the NLS1 class.
One should thus ask: WHAT WOULD BE THE NECESSARY INGREDIENTS OF A GOOD MODEL? Obviously one needs:
-
•
a large column density of Fe+ to get a large number of scatterings, in order to transform UV lines into optical lines (),
-
•
an efficient heating mechanism in the Fe+ region to get collisional excitation up to 5eV levels (5000K)
Let us see whether it would be possible to reach these conditions by playing with the parameters:
-
•
influence of the ionizing-heating continuum: a strong IR and a strong hard X-ray continuum up to gamma rays would provide more heating to the HI∗ region, but it is not observed;
-
•
influence of the ionization parameter: it is strongly constrained, as it can be neither too high (it would lead to too intense L emission, etc…), nor too low (it would not provide enough heating);
-
•
influence of the density: a high density would be favorable (to get a large Balmer opacity and to destroy Fe IIUV), but it should not be too high (the Balmer and Paschen continua would then be too large);
-
•
influence of the column density: it should be cm-2 and it can be arbitrarily large, but this will not increase the amount of Fe II emission above a given limit (since falls rapidly below the value required for Fe II excitation);
-
•
influence of the turbulent velocity: only a very high non-physical turbulence would allow an important fluorescence effect, and moreover it would decrease too much;
-
•
influence of the abundance of Fe: it is very weak, because of the thermostatic effect of Fe II; an overabundance of a factor 10 induces less than a factor 2 increase in the total flux;
-
•
influence of the number of levels: it is not important for the total Fe II emission which saturates (also the thermostatic effect)
It is thus clear that photoionization models cannot account for the Fe II emission, and the reason is that the region emitting these lines is the weakly ionized fraction of the clouds (the HI∗ region), where only a small amount of radiative flux can be absorbed per unit volume, owing to the small value of the photoionization cross sections in the soft X-ray range. For instance, in Verner et al. (1999), one sees that only 3 of the flux is emitted by this region. It also explains why an overabundance of iron cannot help to increase the Fe II emission in a photoionization model, simply because it saturates at the level of the radiative heating. One concludes that the Fe II region should be heated by an additional non radiative mechanism. It is worth noting that the energy problem cannot be solved by a strong reddening, as it would not reduce the discrepancy in the ratio Fe IIopt/H (cf. the controversy between Netzer, 1985, Collin, 1986).
5.2 Other models
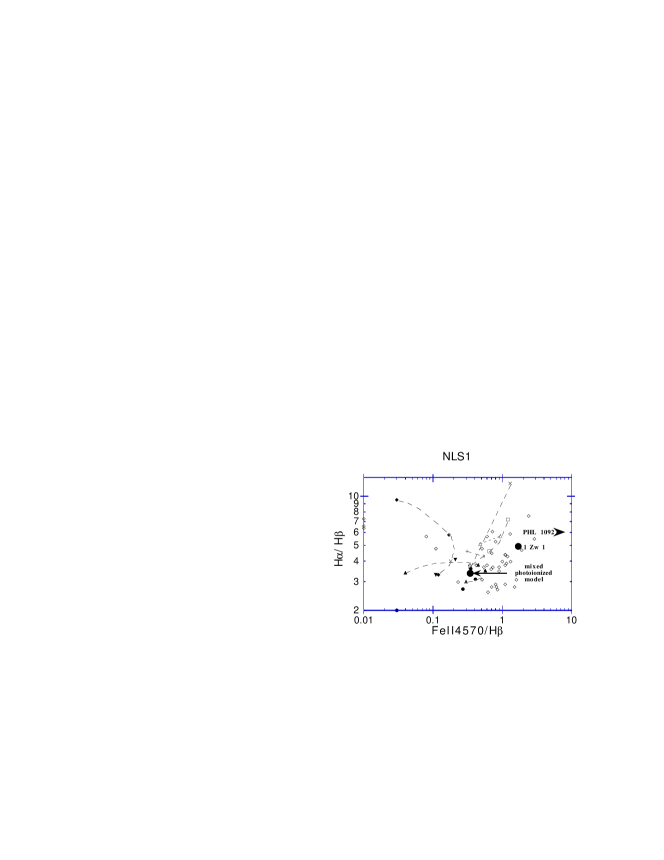
There are actually no models other than photoionization models, which require knowledge of the physics of the emission region. These are simply computations of the Fe II spectrum assuming collisional ionization equilibrium at a given temperature (Joly, 1987). In these computations, the amount of energy available to heat the medium is arbitrary, so it allows us to get large Fe II intensities. However, even in these computations, the parameters are constrained, since they could lead to anomalous line ratios. As an illustration we give in Fig. 2 the observed and computed H/H ratio as a function of the Fe II4570/H ratio (computations are from Joly, 1987). This figure shows that a small temperature ( 7000K) is required to account for the large Fe II4570/H ratios, and still the largest observed Fe II4570/H ratios are not accounted for, because they would correspond to too large H/H ratios. In these computations, the Fe abundance is normal. As the lines are optically thick, they are generally in the Voigt part of the curve of growth, so one expects their intensity to scale roughly with the square root of the abundance. In conclusion, a good fit would be obtained for a temperature of the order of 7000K, if one allows for an overabundance of a few units.
6 An empirical view
Other objects display intense Fe II lines: cool luminous stars like Miras, with winds and chromospheres, which are “non-coronal” stars; cataclysmic binaries, where it is suggested that Fe II is formed in the accretion disc, and novae in which Fe II peaks soon after the outburst, contrary to highly ionized species; symbiotic stars like RR Tel, z Aur/W Cep, where Fe II lines might be formed either in the accretion disc or in the cool component wind; luminous hot stars like PCyg and B[e] supergiants with extreme stellar winds and accretion discs; some type II supernovae. These stars are characterized either by a strong variability, or by strong outflows, and generally they have no X-ray spectrum and little or no ionizing continuum. It is therefore tempting to extend these characteristics to the Fe II emission regions of NLS1s. First, it would agree with the conclusion that the Fe II spectrum is not produced directly by photoionization but more probably in shocks. Second, it leads to a consistent scenario which matches reasonably well the present picture of NLS1s, and which could explain the above mentioned correlations.
One of the properties of NLS1s, often discussed in this meeting, is that they probably harbor relatively small black holes, accreting close to their Eddington rate. A large accretion rate means an increase of the fueling. It can be provided by non-axisymmetric perturbations, for instance the presence of a bar, which trigger an episode of star formation. A strong accretion phase is therefore most probably linked with the existence of a nuclear starburst. This should be compared to high redshift luminous quasars, where heavy element overabundances are deduced in the BLR, and (for BAL quasars) in the absorption line region, and are attributed to the presence of a starburst (Hamann & Ferland, 1993, Collin & Zahn, 1999).
The NLS1 characteristics might derive from this episode of star formation coupled with the high accretion rate. Some enrichment in Fe is likely to occur. Strong outflows (due to stars and/or to a super Eddington disc wind) could induce shocks and produce non radiative heating. The existence of outflows in NLS1s is also strongly suggested by the blue asymmetry of H (and of high ionization lines, as shown in this conference). Due to the strong outflow, the NLR might be replaced by a denser medium, thus explaining the weakness of the forbidden lines. The X-ray spectral properties (steepness and variability of the continuum) are generally attributed to NLS1s having their accretion rate in a “high state phase”, similar to that of galactic binaries. Concerning the “narrowness” of the lines, several explanations have been proposed in this workshop, in particular linked with the spectral distribution. Collin and Huré (in preparation) suggest that it could be simply due to a gravitational instability taking place in the accretion disk at a larger distance from the black hole in NLS1s than in normal Seyfert 1. Finally the anticorrelation of the Fe II line intensities with the radio power could be due to the fact that only spiral galaxies are able to provide the nucleus with enough gas to reach a high accretion rate.
References
- (1) T.A. Boroson, S.E. Persson, J.B. Oke, ApJ 293 (1985) 120.
- (2) T.A. Boroson, R.F. Green, ApJS 80 (1992) 109.
- (3) T.A. Boroson, K.A.Meyers, ApJ 397 (1992) 442.
- (4) S. Collin, M. Joly, N. Heidmann, S. Dumont, A&A 72 (1979) 293.
- (5) S. Collin, S. Dumont, N. Heidmann, M. Joly, A&A 83 (1980) 190.
- (6) S. Collin, A&A 166 (1986) 115.
- (7) S. Collin, S. Dumont, M. Joly, D. Péquignot, A&A 166 (1986) 27.
- (8) S. Collin, J.M. Hameury, A&A 205 (1988) 19.
- (9) S. Collin, J.P. Zahn, A&A 344 (1999) 433.
- (10) G.J. Ferland, S.E. Persson, ApJ 347 (1989) 656.
- (11) P.J. Francis, P.C. Hewett, C.B. Foltz, F.H. Chaffee, R.J. Weymann, S.L. Morris, ApJ 373 (1991) 465.
- (12) P.J. Green, ApJ 498 (1998) 170.
- (13) J.L. Greenstein, M. Schmidt, ApJ 140 (1964) 1.
- (14) F. Hamann, G. Ferland, ApJ 418 (1993) 11.
- (15) G.F. Hartig, J.A. Baldwin, ApJ 302 (1986) 64.
- (16) N. Jackson, I.W.A. Browne, MNRAS 250 (1991) 422.
- (17) M. Joly, A&A 102 (1981) 321.
- (18) M. Joly, A&A 184 (1987) 33.
- (19) M. Joly, A&A 242 (1991) 49.
- (20) V.T. Junkharinen, E.M. Burbidge, H.E. Smith, ApJ 317 (1987) 460.
- (21) J.H. Krolik, T.R. Kallman, ApJ 324 (1988) 714.
- (22) J. Kwan, J.H. Krolik, ApJ 250 (1981) 478
- (23) A. Laor, B.T. Jannuzi, R.F. Green, T.A. Boroson, ApJ 489 (1997) 656.
- (24) A. Lawrence, M. Elvis, B.J. Wilkes, I. McHardy, N. Brandt, MNRAS 285 (1997) 879.
- (25) E. C. Moran, J.P. Halpern, D.J. Helfand, ApJS 106 (1996) 341.
- (26) C.E. Moore, P.W. Merill NSRDS-NBS 23 (1968).
- (27) H. Netzer, ApJ 236 (1980) 406.
- (28) H. Netzer, B.J. Wills, ApJ 275 (1983) 445.
- (29) H. Netzer, ApJ 289 (1985) 451
- (30) H. Netzer, Physics of formation of Fe II lines outside LTE, Ed. Viotti, Vittone, Friedjung (1988) 247
- (31) M.V. Penston MNRAS 233 (1988) 601.
- (32) M.M. Phillips, ApJ 226 (1978) 736.
- (33) M.M. Phillips, ApJS 39 (1979) 377
- (34) T.A.A. Sigut, A.K. Pradhan (2000) preprint.
- (35) T.A.A. Sigut, A.K. Pradhan, ApJL 499 (1998) L139.
- (36) D. Sprayberry, C.B. Foltz, ApJ 390 (1992) 39.
- (37) E.M. Verner, D.A. Verner, K.T. Korista, J.W. Fergusson, F. Hamann, G.J. Ferland, ApJS 120 (1999) 101.
- (38) E.J. Wampler, J.B. Oke ApJ 148 (1967) 695.
- (39) E.J. Wampler, Physics of formation of Fe II lines outside LTE, Ed. Viotti, Vittone, Friedjung (1988) 155.
- (40) T. Wang, W. Brinkmann, J. Bergeron, A&A 309 (1996) 81.
- (41) R.J. Weyman, S.L. Morris, C.B. Foltz, P.C. Hewett, ApJ 373 (1991) 21.
- (42) B.J. Wilkes, M. Elvis, I McHardy, ApJL 321 (1987) L23.
- (43) B.J. Wills, H. Netzer, D. Wills, ApJ 288 (1985) 94.
- (44) W. Zheng, P.T. O’Brien, ApJ 353 (1990) 433.
- (45) W. Zheng, W.C. Keel, ApJ 382 (1991) 121.