HST/NICMOS2 coronagraphic observations of the circumstellar environment of three old PMS stars: HD 100546, SAO 206462 and MWC 480. ††thanks: Based on observations with the NASA/ESA Hubble Space Telescope, obtained at the Space Telescope Science Institute, which is operated by the Association of Universities for Research in Astronomy, Inc. under NASA contract No. NAS5-26555.
Abstract
The close environment of four old Pre-Main Sequence stars has been observed thanks to the coronagraphic mode of the HST/NICMOS2 camera at m. In the course of this program, the detection of a circumstellar annulus around HD 141569 has already been presented in Augereau et al. (1999b).
In this paper, we report the detection of an elliptical structure around the Herbig Be star HD 100546 extending from the very close edge of the coronagraphic mask (50 AU) to 350–380 AU (3.5–3.8) from the star. The axis ratio gives a disk inclination of to the line-of-sight and a position angle of , measured east of north. At 50 AU, the disk has a surface brightness between 10.5 and 11 mag/arcsec2, then follows a radial power law up to 250–270 AU and finally falls as . The inferred optical thickness suggests that the disk is at least marginally optically thick inside 80 AU and optically thin further out. Combined with anisotropic scattering properties, this could explain the shape of a brightness asymmetry observed along the minor axis of the disk. This asymmetry needs to be confirmed.
The circumstellar disks around SAO 206462 and MWC 480 are not resolved, leading to constraints on the dust distribution. A tight binary system separated by only is nevertheless detected in the close vicinity of SAO 206462.
Key Words.:
Stars: circumstellar matter – Stars: HD 100546, SAO 206462, MWC 4801 Introduction
Dust is present around a large fraction of Main Sequence (MS) stars, as shown by IRAS (Aumann et al. 1984). Moreover, spectroscopic (e.g. Queloz et al. 2000) and photometric (Charbonneau et al. 2000) detections indicate that planetary systems are quite common. In some cases, the dust lifetime is so short compared to the star’s age, that it has to be replenished, probably through collisions between planetesimals or through evaporation (Backman & Paresce 1993). The best example so far among these second generation disks is the one surrounding Pictoris aged more than 20 Myr (Barrado y Navascués et al. 1999). Recently, submillimeter images resolved the dust emission around a few isolated MS stars with different spectral types and older than 0.1 Gyr (Holland et al. 1998; Greaves et al. 1998).
Circumstellar disks are also present around young objects, as clearly demonstrated by HST (Padgett et al. 1999, for instance), and by ground-based observations (Dutrey et al. 1996). The latter detected circumstellar disks around a sample of CTTs in the Taurus cloud, but not yet around post T Tauri stars. This is in general agreement with Zuckerman & Becklin (1993) and more recently Habing et al. (1999) who have shown the rapid decrease of the circumstellar dust mass as the stars evolve to the Main Sequence (see also Holland et al. 1998). Gas infall is also observed towards a few Herbig Ae/Be (hereafter HAeBe) stars (e.g. Grady et al. 1996; de Winter et al. 1999), tentatively interpreted as the result of comet evaporation. In this scheme, this could indicate that planetesimal formation in the nebula is quite common and rapid, as theoretically expected.
Very few disks have been detected around HAeBe and more evolved Pre Main-Sequence (PMS) stars (HD 163296 and MWC 480, Mannings & Sargent 1997a; Mannings et al. 1997b). A recent study of HR 4796, an 8 Myr star, has evidenced that the disk is at least partly second generation and that meter-size bodies should already be present (Augereau et al. 1999a). Similar conclusions could apply for the HD 141569 disk (Augereau et al. 1999b). In both cases, the analysis relies on detailed studies of the resolved images and spectral energy distributions (SEDs). From a general point view, the nature of transient disks, the role of replenishing planetesimals if any, and the most relevant physical processes in these environments are still to be clarified.
The general evolutionary scenario, to be tested and precised is then that : 1) the protoplanetary disks around young, embedded stars clear out before the star reaches the main sequence through dynamical activity and interaction with stellar radiation and that 2) new optically thin circumstellar disks may be sustained around older MS stars by destruction processes among planetesimals (collisions, evaporation), formed during the Pre-Main Sequence (PMS) phase. The transition between those two phases, when the original young disk is eroded, is critical to validate the above scenario. Such a study can be performed on disks around evolved PMS stars. Critical points for this study are the analysis of opacity to stellar radiation and collisional processes time-scales. Both of them require detailed information on the spatial distribution and amount of circumstellar dust.
During HST/Cycle 7, we probe in coronagraphic mode the environment of four evolved PMS stars with the NICMOS2 camera. As part of this program, we reported the positive detection of an extended ( AU in radius) structure around HD 141569 in Augereau et al. (1999b). The detection was confirmed by Weinberger et al. (1999). We address in the present paper our results for three other sources of large interest among old PMS stars : HD 100546, SAO 206462 and MWC 480. After a brief description of the observing strategy, journal of observation and reduction procedure (section 2), we present in section 3 the results for HD 100546. An extended structure is detected and interpreted in terms of circumstellar dust arranged within an inclined disk. Detection limits are derived from unresolved structures around SAO 206462 and MWC 480 (sections 4 and 5) and in each case we discuss the implications on the dust distribution. We also detail the close vicinity of SAO 206462 which exhibits a tight binary system.
2 HST/NICMOS2 observations and data analysis
| Star Name | Spectral Type | V mag | Date | Integration Time | Same Orbit ? | |
|---|---|---|---|---|---|---|
| Object : | HD 100546 | B9Vne | 6.68 | Nov 09, 1998 | 1647.958 s 12 m 47 s | |
| Reference : | HD 106797 | A0V | 6.07 | Nov 09, 1998 | 1647.958 s 12 m 47 s | Yes |
| Object : | SAO 206462 | F4Ve(a) ; F8V(b) | 8.65 | Aug 22, 1998 | 7111.931 s 13 m 03 s | |
| Reference : | SAO 206463 | F2(c) ; A2(d) | 7.9 | Aug 22, 1998 | 7191.961 s 22 m 24 s | Yes |
| Object : | MWC 480 | A2 | 7.72 | Feb 24, 1998 | 1139.953 s 7 m 20 s | |
| Reference : | HD 29646 | A2V | 5.73 | Feb 24, 1998 | 1131.959 s 5 m 52 s | Yes |
| Star Name | Distance [pc] | Luminosity [L⊙] | Mass [M⊙] | [K] | Age [Myr] | Other Name |
|---|---|---|---|---|---|---|
| HD 100546 | (a) | (a) | (a) | (a) | (a) | SAO 251457 |
| SAO 206462 | (b) ; (c) | (d) ; (e) | HD 135344 | |||
| MWC 480 | (f) | (f) | (f) ; (g) | (f) | (f) ; (g) | HD 31648 |
2.1 Target selection
Our aim was to image circumstellar environments of transition (old PMS) objects
to establish the missing link between disks around young embedded
objects and Pic-like stars in order to compare the disks with
those (optically thick) of young stars on the one hand, and that
(optically thin) of Pictoris on the other hand. Our four targets : HD 100546,
SAO 206462, MWC 480 and HD 141569 were selected according to the following
criteria :
- to be PMS stars close to the MS, which can be characterized by a
large IRAS excess, together with an age estimation
(via photometry or spectroscopy) of about 106–107 years.
- to be surrounded by circumstellar dust (IR excess) and CO. CO detection
indeed provides a good indication for the gas to be extended.
- to have been observed at various wavelengths to allow comprehensive
investigation.
2.2 Observing strategy
The high level of contrast between the investigated circumstellar environments and their central star implies the use of coronagraphic techniques. The subtraction of residual Point Spread Fonction (PSF) wings is required to take full benefit of the coronagraph’s high contrast capabilities. For that, we observed in the same optical configuration a comparison star within a few degrees of the science target, of similar or slightly higher brightness, with similar spectral type and thought to be free of circumstellar matter.
Comparison stars need to be observed close in time to each corresponding science target observation because of the slight possible variation of the PSF with time. This method has proved to be efficient for ground-based coronagraphic data with adaptive optics, especially because it is still efficient if the PSF is not perfectly symmetrical. It also allows the detection of circumstellar disks far from edge-on orientation.
2.3 NICMOS2 data
We obtained coronagraphic images of our four targets with the HST/NICMOS2 camera between February and November, 1998. All the observations were performed in Filter F160W (m, m). For the three targets presented in this paper, the observing log is summarized in Table 1. The individual integration times were determined so as to stay below the saturation limit of the detector on the brightest pixels (near the central hole edge area). Filter F160W was selected for optimum detectability: the PSF is well sampled and the background (zodiacal light and thermal background) remains low.
2.4 Reduction procedure, photometry and astrometry
For each observed star, the calibrated files (in counts/s) provided by the STScI are coadded to form a single image of the star during a same orbit. The reduction procedure then consists in subtracting the comparison star carefully scaled to the star of interest. The determination of the scaling factor is critical since a small change can significantly modify the photometry or in the worst case induce artifacts. It is assessed by azimuthally averaging the profile resulting from the division between the star of interest by the reference star images (see also Augereau et al. 1999b).
We use the 2.07710-6 Jy . s / counts factor to convert NICMOS count rates to absolute fluxes and a zero point flux density of 1040.7 Jy to convert to magnitudes (NICMOS data handbook, version 4.0, dated december 1999). Point source photometry is obtained by integrating the total flux within a 0.5 radius circular aperture, then applying a 1.15 correcting factor to compensate for the flux which fell out of this aperture (NICMOS photometry update web page).
The pixel scale slowly varies with time but stays within the range 0.075–0.076 in average.
3 HD 100546
3.1 A Herbig Be star close to the ZAMS
The HD 100546 star has been intensively studied since it was identified as a member of the HAeBe group (Hu et al. 1989). Indeed, HD 100546 is a B9Vne star showing a strong infrared excess peaked at about 25 m (IRAS) due to circumstellar material and then fulfills the criterions proposed by Waters & Waelkens (1998) to identify HAeBe stars. Some astrophysical parameters are summarized in Table 2.
The position of the star in the HR diagram indicates that HD 100546 is close to the ZAMS leading to an estimated age larger than 10 Myr (van den Ancker et al. 1997). This star, associated with the dark cloud DC 296.2-7.9 (Hu et al. 1989; Vieira et al. 1999), is surrounded by a large amount of dust: between a few tens (Bouwman et al. 2000) and a few hundred Earth masses (Henning et al. 1998). The dust is rich in C and O and in particular PAH and silicates (Malfait et al. 1998). The latter are very valuable since they constrain the dust optical properties. ISO observations also evidenced similarities between the 10 m emission of the circumstellar dust and that of comet Hale-Bopp (Crovisier et al. 1997; Malfait et al. 1998).
As commonly observed for other HAeBe stars, HD 100546 exhibits photometric, polarization and spectroscopic variability (Grady et al. 1996, 1997; van den Ancker et al. 1998; Yudin & Evans 1998; Clarke et al. 1999; Vieira et al. 1999). The interpretation of such events in particular in terms of star-grazing comets (Grady et al. 1997; Vieira et al. 1999) remains however uncertain (Lagrange et al. 2000; Beust et al. 2000).
Another issue concerns the very distribution of the material surrounding HD 100546. The disk detection in scattered light between 40 (0.4) and 200 AU (2) by Pantin et al. (2000) reveals a 50 inclined disk almost in the SE-NW direction. At mm, an extension as large as 15–20 in radius and close to detection limit is also reported by Henning et al. (1998) in the same direction. From the theoretical point of view, it is unclear whether the circumstellar material arranges within a single disk. For instance, the presence of an additional envelope is proposed to reproduce the full spectral energy distribution (Henning et al. 1994) and to explain specific spectroscopic events (Vieira et al. 1999).
3.2 Results
3.2.1 Resolved disk and vicinity
The azimuthally averaged radial profile of the ratio between HD 100546 and the reference star HD 106797 shows two basic distinct regimes: up to 3.5–3.8, the profile decreases with distance from the star then reaches a plateau further out. The same behavior arises using the A2 and A1 reference stars dedicated to MWC 480 and HD 141569 respectively. A resolved structure around HD 100546 is then detected below 3.5–3.8. A 3 uncertainty of 2% is obtained on the scaling factor used to subtract the reference star to HD 100546 which directly impacts on the precision of photometric measurements.
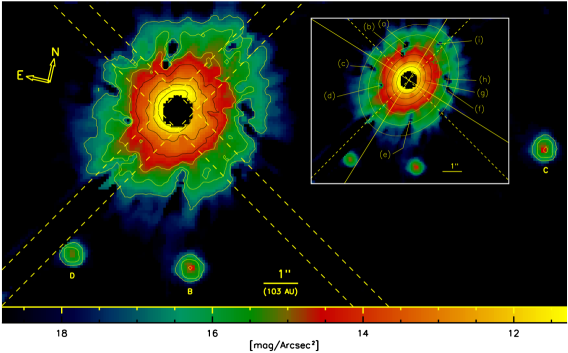
The final calibrated image is shown in Figure 1 and reveals an extended and elliptical structure centered on the star. We interpret this structure in terms of circumstellar material located in an inclined disk. A visual inspection suggests the direction subtended by the spider arm at a position angle (PA, measured east of north) of 148 as an axis of symmetry for the inclined disk, at least at large distances. A more robust method (ellipse-fitting to the isophotes) leads to a PA of 1615 but the result might be affected by different noise sources. Whatever the method, the global direction of the disk is consistent with Pantin et al. (2000) observations but the precise PA is found to be at least 20 larger than the measurements of Pantin et al. (2000). The axis ratio corresponds to a disk inclination of 513 with respect to the line of sight, assuming that the disk is axisymmetric, and agrees with the results of Pantin et al. (2000). We measure a total flux density of 737 mJy (the uncertainty is dominated by the uncertainty on the scaling factor used to subtract the PSF star).
Some companion stars are also detected in the close vicinity of HD 100546. The three brightest ones are shown in Figure 1 and measured astronomical parameters, namely projected separations, PAs and magnitudes, are summarized in Table 3.
| Label | Projected distance | PA | magnitude |
|---|---|---|---|
| [Arcsec] | [degrees] | filter F160W | |
| B | |||
| C | |||
| D |
3.2.2 Radial surface brightness profiles
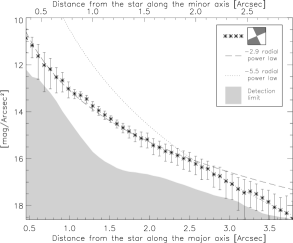
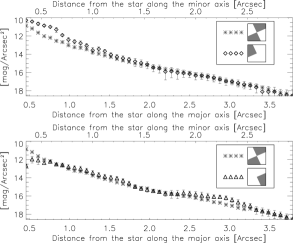
The radial brightness profiles of the disk are assessed by azimuthally averaging the surface brightness on elliptical contours. The radial profile measured towards the major axis of the disk is shown in the left panel of Figure 2. It reveals a smooth and continuous decrease of the surface brightness with the distance from the star from the very close edge of the coronagraphic mask up to 2.5. Beyond 2.5, the profile is steeper and reaches the detection limit (grey area in Figure 2) at 3.5–3.8. Basic radial power-laws properly fit this measured surface brightness profile with indexes in the radial range [0.5,2.5] and outside of 2.7.
The surface brightness profiles along the minor axis (NE and SW sides of the disk) are shown in the right panels of Figure 2. To allow direct comparison with the results along the major axis, we plot the profiles versus deprojected distances. They correspond to the observed distances along the minor axis over . As a confirmation of the isophote ellipse fitting procedure, the main shape of the minor axis profiles superimposes well on the major axis one.
3.2.3 NE-SW brightness asymmetry
However, a significant brightness enhancement arises in the NE direction mainly below 0.7–0.8 in projected distances but not in the opposite direction. Also in the same radial range, the behavior of the SW profile better follows the major axis profile down to 0.5. Below this distance, the SW side of the disk is slightly fainter but with a poor level of confidence (very close to the detection limit). This NE-SW brightness asymmetry is clearly evidenced in Figure 1.
To emphasize the asymmetry, we subtract a synthetic disk which fits the disk isophotes to the observed disk of HD 100546. In the NE side, the subtraction shown in Figure 3 reveals an excess of flux up to 1.1 mag/Arcsec2 at 0.5-0.6 collimated in a direction close to the minor axis of the disk (plain line). In the SW side, the systematic pattern at about 2.2, responsible for the shape of the radial profile shown in the bottom right panel of Figure 2, is clearly evidenced.
We first checked whether this asymmetry could result from a bad centering of the PSF star during the reduction procedure. To significantly decrease the inner brightness asymmetry, the reference star has to be shifted by more than 1.5 pixel in the NE direction. This leads to unrealistic strong asymmetries in all the rest of the image which characterize an obvious bad centering of the subtracted PSF star. The asymmetry arises close to the position of a diffraction spike which might seem suspicious. But due to a good alignment, the diffraction spikes were completely removed during PSF subtraction and did not require any further process which would have directly cause the effect.
Could it be due to instrumental effects then? HD 100546 and the reference star have been observed during the same orbit. Therefore, orbit-to-orbit variations, such as the migration ( 0.25 pixel) of the coronagraphic hole on the detector or defocus for instance (Schultz et al. 1999), cannot account for the observed effect. Another issue concerns the mis-centering of the star behind the mask during target acquisition. An accuracy of a few tenths of pixel is reached when centering PSF on the occulting mask but a mis-centering of the star by only a third of pixel can produce brightness asymmetries mainly within 0.4–0.5 in radius (Schultz et al. 1999). Observations at different roll angles would help to check whether the asymmetry is real or an artifact.
![[Uncaptioned image]](/html/astro-ph/0009496/assets/x4.png)
![[Uncaptioned image]](/html/astro-ph/0009496/assets/x5.png)
3.3 Discussion and interpretation
3.3.1 Disk radiation to stellar luminosity ratio at 1.6 m
The measured flux density of the disk at 1.6 m corresponds to 10.40.1 mag according to the zero point flux provided by the STScI. On the other hand, the V-H color index observed by Hu et al. (1989) and more recently Kurucz spectrum fitting by Malfait et al. (1998) indicate that the disk emission represents 55% to 60% of the total flux in the H-band. This excess may be due to the thermal emission of hot grains at very short distances from the central star, presumably close to the grain sublimation limit (a few fraction of AU, see also Figure 6). Obviously this excess falls below the coronagraphic mask used during present observations (the mask radius is 0.35 or 36 AU in situ according to Hipparcos measurements). Assuming H=5.88 for HD 100546 (Malfait et al. 1998), our flux density measurement provides a lower limit of for the scattered to photospheric flux ratio at 1.6 m with an uncertainty of %. This is about 2.5 less than the ratio inferred by Pantin et al. (2000) in J band.
3.3.2 Normal optical thickness of the disk
As a first step in analyzing the data, we assume that the disk is optically thin whatever the direction. Since the disk is inclined with respect to the line-of-sight, it is then straightforward to derive the normal optical thickness at 1.6 m. This requires some reasonable assumptions on the optical dust properties. Both method and assumptions are summarized in Appendix A. The result is shown in the upper panel of Figure 4. In this simple approach, the disk appears indeed optically thin vertically at 1.6 m everywhere in the resolved radial range but reaches a quite high maximum of 0.06 close to the mask’s edge.

Following Krist et al. (2000), we then assess the midplane optical depth by assuming that the vertical shape of the disk is a Gaussian with a similar scale height of 20 AU at 140 AU from the star and a disk flaring index of . We find a midplane optical depth between 50 AU and the outer edge of the resolved disk. It falls below 0.1 between 80 AU and the outer edge. This would indicate that the optically thin regime may not apply in the inner regions of the disk and that part of the stellar light is obscured at large distances in the midplane leading to an underestimation of . This is in line with the large millimeter flux (Henning et al. 1994, 1998), that suggests that the disk is at least marginally optically thick in part.
3.3.3 Normal surface density and minimum mass of the dust disk
The optically thin approach is usefull to determine a lower limit on the normal surface density in solids (see Appendix B). Since we assume a grain size distribution proportional to , depends both on the minimum () and maximum () grain sizes in the disk. Dust grains are assumed to be icy porous aggregates made of a silicate core and coated by organic refractories. Two dust chemical compositions are considered: amorphous and crystalline grains with porosities of 0.5 and 0.95 respectively (see appendix A and Augereau et al. 1999a, for more details on the model used). is plotted in Figure 5 for different minimum grain sizes. Between 50 AU and 100 AU for instance, is as large as a few g.cm-2 and about one order of magnitude larger if grains are at the blow-out size limit (m, see Figure 13). In terms of dust mass between 50 AU and 390 AU, this corresponds to a few Earth masses at most (the dust mass is about M⊕) and is at least one order of magnitude less than dust masses inferred from infrared or millimeter excesses (Bouwman et al. 2000; Henning et al. 1998). Obviously, if meter-sized bodies are formed, the normal surface density as well as the mass in solids should be multiplied by at least a factor of 10. The dust mass may also be significantly larger if the optical thickness inferred is underestimated.

3.3.4 Shape of the dust distribution in the optically thin approach
follows a radial power law up to about 270 AU. Similar distributions are found for disks around T Tauri stars (e.g. Dutrey et al. 1996). The modeling of cloud core infall with no viscosity also predicts disk surface densities proportional to (Lin & Pringle 1990). Similarly, the surface density of the solar nebula during the disk dissipation is expected to follow a radial power law under the assumption that the utilization of available solids to built planets in the Solar System is not efficient (Cameron 1995). In that frame, and given the conclusions on the optical thickness in section 3.3.2, the inner part of the disk can rather be considered of first generation.
Outside of 270 AU, falls as . A similar discontinuity of the dust distribution has already been reported in the case of the Pictoris disk. If the dynamics of the HD 100546 disk further than 270 AU is similar to that of the outer part of Pictoris disk (namely, supplied in small grains by collisions among planetesimals and radiation pressure), we would expect the disk radial density distribution to follow a radial power law (Lecavelier des Etangs et al. 1996). Such a disk, assumed optically thin and seen perfectly edge-on, indeed produces a midplane surface brightness proportional to (Nakano 1990) as typically observed for Pictoris (Heap et al. 2000). The latter conclusion also requires quite isotropic scattering properties. With these assumptions, the HD 100546 disk would then flare as . But the dynamical similarities between the HD 100546 and Pictoris disks at large distances remains an open issue.
3.3.5 On the NE-SW brightness asymmetry
What can produce the NE-SW brightness asymmetry if this is not an artifact due to instrumental effects? Although dust distribution asymmetries can not be ruled out, the fact that the brightness asymmetry of the HD 100546 disk occurs in a direction close to its minor axis tends to indicate that this would be rather due to scattering properties.
In the case of an optically and a geometrically thin inclined disk, anisotropic scattering properties can produce similar asymmetries but they should occur whatever the distance from the star. In present case, the asymmetry mostly appears at short distances where the normal optical thickness reaches values close to .
The transition between the (marginally) optically thick regime in the inner disk and the optically thin regime at large distances combined with anisotropic scattering properties may explain the shape of the observed NE-SW brightness asymmetry. Further observations and models are needed to confirm that issue.
3.3.6 Dust temperature and minimum grain size in the disk
Hu et al. (1989) first claimed that the HD 100546 dust disk consists of a cold and a hot dust populations to account for the overall IR excesses. The relatively high spectral resolution of ISO spectra between m and 180 m yielded Malfait et al. (1998) to propose temperature ranges for the two dust populations. Figure 6 shows these four isotherms as a function of the distance from the star and of the minimum grain size in the disk. The light-grey areas represent then the two dust populations. We only consider amorphous grains since amorphous silicates are supposed to be at least ten times more numerous than crystalline ones (Malfait et al. 1998).
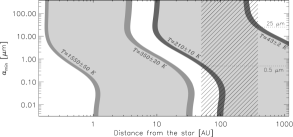
In terms of spatial extent, the cooler population derived by Malfait et al. (1998) is consistent with the dust resolved in scattered light if the grains are larger than m (see Figure 6: intersection of the light-grey and dashed areas). Indeed, grains at K (the temperature corresponding to the inner edge of the colder population) smaller than a half micron lie further than AU. Such grains would induce a detectable cut-off in the dust distribution somewhere between 50 AU and 100 AU which is not observed.
3.3.7 Consistency of the scattered light image with IR excesses
The dust resolved in scattered light, colder than 210 K according to Malfait et al. (1998), is expected to be responsible for most of the long wavelength IR excesses. At 100 m, the SED is mainly featureless and the IR excess mostly comes from an underlying continuum (Malfait et al. 1998). We can then compare the observed flux at 100 m to the thermal emission implied by the normal surface densities deduced from present scattered light images in the optically thin approach (Figure 4).

Figure 7 shows this comparison versus for two different disk inner edges: the first one at 50 AU and the second at 10 AU. In the latter case, has been extrapolated down to 10 AU with a -0.92 radial power law. The distance of 10 AU has been chosen because it corresponds to the position of 210 K grains larger than typically the blow-out size limit (m, Figures 13 and 6).
Whatever , the predicted flux never reaches the observed limit. The optically thin approach does not then bring any upper limit on the minimum grain size in the disk. Even grains larger than 10–20 m lying in the 10 AU-inner-edge disk radiate a flux 2.5 to 3 times smaller than the measured emission.
As already noticed, the optically thin approach may underestimate the surface density, indicating that part of the dust mass does not contribute to scatter light images but may emit at 100m. For instance, with the assumed dust distribution, increasing the dust mass by a factor of 40 would still be compatible with the observations if the grains are submicronic.
4 SAO 206462
4.1 The HD 135344 multiple system
The F4Ve star SAO 206462 (Waelkens et al. 1990a, b) forms a visual binary system named HD 135344 with SAO 206463 20.4 away almost in the Northern direction. The latest star, that we used as the comparison star during our HST/NICMOS2 observations, has a spectral type between F2 (CDS) and A2 (Myers et al. 1998). Among our targets, SAO 206462 is the less luminous star but exhibits the largest relative infrared excess (, Coulson et al. 1995). Dust emission features at 3.29 m, 7.8 m and 11.3 m have been evidenced by Coulson et al. (1995) and attributed to aromatic molecules of a few angströms (Sylvester et al. 1996). CO is also detected by Zuckerman et al. (1995) and Coulson et al. (1998) whose abundance suggests a low gas to dust ratio (, Coulson et al. 1998) if CO is representative of the gas content (i.e. not depleted with respect to the other species) consistent with that of Vega-like stars.
Coulson et al. (1995) and Malfait et al. (1998) derived from the full SED modeling a two dust component description of the disk. However, without imaging, the cooler dust that is present in the outer part of the disk ( typically 10 AU) is not precisely constrained. Moreover, as shown by Kenyon & Hartmann (1997), a single thin (not flared) disk can not account for the observed infrared excess and yields Sylvester et al. (1997) to propose either the presence of an envelope or accretion activity.
4.2 Results
4.2.1 Disk detection limit
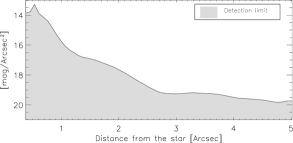
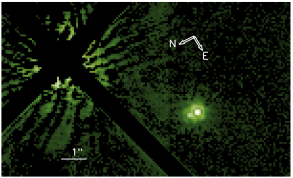
No obvious feature that could be attributed to circumstellar dust is detected in the 1.6 m images of SAO 206462 (Figure 10). The corresponding detection limit (Figure 8) shows that at 1.6 m the disk is fainter than 13.5–14 mag.arcsec-2 further than 0.4 (35 AU) and fainter than 16 mag.arcsec-2 at 93 AU (1.1), i.e. close to the inner disk edge derived by Sylvester et al. (1997) from SED modeling. In the optically thin approach, this can be interpreted in terms of an upper limit on the normal optical thickness of about (Figure 9) outside of 0.4 in radius (35 AU). The dust material further than 35 AU (if any) then is either optically thin at 1.6 m or does not contribute at this wavelength due starlight occultation by the dust closer to the star.
![[Uncaptioned image]](/html/astro-ph/0009496/assets/x11.png)
![[Uncaptioned image]](/html/astro-ph/0009496/assets/x12.png)
4.2.2 Implications on the dust distribution
With the rough assumption that the dust surface density is proportional to (as typically observed for young stars and which implies the larger mass), the dust mass between 35 AU and 420 AU would be less than: M⊕. It corresponds to 0.25 M⊕ assuming g.cm-3. This must be compared to the few Earth masses required to reproduce the full SED (Sylvester et al. 1997; Coulson et al. 1998) assuming moreover a maximum grain size at least 10 times smaller than for present work.
A large fraction of the dust mass (optically thin approach) or at least a large amount of dust (optically thick approach) is then certainly confined within the first few tens of AU. This is consistent with the mean cold population position of 23 AU derived by Coulson et al. (1995) but not with Sylvester et al. (1997) (who assume very small grains in the disk, 50 Å). Present results agree with the disk size limit of 60 AU inferred by Jayawardhana et al. (2000) from their unresolved 10 and 18 m images.
4.2.3 A tight binary system close to SAO 206462
A close binary system in the SW direction is detected in the vicinity of SAO 206462 (Figure 10). The brightest companion is 5.80.15 away from SAO 206462 at PA=129.80.8. The two close companion stars are separated by only 0.320.04 almost aligned along the NS axis; we find a PA of 3527 for the third companion with respect to the brightest one. In Filter F160W, the secondary companion has magnitude of 15.20.1 and the third companion is about 6.3 times fainter (mag = 17.20.1).
5 MWC 480
5.1 A sub-arcsec dust disk
Among our sample, MWC 480 is the only one for which circumstellar gas has been imaged (Mannings et al. 1997b). The resolved structure shows Doppler shifts characteristic of the disk rotation over angular scale of a few arcsec and inclined by from edge-on. Meanwhile, the dust continuum emission in millimeter also appears elongated in the same direction but is less extended (HWHM 0.6 or 80 AU).
Two dust populations seem required to account for the overall infrared excesses. For instance, a combination of a geometrically thin disk and an envelope is proposed by Miroshnichenko et al. (1999) (see also Malfait et al. 1998). As in the case of Pictoris, the 10 m spectrum of MWC 480 shows features attributed to silicates (in particular crystalline olivine) similar to that of long-period comets in our solar system (e.g. comet Levy, Sitko et al. 1999).
5.2 Detection limit and implications on the dust distribution
According to the detection by Mannings et al. (1997b), the dust disk is expected inside an angular region smaller than 1 in radius, a region where it is challenging to resolve faint structures because of PSF subtraction residues and diffraction spikes for example. Actually, very close to the edge of the mask, we do not find any convincing features which would clearly reveal the presence of the circumstellar disk. The azimuthally averaged noise on the image, interpreted in terms of detection limit, is shown in Figure 11.
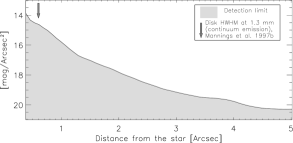
We applied in the case of MWC 480 strictly the same technique as the one used to derive some interesting properties on the SAO 206462 disk. Similarly, we conclude that either the disk further than 60 AU is optically thin at 1.6 m or that the starlight is at least partially masked by a large amount of dust inside 60 AU (Figure 12).
For instance, if we constrain the dust mass between 60 AU and 660 AU to be smaller than 170 M⊕ in solids and assuming (Mannings et al. 1997b), we find an upper limit on the surface density at 60 AU of g.cm-2. This is consistent with the results in the optically thin approach from our scattered light observations (Figure 12) even if grains are as large as a few hundred microns and even if we rather assume that only 10% of the dust mass lies further 60 AU. The present observations confirm then that most of the the dust mass is confined inside the first hundred of AU as shown by Mannings et al. (1997b).
![[Uncaptioned image]](/html/astro-ph/0009496/assets/x15.png)
![[Uncaptioned image]](/html/astro-ph/0009496/assets/x16.png)
6 Conclusion
Among our four HST/NICMOS2 Cycle 7 targets, two circumstellar disks have been resolved in scattered light. In this paper, we report the positive detection of an extended inclined disk around HD 100546 a typical transient old-PMS star expected to be in a disk dissipating phase. The shape of the derived surface density, the normal optical depth and, if confirmed, the brightness asymmetry along the minor axis of the inclined disk indeed indicate that the HD 100546 circumstellar environment certainly traces a stage between “first generation” massive disks around PMS stars and those of “second generation” around MS stars (Vega-like disks).
Disk non-detections are reported for both SAO 206462 and MWC 480. In each case, the detection limit in scattered light allows to infer constraints on the dust location consistent with observations at other wavelengths.
Acknowledgements.
We thank the referee, Dr. M.L. Sitko, for helpful suggestions.Appendix A Disk normal optical thickness
The disk normal optical thickness can be straightforwardly derived from the normal surface brightness if we assume that the disk is axisymmetrical and optically thin.
More precisely, the disk normal surface brightness in scattered light is:
where: is the total received flux (star+disk) at the considered wavelength , is the distance from the star, is the scattering phase function, is the scattering cross-section averaged over the grain size distribution and is the grain normal surface density distribution. This equation assumes that grain properties do not strongly depend on .
On the other hand, the normal optical thickness is given by:
where is the averaged extinction cross-section. Finally, we have:
![[Uncaptioned image]](/html/astro-ph/0009496/assets/x17.png)
![[Uncaptioned image]](/html/astro-ph/0009496/assets/x18.png)
The ratio depends on the wavelength, on the grain size distribution and on grain properties (shape, chemical composition … ). In the following, we assume m and a collisional grain size distribution proportional to between and . Grains are assumed to be spherical ( is the radius) and is fixed to 1 cm. We adopt the two types of grains as proposed in Augereau et al. (1999a), namely: amorphous “ISM-like grains” with porosity of about 50% and crystalline “comet-like grains” with large porosity (%). Grains are assumed to be made of silicates, organic refractories and a small amount of water ice (10%). We use the Maxwell-Garnett effective medium theory to compute the complex index of refraction of the aggregate and the Mie theory to derive the optical properties.
For , the ratio reaches a constant value close to 0.5 (Bohren & Huffman 1983). Then if we note:
we have:
where represents a correcting factor which must be applied for the smallest , where the geometric optics approximation does not apply. versus is shown in Figure 13 for the two types of grains. Note that for larger than a few , is very close to the albedo of the smallest grains. For simplicity, we assume that grains scatter isotropically, then: .
Appendix B Disk normal surface density
The normal surface density of the disk is obtained by:
assuming . The grain density depends on the grain properties. It is about g.cm-3 for amorphous grains and ten times smaller for crystalline grains due to the large porosity.
The ratio plotted in Figure 14 is the correcting factor (as for the normal optical thickness). It must be applied for the smallest , i.e. where the more numerous grains (those with sizes close to ) are not efficient scatterers. But in the same time (for the same smallest ), is proportional to and then the normal surface density does not depend any more on the minimum grain size.
The normal surface density can therefore be inferred from the observed surface brightness if the disk is seen almost pole-on. If the disk is not resolved, it is also possible to derive an upper limit on from the detection limit. Obviously, the main uncertainty on comes from the lack of strong constraints on the minimum and maximum grain sizes in the disk.

References
- Allen (1973) Allen C.W., 1973, Astrophysical Quantities, Third edition, eds. The Athlone Press LTD.
- Augereau et al. (1999a) Augereau J.C., Lagrange A.M., Mouillet D., Papaloizou J.C.B., Grorod P.A., 1999a, A&A 348, 557
- Augereau et al. (1999b) Augereau J.C., Lagrange A.M., Mouillet D. & Ménard F., 1999b, A&AL, 350, 51
- Aumann et al. (1984) Aumann H.H., Gillett F.C., Beichman C.A., de Jong T., Houck J.R., Low F.J., Neugebauer G., Walker R.G. & Wesselius P.R, 1984, ApJL 278, 23
- Backman & Paresce (1993) Backman D. and Paresce F. 1993, in Protostars and Planets III, (ed. E.H. Levy and Lunine), Tucson: University of Arizona Press, p. 1253
- Barrado y Navascués et al. (1999) Barrado y Navascués D., Stauffer J.R., Song I. & Caillault J.-P., 1999, ApJL 520, 123
- Beust et al. (2000) Beust H., Karmann C. & Lagrange A.M., 2000, A&A, submitted
- Bohren & Huffman (1983) Bohren C.F., Huffman D.R., 1983, Absorption and scattering of light by small particles, Wiley, New-York
- Bouwman et al. (2000) Bouwman J. et al., 2000, IAU Symposium S202, Manchester, UK
- Cameron (1995) Cameron A.G.W., 1995, Meteoritics 30, 133
- Charbonneau et al. (2000) Charbonneau D.B., Brown T.M., Latham D.W. & Mayor M., 2000, ApJL 529, 45
- Clarke et al. (1999) Clarke D., Smith R.A. & Yudin R.V., 1999, A&A 347, 590
- Coulson et al. (1995) Coulson I.M. & Walther D.M., 1995, MNRAS 274, 977
- Coulson et al. (1998) Coulson I.M., Walther D.M. & Dent W.R.F., 1998, MNRAS 296, 934
- Crovisier et al. (1997) Crovisier J., Leech K., Bockelée-Morvan D., Brooke T.Y., Hanner M.S., Altieri B., Keller H.U. & Lellouch E., 1997, Science 275, 1904
- de Winter et al. (1999) de Winter D., Grady C. A., van den Ancker M. E., Pérez M. R., Eiroa C., 1999, A&A 343, 137
- Dunkin et al. (1997) Dunkin S.K., Barlow M.J., Ryan S.G., 1997, MNRAS 286, 604
- Dutrey et al. (1996) Dutrey A., Guilloteau S., Duvert G., Prato L., Simon M., Schuster K. & Ménard F., 1996, A&A 309, 493
- Grady et al. (1996) Grady C.A., Perez M.R., Talavera A., Bjorkman K.S., de Winter D., Thé P.-S., Molster F.J., van den Ancker M.E., Sitko M.L.,Morrison N.D., Beaver M.L., McCollum B. & Castelaz M.W., 1996, A&AS 120, 157
- Grady et al. (1997) Grady C.A., Sitko M.L., Bjorkman K.S., Perez M.R., Lynch D.K., Russel R.W. & Hanner M.S., 1997, ApJ 483, 449
- Greaves et al. (1998) Greaves J.S., Holland W.S., Moriarty-Schieven G., Jenness T., Dent W.R.F., Zuckerman B., McCarthy C., Webb R.A., Butner H.M., Gear W.K. & Walker H.J., 1998, ApJL 506, 133
- Habing et al. (1999) Habing H. J., Dominik C., Jourdain de Muizon M., Kessler M. F., Laureijs R. J., Leech K., Metcalfe L., Salama A., Siebenmorgen R., Trams N., 1999, Nature 401, 456
- Heap et al. (2000) Heap S.R., Lindler D.J., Lanz T.M., Cornett R.H., Hubeny I., Maran S.P., Woodgate B., 2000, ApJ 530
- Henning et al. (1994) Henning Th., Launhardt R., Steinacker J. & Thamm E., 1994
- Henning et al. (1998) Henning Th., Burkert A., Launhardt R., Leinert C. & Stecklum B., 1998, A&A 336, 565
- Holland et al. (1998) Holland W.S., Greaves J.S., Zuckerman B., Webb R.A., McCarthy C., Coulson I.M., Walther D.M., Dent W.R.F., Gear W.K. & Robson I., 1998, Nature 392, 788
- Hu et al. (1989) Hu J.Y., Thé P.S. & de Winter D., 1989, A&A 208, 213
- Jayawardhana et al. (2000) Jayawardhana R., Fisher R.S., Telesco C.M., Piña R.K., Barrado y Navascues D., Hartmann L., Fazio G., 2000, PhD thesis
- Kenyon & Hartmann (1997) Kenyon S.J.& Hartmann L., 1997, ApJ 323, 714
- Krist et al. (2000) Krist J.E., Stapelfeldt K., Ménard F., Padgett D., Burrows C., 2000, ApJ 538, 793
- Lagrange et al. (2000) Lagrange A.M., Backman D., Artymowicz P., 2000 in PPIV, pp 639-672
- Lecavelier des Etangs et al. (1996) Lecavelier des Etangs A., Vidal-Madjar A. & Ferlet R., 1996, A&A 307, 542
- Lin & Pringle (1990) Lin D.N.C., & Pringle J.E., 1990, ApJ 358, 515
- Malfait et al. (1998) Malfait K., Waelkens C., Waters L.B.F.M., Vandenbussche B., Huygen E. & de Graauw M.S., 1998, A&AL 332, 25
- Mannings & Sargent (1997a) Mannings V., & Sargent A.I., 1997a, ApJ 490, 792
- Mannings et al. (1997b) Mannings V., Koerner D.W., Sargent A.I., 1997b, Nature 388, 555
- Miroshnichenko et al. (1997) Miroshnichenko A., Ivezić Z. & Elitzur M., 1997, ApJL 475, 41
- Miroshnichenko et al. (1999) Miroshnichenko A., Ivezić Z., Vinković D. & Elitzur M., 1999, ApJL 520, 115
- Myers et al. (1998) Myers J.R., Sande C.B., Miller A.C., Warren Jr. W.H., Tracewell D.A., 1998, Sky2000 Master Catalog, Goddard Space Flight Center, Flight Dynamics Division
- Nakano (1990) Nakano T., 1990, ApJL 355, 43
- Padgett et al. (1999) Padgett D.L., Brandner W., Stapelfeldt K.R., Strom S.E., Terebey S. & Koerner D., 1999, AJ 117, 1490-1504
- Pantin et al. (2000) Pantin E., Waelkens C., Lagage P.O., 2000, A&AL, in press
- Queloz et al. (2000) Queloz D., Mayor M., Weber L., Blecha A., Burnet M., Confino B., Naef D., Pepe F., Santos N.C., Udry S., 2000, A&A 354, 99
- Schultz et al. (1999) Schultz A.B., Storrs A.D., Fraquelli D., Instrument Science Report NICMOS-99-006
- Sitko et al. (1999) Sitko M.L., Grady C.A., Lynch D.K., Russell R.W., Hanner M.S., 1999, ApJ 510, 408
- Sylvester et al. (1996) Sylvester R.J., Skinner C.J., Barlow M.J. & Mannings V., 1996, MNRAS 279, 915
- Sylvester et al. (1997) Sylvester R.J., Skinner C.J. & Barlow M.J., 1997, MNRAS 289, 831
- van den Ancker et al. (1997) van den Ancker M.E., Thé P.S., Tjin A Djie H.R.E., Catala C., de Winter D., Blondel P.F.C. & Waters L.B., 1997, A&A 324, L33
- van den Ancker et al. (1998) van den Ancker M.E., de Winter D., Tjin A Djie H.R.E., 1998, A&A 330, 145
- Vieira et al. (1999) Vieira S.L.A., Pogodin M.A. & Franco G.A.P., 1999, A&A 345, 559
- Waelkens et al. (1990a) Waelkens C., Engelsman E., Waters L.B.F.M., Van der Veen W.E.C.J. & Trams N.R., 1990a, in ”From Miras to Planetary Nebulae: Wich Path for Stellar Evolution?”, eds. Menessier M.O. and Omont A., Editions Frontières, France, p.470
- Waelkens et al. (1990b) Waelkens C., Van Winckel H. & Trams N.R., 1990b, in IAU Symp. 145, ”Evolution of stars: The Photospheric Abundance Connection”, Poster Papers, p.21, eds. Michaud, Tutukov & Bergevin, Montreal, Canada
- Waters & Waelkens (1998) Waters L.B. & Waelkens C., 1998, ARA&A 36, 233
- Weinberger et al. (1999) Weinberger A.J., Becklin E.E., Schneider G., Smith B.A., Lowrance P.J., Silverstone M.D., Zuckerman B., Terrile R. J., 1999, ApJL 525, 53
- Yudin & Evans (1998) Yudin R.V. & Evans A., 1998, A&AS 131, 401
- Zuckerman & Becklin (1993) Zuckerman B. & Becklin E.E., 1993, ApJ, 414, 793
- Zuckerman et al. (1995) Zuckerman B., Forveille T. & Kastner J.H., 1995, Nature 373, 494