AN EMPIRICALLY BASED MODEL FOR PREDICTING INFRARED LUMINOSITY FUNCTIONS, DEEP INFRARED GALAXY COUNTS AND THE DIFFUSE INFRARED BACKGROUND
Abstract
We predict luminosity functions and number counts for extragalactic infrared sources at various wavelengths using the framework of our empirically based model. Comparisons of our galaxy count results with existing data indicate that either galaxy luminosity evolution is not much stronger than , where , or that this evolution does not continue beyond a redshift of 2. However, a derivation of the far infrared background from COBE-DIRBE (Cosmic Background Explorer–Diffuse Infrared Background Experiment) data suggests a stronger evolution for the far-infrared emission, with in the redshift range between 0 and 1. We discuss several interpretations of these results, and also discuss how future observations can reconcile this apparent conflict. We also make predictions of the redshift distributions of extragalactic infrared sources at selected flux levels which can be tested by planned detectors. Finally we predict the fluxes at which various future surveys will become confusion limited.
keywords:
infrared sources, galaxies, background radiationsmalkan@astro.ucla.edu
stecker@lheapop.gsfc.nasa.gov
1 Introduction: Motivation for Extending Previous Work
Observational cosmology is just starting to benefit from unprecedented sensitivity gains at wavelengths longward of 1 m. A prime example is the breakthrough achieved by the COBE satellite in the first detections of the Cosmic Infrared Background (CIB) radiation at wavelengths from 2 to 300 m. These measurements provide crucial information about the integrated luminosity of galaxies. Especially at the longer wavelengths, where the K-corrections of individual galaxies actually reverse sign, the CIB measurements constrain the evolution of the galactic luminosity function (LF) back to cosmologically interesting redshifts (0.5).
To elucidate these constraints, we started with the simple empirically based model which we used previously to calculate the CIB (Malkan and Stecker 1998, MS98 hereafter). In MS98, we made use of infrared observations of galaxies over a wide range of luminosities and at various wavelengths. We assumed that the systematic dependence of galaxy spectra with luminosity which we observe today also applies at earlier cosmic times. We then started with the present-day infrared luminosity function of galaxies, and assumed a pure luminosity evolution for each galaxy, with out to a redshift of of 1 or 2, beyond which no further evolution occurred.
In this paper, we use the framework of our empirically based model (MS98) to derive luminosity functions at various infrared wavelengths and to make infrared galaxy count predictions. These calculations should provide timely predictions which will aid in the planning and interpretation of ongoing and new deep infrared imaging observations and their implications in understanding galaxy formation and evolution. We also re-examine our CIB calculations and compare them with the recent data.
Several new telescopes have, or soon will obtain deep extragalactic number counts of infrared and millimeter sources in large regions of the sky at high galactic latitude which are relatively free of galactic foreground infrared emission. Surveys have recently been completed with the ISOCAM Infrared Space Observatory Camera) and ISOPHOT (Infrared Space Observatory Photometer) imagers on the Infrared Space Observatory, ISO and with SCUBA (Submillimeter Common User Bolometer Array) on the James Clerk Maxwell Telescope. Several new ones are planned, e.g., with SIRTF ( Space Infrared Telescope Facility), SOFIA (Stratospheric Observatory for Infrared Astronomy), IRIS (Infrared Imaging Surveyor), and FIRST (Far Infrared and Submillimeter Telescope).
Even though spectroscopic redshifts are difficult to obtain for more than a handful of the faint infrared sources, there is a high likelihood that a significant fraction of them is at cosmologically interesting distances. Thus, deep galaxy number counts of sufficiently large areas will provide statistical information about galaxies at large lookback times, and therefore about galaxy formation and evolution. We use our model here to predict such number counts. We also re-examine our predictions of the spectral energy distribution (SED) of the CIB, in light of the subsequent COBE results.
If redshifts can also be measured (spectroscopically or photometrically) for statistically significant subsamples of faint infrared sources, even more details of the evolution can be determined. Therefore, in this paper we also make predictions of the redshift distributions of galaxies at selected flux levels which will be accessible in the future. Finally, we use the model predictions to estimate the flux levels at which various surveys should become confusion limited.
2 Galaxy Spectral Energy Distributions
The two key factors determining the infrared counts are the evolution of star formation rates, and the amount and distribution of dust grains in galaxies as a function of luminosity and time. Growing observational evidence indicates that the dust contents of high-redshift galaxies was not very different from what is observed in present day galaxies (see Malkan 1998; 2000 for reviews). The more luminous low-redshift galaxies contain enough dust around their actively star-forming complexes to absorb much of the ultraviolet continuum light, and re-emit it in the mid infrared and far infrared. The ratio of infrared luminosity to blue and ultraviolet luminosity can exceed one, and this ratio is observed to be a systematically increasing function of galaxy luminosity, or current star formation rate (Spinoglio et al. 1995). Furthermore, the enhanced dust emission in luminous galaxies arises from relatively warm grains which emit at 25 to 60 m. We have made the simplifying assumption that the same systematic correlations of dust content and resulting spectral shape as a function of luminosity that we measure at also apply to galaxies at larger redshifts.
MS98 used the correlations of bolometric luminosity with the luminosities at 12, 25, 60 and 100 m from Spinoglio et al. (1995) to define the spectral shape of galaxies as a function of their luminosities at or , their luminosities at 60 m and 12 m respectively. In the near infrared, we assume luminosity independent spectral shapes with intrinsic zero-redshift average colors of: [0.55m–2.2m] = 3.2 mag, [0.8m–2.2m] = 2.0 mag, [1.2m–1.6m] = 0.9 mag and [1.6m–2.2m] = 0.4 mag.
At long wavelengths, MS98 assumed greybody thermal emission appropriate for dust grains with emissivity , following the correlation in Appendix B of Spingolio et al. (1995). In this paper we have improved the description of the emission longward of 100m, the last IRAS (Infrared Astronomy Satellite) band. We have used the growing sets of 60 to 200 m galaxy photometry data becoming available from the ISOPHOT instrument on ISO. As summarized by Spinoglio et al. (2000), new far-infrared photometry is now available for dozens of nearby galaxies which span a wide range in luminosity. These observations confirm the prediction of Spinoglio et al. (1995) that the galaxies with “warmer” (i.e. bluer or flatter) 60 to 100m spectral slopes also appear warmer in the 100 to 200 m region, where their thermal dust spectra approach a Rayleigh-Jeans distribution modified by dust emissivity where . We also confirm their finding that the warmer dust (associated with regions of recent star formation) increases the 60 m flux relative to the flux longward of 100 m systetmatically in the more infrared-luminous galaxies.
Thus we are able to use these ISOPHOT observations to make a direct calibration of the average long-wavelength spectrum of galaxies as a function of their 60 m luminosity. We describe the 100 to 200m spectra as a broken power law with a break at 145 m. The slopes above and below 145m have the same luminosity dependence
and
where is the luminosity of a typical normal galaxy at 60m, erg s-1.
At a given luminosity, the overall shapes of our average infrared spectra (from MS98) agree well with those used in other published calculations (Pearson et al. 2000; Xu et al. 2000; Takeuchi et al. 2000). There is a tendency for our models to predict more flux around 5 m in luminous starburst galaxies. We believe that our SEDs in this wavelength range are more realistic because they are empirically based on interpolations using 3.5 and 12 m photometric databases of a large number of galaxies. Therefore, they take account of the very hot dust which is quite often found to produce an “excess” 3.5 m flux, over and above that obtained by merely extrapolating stellar photospheric fluxes longward of 2 m.
3 Galaxy Luminosity Functions
In our calculation, the four luminosity relations obtained by Spinoglio et al. (1995) at 12, 25, 60 and 100 m (and our estimates at 2.2 and 3.5 m) were inverted so that a luminosity at any given rest wavelength could be determined from the 60 m luminosity, . This allowed us to make a mapping of the 60 m luminosity function (LF) of Lawrence et al. (1986) into LFs at any infrared wavelength using the transformation relation
Given the fairly good scaling of other wavelengths with the 60 m luminosity, the Jacobian term on the right (which conserves total number of galaxies) varies from 1.0 in the 25 to 60 m range, up to 1.25 at 12 and 300 m.
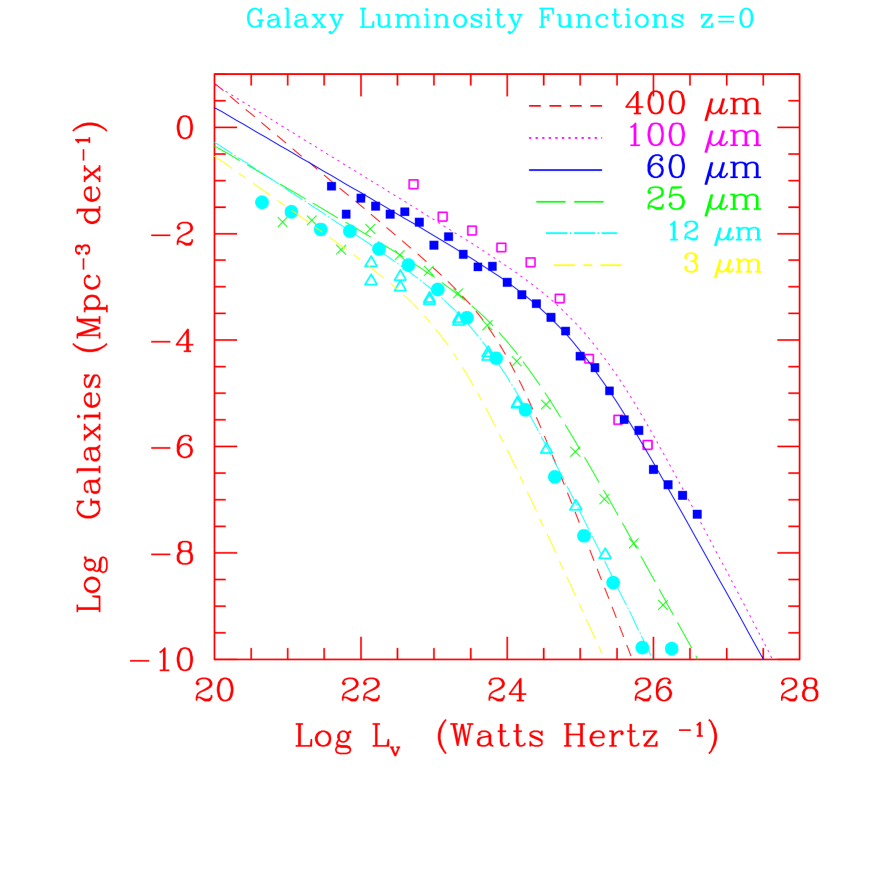
MS98 made calculations with 60 m LFs from Saunders et al. (1990) and from Lawrence et al. (1986). In this paper we adopt the parameters from Lawrence et al. (1986), viz., and with a normalization constant of , because they give a better match to the local 60 m counts. In Figure 1 we show the galaxy luminosity functions at a redshift of 0 based on our model.
The 12m LF has essentially the identical shape to the bolometric LF of non-Seyfert galaxies, because the 12m flux is a constant 6% of the bolometric flux for all galaxy types except normal ellipticals (Spinoglio et al. 1995). By comparison, the 25 m and 60m LFs are flatter. They extend out more strongly to high luminosities because high-L galaxies emit a relatively larger fraction of their bolometric luminosities at 25 to 60m. Conversely, the 3 m and 400m LFs are much steeper. This is because it is the less luminous galaxies which emit relatively more power at 3 m and 400m.
For comparison, we also plot estimated local luminosity functions at 12, 25, 60 and 100m, taken from the literature. The 25 m and 100m data (’s and open squares, respectively) are from Shupe et al. (1998) and Soifer and Neugebauer (1991). The particular fiducial LF we have used was specifically fitted to the 60m data points (shown as solid squares). Thus it is not surprising that the model LF (solid line) matches these observations extremely well. The validity of our wavelength transformation equations is confirmed by comparison of our model LF’s with data at longer and shorter wavelengths. Our model LF at 12m (dot-dash line) agrees well with the data from Rush, Malkan & Spinoglio (1993, solid circles, which include AGN in the totals). New determinations of the 12m and 15m LF’s (open triangles from Xu et al. 1998), and at 25 m find substantially fewer low luminosity galaxies. One reason for this is understood: in contrast to the other LF estimates, these two new determinations were corrected for the overdensity of nearby low luminosity galaxies in the Virgo cluster. These two corrected LFs thus may be be more representative of the present day Universe. However, if we are using LF’s to predict number counts of bright sources in the Northern sky, the actual local LF of Rush et al. (1993) would give more accurate results. On the other hand, our 100 m model LF has a slightly flatter slope than the data, but with essentially identical overall normalizations. Our use of the Lawrence et al. (1986) LF is an adequate compromise fit to all of the local IRAS data from 12 to 100m.
Fortunately, none of these subtleties makes a significant difference in the predicted counts. This is because the characteristic bent shape of the LF guarantees that the counts at any flux level are always dominated by the number of galaxies around the characteristic position of the knee in the LF, defined to be . As long as all the LF’s are accurate around (where there is virtually no disagreement), they will yield almost exactly the correct source number counts. We confirmed this by recalculating the predicted CIB for the Saunders et al. LF. Holding all other parameters constant, it is about 10% lower at essentially all infrared wavelengths than the CIB prediction based on the Lawrence et al. LF.
Since MS98 demonstrated that active galaxies (AGN) contribute less than 10% of the diffuse extragalactic infrared background, a fraction within the errors of the models and the data, we neglect the AGN component to the CIB in this work. Xu et al. (2000) also reached the same conclusion.
4 Galaxy Evolution
The luminosity functions at higher redshifts were calculated using the pure luminosity evolution relations
where
where the subscript 60 refers to a wavelength of 60 m and is the galaxy luminosity evolution parameter, respectively. We note that these are differential luminosity functions and that we follow the common convention where they are measured per unit logarithmic interval of luminosity.
We adopt here the same evolutionary assumptions as MS98, viz., pure luminosity evolution with all galaxy luminosities scaling as up to a redshift and no evolution for with a cutoff at .
As observations of high-redshift galaxies improved, they have tended to reinforce our earlier redshift evolution assumptions as providing a realistic description of the cosmic evolution of galaxy luminosities (Madau, Pozzetti & Dickinson 1998, Steidel, et al. 1999, Blain & Natarajan 2000; Hopkins, Connolly & Szalay 2000). More complex evolutionary histories could be imagined. However, our simple two-parameter formulation captures most of the range of significant possibilities, and the observational data are far too limited to try to constrain the values of a third possible parameter.
The “Best Estimate” galaxy evolution model used by MS98 to predict the diffuse infrared background took and . 111In generating Figure 2 of MS98, galaxies above were erroneously assumed to have the same luminosities as at . Here we more properly assume that the LF has evolution up to and no further evolution beyond that. Our corrected result and that given in MS98 are not significantly different. We have also corrected an error in the short-wavelength extrapolation of the Spinoglio et al. (1995) SEDs. As discussed in Section 2, we now use average optical colors of late-type spirals. Here we refer to this model as the “Baseline” model.
MS98 also showed a more conservative calculation, in which the luminosity evolution (with still equal to 3.1) was frozen at 1. Thus by , this conservative scenario assumes galaxy luminosities were only times more luminous than today, rather than the factor of assumed in the baseline model. In this paper, we refer to the = 1; model as the “Lower Limit” scenario.
We also consider here an alternate “Fast Evolution” scenario, in which the evolution index is increased to , while is taken to be 1.3. As for the baseline case, this scenario also implies that galaxies were forming stars at 30 times higher rates at than today. However, with fast evolution, the galaxy luminosities at were also 30 times higher, in contrast to the baseline model in which they were 8.6 times their current luminosities. Support for the Fast Evolution scenario is found in the recent NICMOS (Near Infrared Camera and Multi-Object Spectrograph) studies of Hopkins et al. (2000).
5 Diffuse Infrared Background Radiation
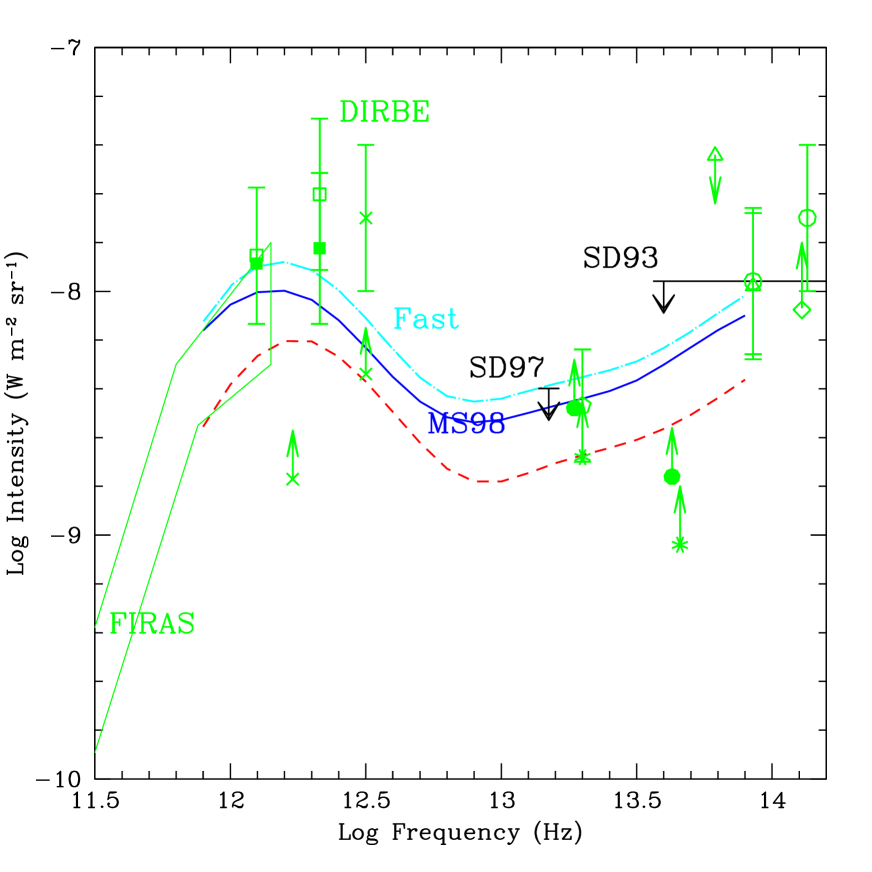
First we compare the predictions of our model with the new measurements of the CIB as shown in Figure 2. The baseline model with , = 4 and = 2, is shown by the middle solid line. The lower dashed curve is the prediction of our lower limit model with = 1. The upper (dot-dashed) curve shows our fast evolution (; = 1.3) case.
The predicted CIB is most sensitive to the exponent of the luminosity evolution, . Increasing or decreasing by 0.5 results in a CIB which increases or decreases by 25 to 30% at most wavelengths. The second most important parameter is the redshift at which the luminosity evolution stops, which was in the baseline calculation. If is dropped to 1 with Q unchanged, the CIB drops by about 25% at most wavelengths, as is evident from the lower dashed curve.
If we extend the evolution in our models to values of significantly above 2, they would predict too much flux in the FIR-sub mm range to be consistent with the FIRAS results (Fixsen et al. 1998).
Finally, the least important free parameter is the maximum redshift for which infrared emitting galaxies are included, in the baseline case. When this is decreased to 2, the CIB decreases by about 30% at most wavelengths. The combination of redshift evolution and cosmology insures that it is the galaxies at redshifts 1 which contribute most to the CIB, as discussed further below.
In our lower limit case, the redshift of maximum evolution is reduced to while is taken to be to 3.1, resulting in a CIB prediction about 70% lower than our baseline case. Our fast evolution case gives CIB fluxes which are about 30% higher than our baseline case at mid infrared and far infrared wavelengths. All of our models are consistent with the subsequent COBE detections of the cosmic background at 2.2 m and 3.5 m (Dwek and Arendt 1998; Gorjian, Wright & Chary 2000).
We note that the best constraint on the CIB at mid-infrared wavelengths comes from studies of the lack of absorption features in blazar spectra up to 10 TeV. This gives an upper limit on the 20 m flux of 4 to 5 nW m-2sr-1 (Stecker & de Jager 1997, Stanev & Franceschini 1998; Biller et al. 1998). This limit, when combined with our predicted CIB SEDs, disfavors evolution with .
The COBE-DIRBE far infrared determinations seem to favor strong evolution, at least to a redshift 1, i.e., our fast evolution case which is the upper curve in Figure 2, generated using and . This case is within 2 of the results of the Hauser et al. (1998) analysis of the COBE-DIRBE data at 140 and 240 m. When one considers that these results were themselves at the 4 level and that there still may have been some undersubtraction of foreground emission, we consider our fast evolution case to be consistent with both the COBE-DIRBE and FIRAS numbers.
We also show points at 140 and 240 m derived from the COBE-DIRBE data using the FIRAS calibration, which suffered from smaller systematic errors than the COBE-DIRBE calibration (Fixsen et al. 1997). This calibration lowers the flux numbers and brings them into better agreement with our fast-evolution and baseline model calculations.
The point at 100 m was identified by Lagache et al. (2000) as the extragalactic background flux. However, it may actually be an upper limit, since their analysis did not demonstrate isotropy (Hauser & Dwek 2001).222There was tentative detection of the CIB at 60 and 100 m by Finkbeiner, Davis & Schlegel (2000). However, this result now appears to have suffered from contamination by local dust emission (Finkbeiner 2001) and is not shown in Figure 2 for this reason.
6 Observational Appearance of a Typical Evolving Galaxy
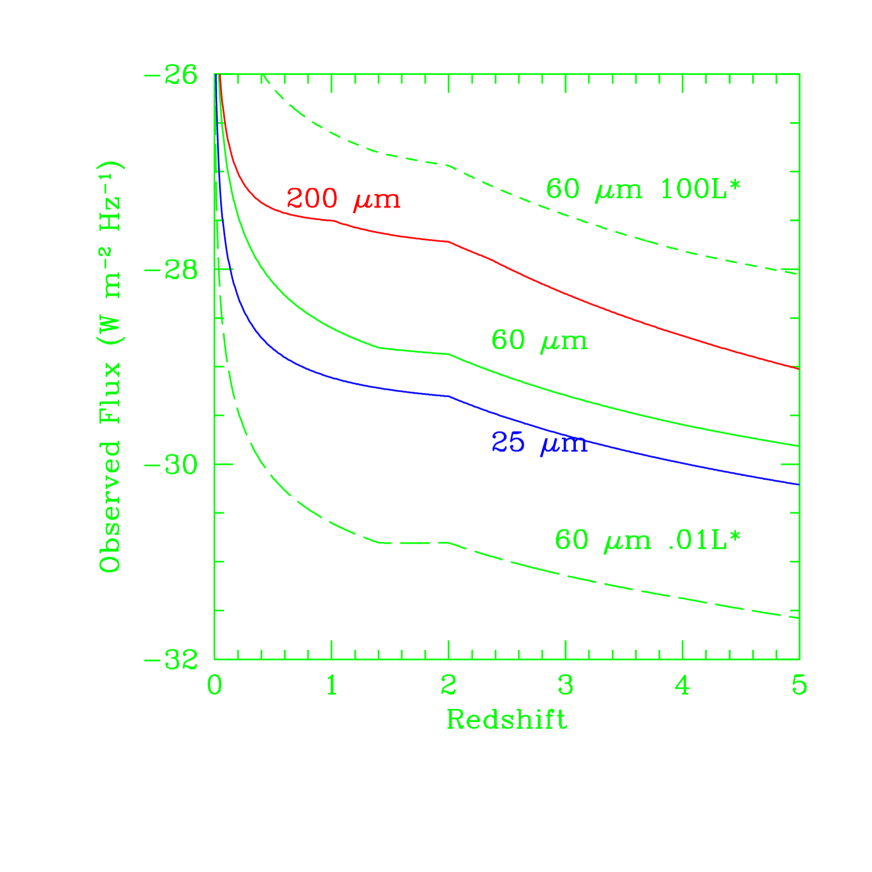
The redshift distribution can be understood by considering the brightness of a typical bright galaxy, viewed out to various redshifts. For example, let us consider a galaxy with a current 60m luminosity of at the knee in the LF. The observed flux of a galaxy whose present luminosity is , given as a function of redshift, is shown in Figure 3 for observing wavelengths of 25, 60 and 200m. Observing an galaxy at a fixed wavelength samples emission at progressively shorter rest-system wavelengths at progressively higher redshifts. For a wavelength of 200m, the peak of the far infrared spectrum of this galaxy is shifted into the observing bandpass at , resulting in a negative K-correction. This explains the relatively flat portion of the flux curve from to 1.0. At higher redshifts, luminosity evolution produces an even stronger effect, which causes all the flux curves to become relatively flat from to 2.0.
Figure 3 also shows the 60m fluxes of galaxies which are currently 100 times more or less luminous than , indicated by the short and long dashed lines respectively. At an observing wavelength of 60m, evolutionary changes in galaxy spectra make the less luminous galaxies relatively brighter at high redshifts.
7 Galaxy Number Counts
We can sum our generated family of LFs over redshift to obtain the expected number of observable sources at a given flux level and wavelength over the entire sky:
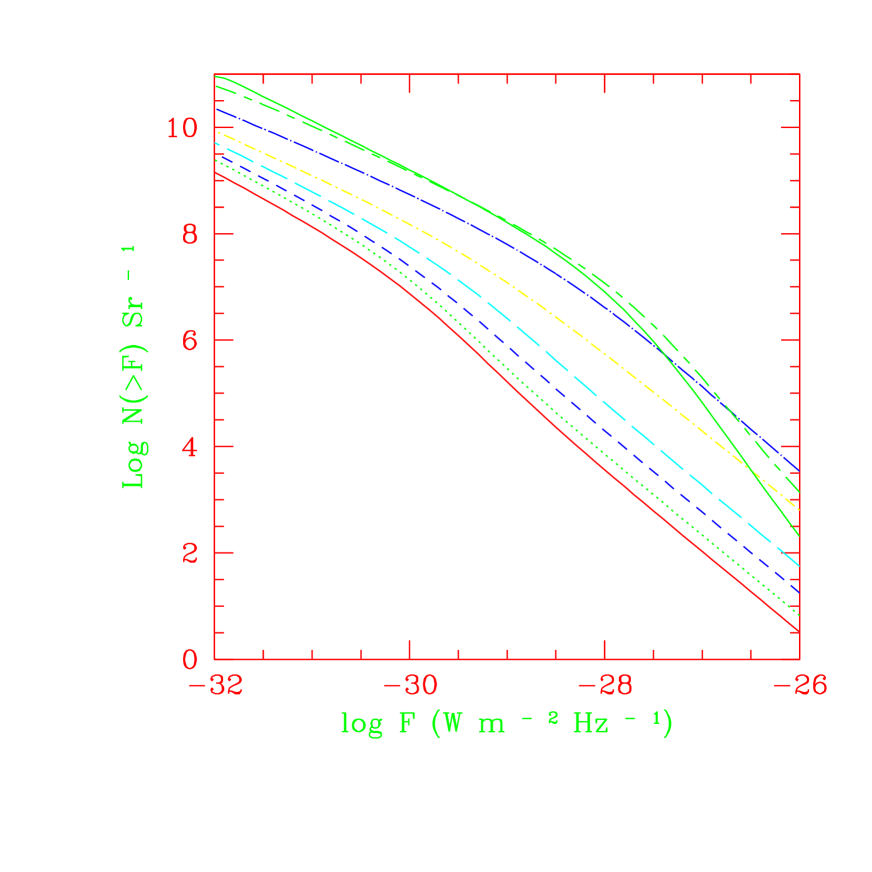
assuming and . Figure 4 shows the predicted integrated galaxy counts as a function of minimum observable flux at each of the 8 logarithmically spaced wavelengths shown in Figure 1.
7.1 Results
As expected, the slopes of the integrated counts are approximately equal to the Euclidean value (-3/2) at the brighter flux levels (above 1 mJy). The galaxy counts from 2 m to 100 m have similar slopes with a Euclidean (high-flux) normalization (in Jansky flux units) given by the formula:
reflecting the average spectral spectral energy distribution of a typical galaxy. However, the characteristic knee where the slope flattens is shifted to higher flux levels at longer wavelengths. This reflects the fact that an galaxy is more luminous at longer wavelengths, and can therefore be seen to larger distances. The 3 and 6m counts rise above the Euclidean value briefly around 0.1 mJy, owing to the positive K-corrections at those wavelengths. At fluxes fainter than 0.1 mJy, the counts at all wavelengths are flatter than the Euclidean slope, because the deviations due to cosmology dominate over galaxy evolution, which was assumed to level off at . At 50 and 100m, this cosmological flattening of the counts slope occurs at 1 to 10 mJy, the brightness of typical galaxies at redshifts greater than 1. At longer wavelengths, between 200 and 400m, on the falling side of the peak of the rest-frame energy distribution, there is hardly any flux range where the counts slope is Euclidean. The counts at the bright end, from 1 to 0.01 Jy, actually rise more steeply than the -1.5 slope, owing to the strong K-corrections for redshifts up to 1 to 2. For long-wavelength fluxes below 0.01 Jy, the counts curves flatten from the contributions of galaxies at redshifts of 2 and higher.
7.2 Comparison with Other Models
Our predicted counts at all wavelengths have a steeper slope (more faint sources) than those of Takeuchi et al. (1999), because our assumed evolution () is twice as much as theirs ( or 1.5). We are in closer agreement with Takeuchi et al. (2001), who used a stronger, but non-parametric luminosity evolution. Their “Evolution 1” scenario is similar to our baseline model at all wavelengths, while their “Evolution 2” scenario is slightly closer to our Fast evolution model. Our predicted baseline model counts agree with the (similar) “baseline model” of Pearson et al. (2001) at all wavelengths they considered (7 to 25m). At very faint flux levels around 0.1 mJy, our predictions agree with their modified model which included an ad hoc population of strongly evolving “ultraluminous infrared galaxies”. However, our count predictions at the faintest fluxes (0.001 mJy) are signinficantly above theirs, partly because of their adoption of an open geometry for the Universe. Our predicted 15, 60 and 175 m counts are close to those of Tan et al. (1999), although 10 to 40% higher, because our assumed evolution is effectively stronger up to than that of their disk galaxies (which dominate much of the counts at these wavelengths). Our counts slopes are steeper than those of model E of Guiderdoni et al. (1998). We predict two to three times more faint sources at 15m, 50% more at 60m, and only slightly more faint sources at 175m. The shape of our number count curves agrees very well with those of Xu et al. (1998), as it must, because we both used virtually identical methodology and luminosity evolution assumptions. However, the normalization of our counts is higher by about a factor of two (more at 15m, and less at 25m), because of the differences in our assumed local LF’s.
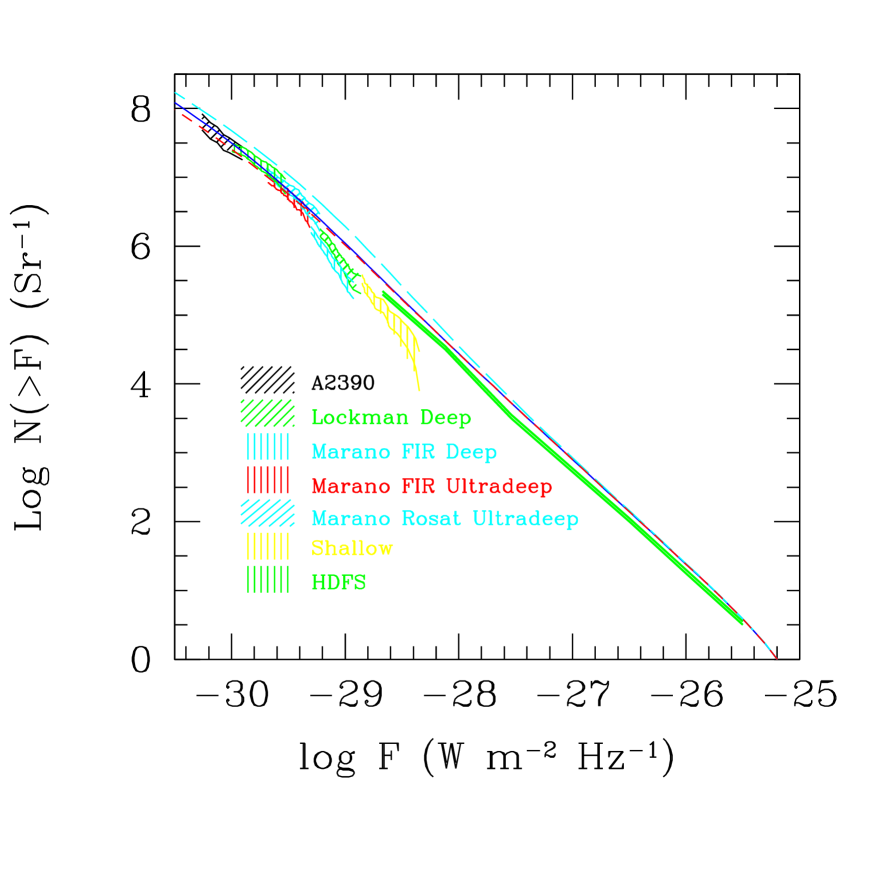
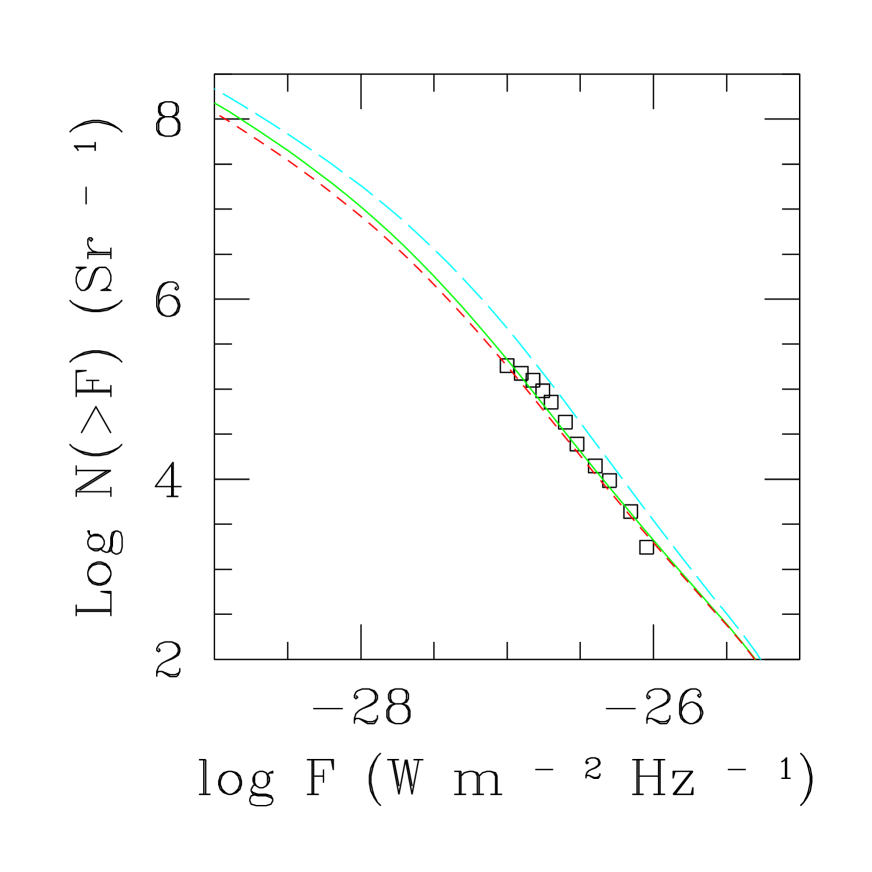
In Figures 5 and 6 we compare the predictions of our three models with observations of faint integral source counts at 15m and 175m, respectively. The 15m source count data are taken from the recent compilations by Serjeant et al. (2000) for the brighter fluxes (shown by the thick line), and Elbaz et al. (2000) for the fainter fluxes and are mostly based on various deep ISOCAM fields. The 175m counts are taken from a compilation by Dole et al. (2000) and Juvela et al. (2000), based on deep ISOPHOT imaging in the FIRBACK (Far Infrared Background) survey. The three model predictions are again shown as a solid line for the baseline case, a dashed line for the fast evolution case, and a dot-dashed line for the lower limit case. Our new description of the long-wavelength spectrum increased the predicted number counts at 175 m by about 30% over our pre-ISOPHOT estimate. This change, of course, does not effect the counts at shorter wavelengths.
The observed faint counts at both mid- and far infrared wavelengths agree with our baseline model. The only apparent discrepancy occurs around intermediate 15m fluxes, where the counts from the Marano fields fall significantly below comparable measurements from other data sets. It appears, in fact, that much of this apparent disagreement is attributable to different choices of flux calibration by the different ISOCAM teams (Elbaz et al. 2000). The predictions of the “Lower Limit” model with truncated evolution at is so similar to the baseline model that they are also close to the observations. With , changing from 2 to 1 decreases the predicted number of 0.1 mJy sources at 15m by only 20%. With , increasing from 3.1 to 4.1 results in a 30% increase in bright (1 Jy) 175m sources. However, extending evolution with up to leads to a prediction of 40 to 50% more faint sources, in apparent conflict with most of the observations. Certainly a very fast evolution case () is ruled out, as it significantly overpredicts (by 75% or more) the number of 15 and 175m sources.
Other recent studies have also used backwards-evolution models to predict faint infrared source counts. Pearson et al. (2000) and Xu et al. (2000) divided their galaxy populations into a less luminous group having mild cosmic evolution, and an ”ultraluminous” galaxy class with stronger evolution than we assumed. We have adopted the simpler assumption of a single evolution for all galaxies, since current observations are too limited to provide serious constraints on the additional free parameters that these models invoke. The Xu et al. (2000) predictions agree with our “fast evolution” case for long wavelengths, but are significantly below at 6m. At wavelengths of 15m and longer, the Xu et al. (2000) predictions rise a little more steeply than ours, due to their larger evolution index (), but then rise more slowly at the faintest fluxes due to their adoption of an open Universe geometry.
8 Predicted Redshift Distributions for Future Surveys
The range of plausible models calculated above all predict CIB spectra and galaxy number counts at wavelengths from 3 to 400 m which differ by at most a factor of 2.5. These models also differ in their predictions of the redshift distributions of faint galaxies. We now show how even limited redshift information for flux-limited galaxy samples will discriminate between these models.
Several planned deep imaging surveys of low-foreground regions of the sky should be sensitive enough to detect a significant fraction of the galaxy population at moderate and very high redshifts. In early 2003, the SIRTF “First Look Survey” should detect galaxies with fluxes of 1 mJy at 25 m and 5 mJy at 70 m with the Multiband Imaging Photometer, MIPS. SIRTF First Look Survey imaging with the Infrared Array Camera, IRAC will detect 30 Jy sources at 6 m. In the same year, a wider sky area will be surveyed at 120m by IRIS (Shibai, 2000). In Figure 7 we assume that it will detect galaxies down to 32 mJy. Several years later, surveys with the Photoconductor Array Camera and Spectrometer, PACS on the Far Infrared Space Telescope, FIRST will detect 1 mJy sources at 200 m.
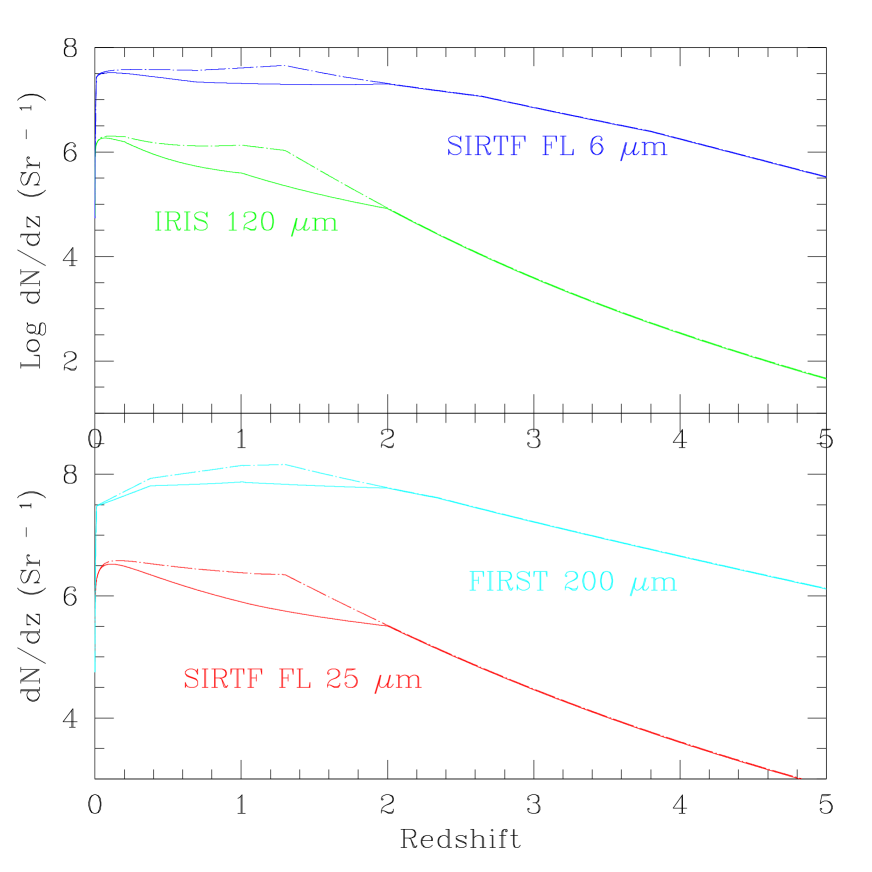
The integrand of Eq. (4) evaluated at a fixed observing wavelength down to a given flux limit gives the differential redshift distribution, . We plot this distribution in Figures 7a and 7b for sample deep observations at 6, 25, 120 and 200 m as a function of . The flux limits chosen at each wavelength are expected to be reached by planned high galactic latitude imaging surveys with new space observatories in the next several years, as discussed above. The vertical axis is absolutely normalized to one steradian of sky coverage. In Table 1, we list the actual numbers of galaxies per steradian expected with redshifts above 1 and 2 in various flux-limited surveys. The next two columns give the total number and number with for the fast evolution scenario.
The counts at a given observed flux level are dominated by the redshift at which galaxies appear. As shown in Figure 3, the 120m IRIS and 25m SIRTF. First Look surveys can both detect galaxies up to . That is why the differential redshift distributions for all galaxies detected in these two surveys are predicted to be similar, as can be seen in Figure 7. For the baseline evolution scenario, we predict that 18% of the galaxies detected by IRIS will have 1, and 2% will have 2. For the fast evolution scenario, 24% of the detected galaxies will have 1 and 1% will have 2. SOFIA is expected to have comparable long-wavelength sensitivity to IRIS using 1 hour integrations with chopping (Becklin 1997).
Assuming that the MIPS “First Look” survey will cover five square degrees, our baseline model predicts integrated counts at 25 and 70m of 3900 and 6100 galaxies, respectively. Down to those flux limits, the cosmological depths are comparable, with median redshifts of 0.48 and 0.40, respectively, and upper quintile redshifts of 1.17 and 0.9. The baseline model predicts 25% and 5% of galaxies at 25m will have 1 and 2, respectively. The fast evolution model predicts these fractions are 33% and 3%. Reaching a factor of 3 deeper at 25m increases the depth to a median redshift of 0.8 and an upper quintile redshift of 1.64.
In a five square degree First Look Survey at m with IRAC, there should be a total of 9700 galaxies detected down to 30 Jy. Of these galaxies, 59% should have redshifts greater than 1, and 20 to 28% should have redshifts greater than 2. However, the reach would not be greatly extended by much longer time integrations. Even at a limiting flux three times fainter (10 Jy), the median redshift only increases from 1.30 to 1.44 and the upper quintile redshift increases from to 2.46. This is because the First Look Survey with IRAC already reaches back to . Longer time integrations tend to detect more galaxies of lower luminosity with a similar redshift distribution.
The sensitivity of FIRST is also sufficient to detect the progenitors of modern galaxies at all redshifts out to 5 (see Figure 3). At wavelengths longward of 100m, the sensitivity to high-redshift galaxies is comparable to that expected for IRAC at 6 m, owing to the positive K-corrections. We have approximated the imaging sensitivity of the Spectral and Photometric Imaging Receiver SPIRE on FIRST as 3.2 mJy at 250 m (Griffin 1997), which might also be approached for small areas of sky by SOFIA. At this flux level, the strong positive K-correction results in a remarkably far reach for detection of distant galaxies: a median redshift of 1.62 and an upper quintile redshift of . A PACS survey to 5 mJy at 150m (Poglitsch 1997) will have a median redshift of 0.93 and an upper quintile of , with 47% of galaxies having 1 and 12% of galaxies having 2. It is gratifying to see that all of these planned surveys should detect high surface densities of galaxies at these redshifts.
The predicted confusion noise limits for the beamsizes of each of these instruments are also included in Table 1. These are very optimistically set to the flux levels at which there is an average of one source per beam. In reality, confusion becomes a problem when there is one source per 10 to 20 beams, so that the real confusion limits should probably be several times larger than the numbers quoted in the Table. The predictions are for the baseline evolution; the confusion limit fluxes are slightly larger in the fast evolution scenario. All of the planned surveys will be comfortably above the confusion limit except SPIRE 250m imaging, which is close to the confusion-limit, and IRIS 120 and 150m and MIPS 160m imaging, which will be dominated by confusion noise.
9 Conclusions
We have used our empirically based model (MS98) to predict infrared luminosity functions and deep infrared galaxy counts at various wavelengths. We have also examined our predictions for the CIB for comparison with the subsequent determinations from the COBE-DIRBE data analysis. Using the formalism of luminosity evolution proportional to out to a redshift of and constant (no further evolution) for , we find that a comparison of their predictions with current ISO galaxy counts at 15 and 175m favor our “Baseline Model” with and (the middle curve in Figure 2). The -ray limits (SD97) also favor , as does a comparison of our predicted CIB with the analysis of the HEGRA observations of high-energy -ray spectrum of Mrk 501 by Konopelko, Kirk, Stecker & Mastichidas (1999). On the other hand, the COBE-DIRBE far infrared determinations seem to favor a stronger evolution with up to . For example, the upper curve in Figure 2 assumes and .
This prima facie conflict can be resolved in two ways: either (a) the ISOPHOT galaxy counts may be missing a significant fraction of sources. In this case, one may also have to require that the -ray results are wrong in that the energies of photons detected by HEGRA have been overestimated, mimicing the effect which would be caused by absorption from a lower CIB333Another possibility is one involving new physics, viz. that Lorentz invariance may be broken, allowing the Universe to be transparent to multi-TeV photons (Coleman & Glashow 1999; Kifune 1999; Glashow & Stecker 2001; Stecker 2001). This “new physics”scenario presents problems in that the Mrk 501 spectrum does exhibit exactly the characteristics expected for high-energy -ray absorption from pair-production (Konopelko et al. 1999)., or (b) the COBE-DIRBE far-infrared estimates may suffer from undersubtraction of foreground emission and therefore are too high.
If the far-infrared galaxy counts are incomplete (possibility (a)), this would imply stronger evolution in the far-infrared emission of galaxies than in the mid-infrared. Although the MS98 model already includes some differential evolution of this type, based on the data of Spinoglio et al. (1995), it is conceivable that starburst galaxies at redshifts might produce an even higher ratio of m to m rest-frame fluxes than their present-day counterparts. Radiation at these widely separated wavelengths is known to be emitted by quite different dust grains which could have a different evolutionary development, particularly for ULIRGs (ultraluminous infrared galaxies) and AGN (active galactic nuclei). One should note that this possibility can make the -ray and infrared data compatible, since absorption of 15 TeV -rays is caused by interactions with mid-infrared ( 20m) photons and not 140m far-infrared photons.
Possibility (b) finds support in the independent analysis of the COBE data by Lagache et al. (1999) who obtain a flux at 140 m which is only 60% of the flux obtained by Hauser et al. (1998) shown in Figure 1. Lagache et al. (2000) also obtained a smaller flux at 240 m. In this regard, one should also note that the detections claimed by Hauser et al. (1998) were at the 4 level. Also, it is important to note that both our baseline model and our fast evolution model are within 2 of the COBE-DIRBE results obtained by adopting the FIRAS calibrations of Fixsen, et al. (1997). In this case, there would be no inconsistency with a evolution being acceptable to explain the source counts, the CIB and the -ray mid-infrared upper limits.
We have shown here that planned infrared imaging surveys will soon be able to measure galaxy evolution out to redshifts of 2 or greater and help to resolve the question discussed above. This can be done with our simple modelling technique in conjunction with observations of luminosity functions, galaxy counts, and the diffuse infrared background.
A complete listing of the model count predictions at each wavelength can be obtained from the internet site www.astro.ucla.edu/faculty/malkan.html.
We would like to thank Michael Hauser, Ned Wright and Cong Xu for helpful discussions. We also thank an anonymous referee for helpful and constructive criticisms.
References
- (1) Altieri, B. et al. 1999, A & A 343, L65
- (2) Becklin, E.E. 1997, Proceedings of ESA Symposium on “The Far-Infrared and Submillimeter Universe”, pg. 201
- (3) Biller, S.D. et al. 1998, Phys. Rev. Lett. 80, 2992
- (4) Blain, A.W. & Natarajan, P. 2000, MNRAS, 312, L39
- (5) Coleman, S. & Glashow, S.L. 1999, Phys. Rev. D59, 116008
- (6) Dole, H et al. 2000, astro-ph/0002283
- (7) Dwek, E. & Arendt, R. 1998, ApJ 508, L9
- (8) Elbaz, D. et al. 2000, A & A Lett., in press, e-print astro-ph/9910496
- (9) Fang, F., Shupe, D.L., Xu, C. & Hacking, P.B. 1998, ApJ 500, 693
- (10) Finkbeiner, D.P., Davis, M. & Schlegel, D.J. 2000, ApJ 544, 81
- (11) Finkbeiner, D.P. 2001, in The Extragalactic Background and its Cosmological Implications, IAU Symp. Vol. 204, ed. M. Harwit & M.G. Hauser, in press.
- (12) Fixsen, D.J. et al. 1997, ApJ 490, 482
- (13) Fixsen, D.J. et al. 1998, ApJ 508, 123
- (14) Franceschini, A., et al. 1998, MNRAS 296, 709
- (15) Gispert, R, Lagache, G. and Puget, J. 2000, A & A, 360, 1
- (16) Glashow, S.L. & Stecker, F.W. 2001, in preparation
- (17) Gorjian, V., Wright, E.L. & Chary, R.R. 2000, ApJ, 536, 550
- (18) Griffin, M. J. 1997, presentation at Grenoble meeting April 1997, http://astro.estec.esa.nl/First
- (19) Guiderdoni, B., Hivon, E., Bouchet, F. & Maffei, B. 1998, MNRAS 295, 877
- (20) Hauser, M., et al. 1998, ApJ 508, 25
- (21) Hauser, M. & Dwek, E. 2001, Ann. Rev. Astron. Ap., in press
- (22) Hopkins, A.M., Connelly, A.J. & Szalay, A.S. 2000, AJ, in press, e-print astro-ph/0009073
- (23) Juvela, M., Mattila, K. and Lemke, D. 2000, A & A 360, 813
- (24) Kifune, T. 1999, ApJ 518, L21
- (25) Konopelko, A.K., Kirk, J.G. Stecker, F.W. & Mastichiadas, A. 1999, ApJ 518, L13
- (26) Lagache, G., Haffner, L.M., Reynolds, R.J. & Tufte, S.L. 2000, A & A 354, 247
- (27) Lawrence, A. et al. 1986, MNRAS 219, 687
- (28) Madau, P., Pozzetti, L. & Dickinson, M. 1998, ApJ 498, 106
- (29) Malkan, M.A., 1998 in Astrophysics with Infrared Arrays: A Prelude to SIRTF, Astron. Soc. Pacific, Conf. Series, in press, e-print astro-ph/9810055
- (30) Malkan, M.A., 2000, in Our Second Look at the Immature Universe: The Infrared View, Proc. Fourth RESCEU International Symposium, (Tokyo: Universal Academy Press) in press, e-print, astro-ph/0005251
- (31) Malkan, M.A. & Stecker, F.W. 1998, ApJ 496, 13 (MS98)
- (32) Pearson, C.P. et al. 2001, astro-ph/0008472v3, submitted to MNRAS
- (33) Poglitsch, A. 1997, presentation at Grenoble meeting April 1997, http://astro.estec.esa.nl/First
- (34) Pozzetti, L. & Madau, P. 2001, in The Extragalactic Background and its Cosmological Implications, IAU Symp. Vol. 204, ed. M. Harwit and M.G. Hauser, in press, astro-ph/0011359
- (35) Puget, J.L. et al. 1999, A & A 354, 29
- (36) Rush, B., Malkan, M.A. & Spinoglio, L. 1993, ApJS 89, 1
- (37) Saunders, W., et al. 1990, MNRAS 242, 318
- (38) Serjeant, S. et al. 2000, MNRAS, 316, 768
- (39) Shibai, H. 2000, Adv Space Res, 25, 2273
- (40) Shupe, D., Fang, F., Hacking, P.B.& Huchra, J.P. 1998, ApJ 501, 597
- (41) Soifer, B.T., et al. 1987, ApJ 320, 238
- (42) Soifer, B.T. and Neugebauer, G. 1991, AJ, 101, 354
- (43) Spinoglio, L., et al. 1995, ApJ 453, 616
- (44) Spinoglio, L., et al. 2001, in preparation
- (45) Stanev, T. & Franceschini, A. 1998, ApJ 494, 159
- (46) Stecker, F.W. 2001, in The Extragalactic Background and its Cosmological Implications, IAU Symp. Vol. 204, ed. M. Harwit and M.G. Hauser, in press, e-print astro-ph/0010015
- (47) Stecker, F.W. & De Jager, O.C. 1993, ApJ 415, L71
- (48) Stecker, F.W. & De Jager, O.C. 1997, in Towards a Major Atmospheric Cerenkov Detector V, Proc. Kruger National Park Workshop on TeV Gamma Ray Astrophysics, ed. O.C. De Jager (Potchefstroom: Wesprint) pg. 39
- (49) Steidel, C.C. et al. 1999, ApJ 519, 1
- (50) Takeuchi, T.T. et al. 1999, PASP 111, 288
- (51) Takeuchi, T.T. et al. 2001, astro-ph/0009460, Pub. Astron. Soc. Japan, in press
- (52) Tan, C., Silk, J. and Balland, C. 2000, ApJ 522, 579
- (53) Totani, T. et al. 2001, in The Extragalactic Background and its Cosmological Implications, IAU Symp. Vol. 204, ed. M. Harwit and M.G. Hauser, in press
- (54) Xu, C. et al. 1998, ApJ 508, 576
- (55) Xu, C. et al. 2001, astro-ph/0009220, ApJ, in press
| Table 1: Predicted Galaxy Counts With Future Instruments | |||||
| Instrument (m)) | N(Tot)b | N() | N() | Conf.Noisec | |
| MIPS/SIRTF (25) | 1.0 | 2.55(6) | 6.3(5) | 1.3(5) | 3.2 |
| ” ” | ” | 4.57(6)d | 1.5(5) | … | |
| MIPS/SIRTF (25) | 0.32 | 1.34(7) | 5.5(6) | 1.5(6) | … |
| MIPS/SIRTF (70) | 5.0 | 3.99(6) | 6.7(5) | 1.1(5) | 130 |
| IRAC/SIRTF (6) | .032 | 6.35(7) | 3.8(7) | 1.8(7) | 0.1 |
| ” ” | ” | 8.86(7) | 5.2(7) | … | |
| IRAC/SIRTF (6) | .01 | 2.37(8) | 1.5(8) | 7.7(7) | … |
| FIS/IRIS (120) | 32 | 1.13(6) | 2.1(5) | 2.6(4) | 21000 |
| ” ” | ” | 2.17(6) | 7.5(5) | … | |
| FIS/IRIS (150) | 50 | 7.38(5) | 2.0(5) | 3.0(4) | … |
| PACS/First (100) | 5.0 | 9.94(6) | 2.8(6) | 4.8(5) | 40 |
| PACS/First (150) | 5.0 | 2.16(7) | 1.0(7) | 2.5(6) | 400 |
| SPIRE/First (250) | 3.2 | 5.45(7) | 4.2(7) | 1.8(7) | 1100 |
(a) Expected limiting fluxes are for 5-detections, in units of mJy.
(b) Counts are given in scientific notation, with the exponent of 10 given in parentheses.
(c) Confusion Limits, given in Jy, at which there is an average of one source per beam (FWHM).
(d) The second line for each survey shows the galaxy number count preditions for the Fast Evolution scenario. At redshifts above , there is no difference from the baseline model.