X-Ray Measurements of the Field and Particle Energy Distributions
in the West Lobe of the Radio Galaxy NGC 1316 (Fornax A)
Abstract
A follow-up X-ray study was made of the west lobe of the radio galaxy Fornax A, (NGC 1316) based on new ASCA observations made in 1997 for 98 ks, and incorporating the previous observation in 1994 for 39 ks. The 0.7–10 keV spectrum of the emission can be described by a power-law of energy index , which agrees with the synchrotron radio index of . Therefore, the X-rays are reconfirmed to arise via inverse-Compton scattering of the cosmic microwave photons, as Kaneda et al. (1995) and Feigelson et al. (1995) concluded. The surface brightness of the inverse-Compton X-rays exhibits a relatively flat distribution over the west lobe, indicative of an approximately spherical emissivity distribution with a radius of (75 kpc). In contrast, the 1.4 GHz radio image by Ekers et al. (1983) exhibits a rim-brightened surface brightness, consistent with a shell-like emissivity distribution whose inner and outer boundaries are and , respectively. These morphological differences between radio and X-rays suggest that the relativistic electrons are distributed homogeneously over the lobe volume, whereas the magnetic field is amplified toward the lobe rim region.
1 Introduction
The jet terminal lobes of radio galaxies are gigantic inter-galactic structures consisting of magnetic fields and relativistic particles, both of which are supposed to be supplied by the active galactic nuclei (AGNs) through the jets. Nevertheless, we do not yet know the relative importance of the magnetic fields and the relativistic particles in the mechanism of jet formation. To answer the issue, we need to measure spatial distributions of the field and particle energy densities along various locations of the AGN-jet-lobe system.
The relativistic electrons in the radio lobes interact with the magnetic fields and soft photons to produce synchrotron radiation and inverse-Compton (IC) emission, respectively. Feigelson et al. (1995, hereafter FEA95) and Kaneda et al. (1995, KEA95) discovered the IC X-ray emission with ROSAT (Trümper 1983) and ASCA (Tanaka et al. 1994), respectively, from the lobes of the radio galaxy Fornax A (NGC 1316, redshift ; Longhetti et al. 1998), followed by authors reporting the lobe IC X-rays from Centaurus B (PKS 1343601; Tashiro et al. 1998), 3C 219 (Brunetti et al. 1999) and NGC 612 (Tashiro et al. 2000). These authors estimated the energy density of soft photons, and succeeded in determining the magnetic field intensity and the energy densities of electrons in the lobes. Among these pioneering results, Tashiro et al. (1998) and Brunetti et al. (1999), respectively, showed that the lobes of Centaurus B and 3C 219 exhibit clear dominance of particle energy, in their inner regions. Notably, Tashiro et al. (1998) found relative enhancements of the magnetic fields towards the periphery in the Centaurus B lobes.
Our next task is to resolve spatial distributions of the IC X-ray emission to trace the dynamics of the jet-lobe system. The lobes of Centaurus B, however, are not in fact the best target for this investigation with ASCA, because of the bright nucleus and the relatively small angular separation of its lobes. In this paper, we present results from ASCA follow up observations of the west lobe of Fornax A. This prototypical IC source is ideal for our purpose, because of its nearly dormant nucleus (Iyomoto et al. 1998), the large ( in radius) angular size of its lobes, and the high integrated IC flux.
2 Observation
In the first ASCA observation of Fornax A carried out on January 11, 1994, KEA95 placed the nucleus at the center of the field of view (fov). This was less efficient to observe the lobes because of the vignetting effect of the X-Ray Telescope (XRT: Serlemitsos et al. 1993), and, furthermore, some portion of the lobes fell outside the fov. Aiming at the detail study of the lobe, we conducted follow up observations of Fornax A by placing the west lobe, which is less contaminated by point sources (FEA95; KEA95; see also Kim et al. 1999) than the other, in the center of the Gas Imaging Spectrometer (GIS: Ohashi et al. 1996; Makishima et al. 1996) fov. We concentrate on the GIS data, since a fair amount of the lobe emission remained outside the fov of the Solid-state Imaging Spectrometer (SIS: Burke et al. 1991; Yamashita et al. 1997) at the 2-CCD mode. The observations were carried out on August 17–18 and December 26 – 27, 1997. The good time exposure after standard data screening is 35 ks and 62 ks, for the August and December observations, respectively. Including the observation in 1994, the total exposure time amounts to 137 ks, which is more than four times as long as that obtained by KEA95.
3 Retults
3.1 Imaging analysis
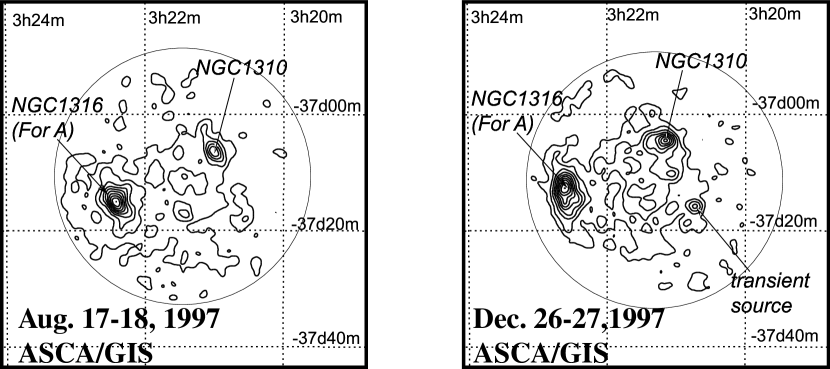
In Figure 1, we show 0.7 – 10 keV GIS images obtained in the two observations in 1997. We smoothed the raw images with a 2-dimensional gaussian function of , but left cosmic and intrinsic backgrounds in these images (Fig.1). Both two images show the diffuse IC emission over the west lobe region, as first revealed by FEA95 and KEA95. The brightest and the second brightest discrete sources are, respectively, the host galaxy NGC 1316 and the SB galaxy NGC 1310. Besides a new transient source appeared on the second occasion to the southwest of the lobe, we see no significant variation of the sources in the fov. We therefore co-add the GIS (GIS2+GIS3) data from the present observations with those from the first one made in 1994 in order to study the IC X-ray emission with the best signal-to-noise ratio. For that purpose, we subtracted the intrinsic non-X-ray background (NXB) utilizing night earth exposures close in time to each observation, corrected the image (containing the cosmic X-ray background, CXB, and the sources) for the exposure and vignetting effect, and smoothed it with a 2-dimensional gaussian function of .
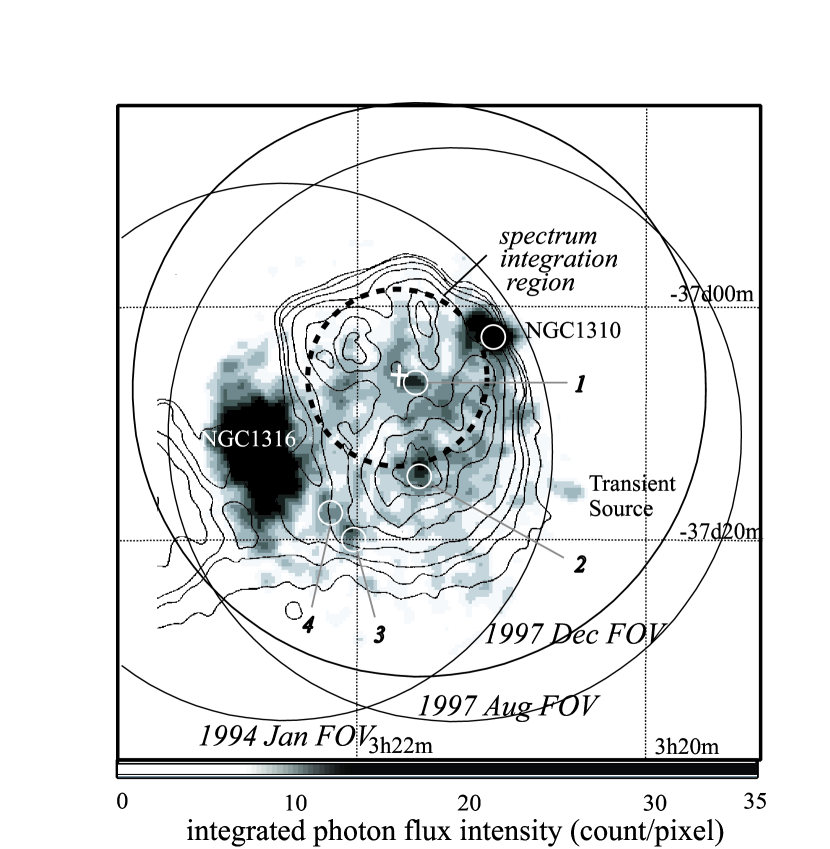
The synthesized X-ray map is shown in Figure 2 with gray scales, where the 1.4 GHz radio contours by Ekers et al. (1983) are overlaid. We detected four additional point-like source candidates (labeled 1 – 4) with a threshold of 4 deviation above the average flux over the lobe region. Apart from these small-scale features, we see the diffuse IC emission exhibiting a good coincidence with the radio lobe. We analyzed the ROSAT-PSPC (Pfeffermann et al. 1986) archival data of these regions, and found that all the sources but the transient source were identified with the ROSAT data as point sources. The extrapolated 2 – 10 keV flux is higher than W m-2 from their spectrum fitting results, and the derived energy indices range 1.5 – 3.2. These soft X-ray spectra imply that the discrete sources do not originate from the possible local enhancements of the diffuse IC emission. We examined ASCA data for NGC 1310 and source 1 – 4, and confirmed their intensities stayed constant within errors among these observations with ASCA and ROSAT. Although the sources 1 and 2 are included in the region employed by KEA95 for their spectrum analysis, the sum flux of these sources is not more than 1/10 of the flux reported by KEA95. The sources little affect their conclusion, assuming them to be stable.
3.2 Spectrum of the diffuse emission
We accumulate the GIS events over a circular region (dashed circle in Fig. 2) around the X-ray brightness peak (marked with a cross in Fig. 2). We limited the area within to avoid source contamination from the host galaxy NGC 1310 and source 2, although the source 1 is inevitably contained in the integration region. Since there is essentially no source-free region in the on-source fov, we estimated the background (NXB + CXB) utilizing archival blank-sky observations accumulated for 1653 ks. Furthermore, we decomposed the background spectrum into the NXB and CXB components referring to the night earth data, and rescaled the NXB normalization to take into account the secular change in the NXB, by comparing the night earth spectrum between the epoch of the on-source observation (in 1994 or 1997) and that of the blank-sky archival data (mostly obtained in 1993). We thus generated an appropriate background spectrum (CXB plus rescaled NXB) for each on-source observation, and subtracted it from the raw spectrum of each GIS instrument. Then we summed the GIS spectra from the observations into a single one.
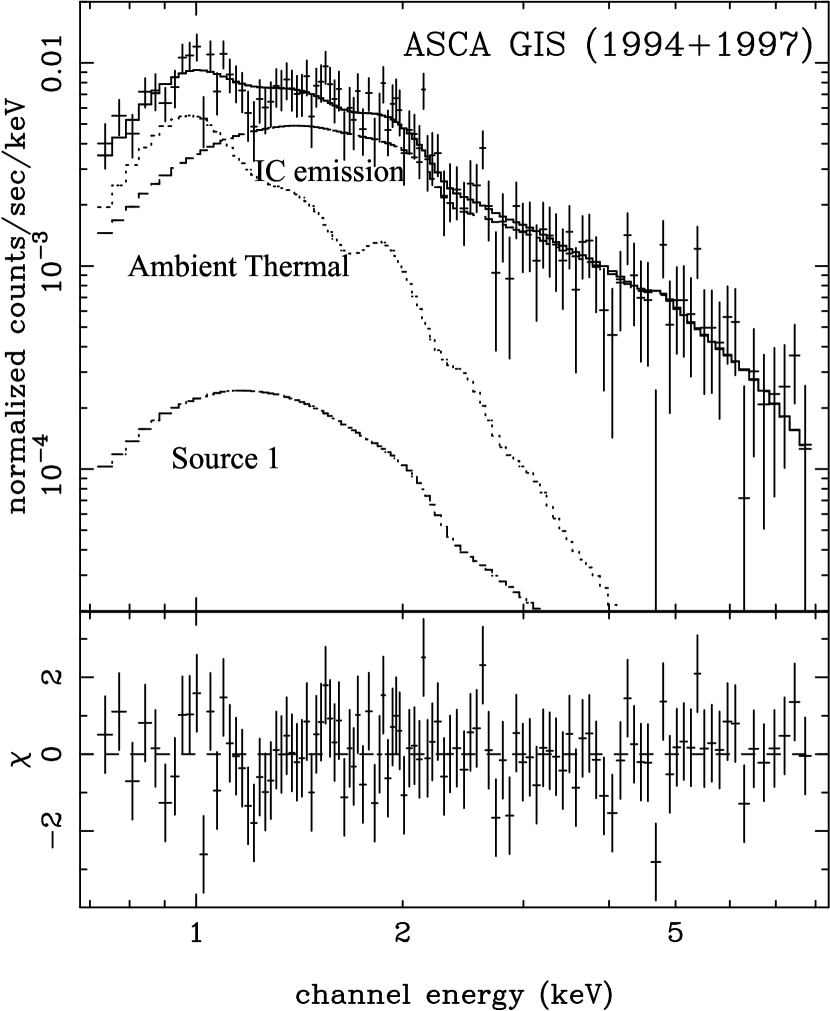
In Figure 3, we show the obtained background subtracted GIS2 + GIS3 spectrum of the west lobe region. It is relatively hard and significantly detected up to keV, implying a considerable improvement over results in KEA95. We fitted the spectrum with a model consisting of three components; (1) a power-law with free energy index and free normalization, representing the IC emission; (2) a thin-thermal emission (Raymond & Smith 1977) with free temperature and free normalization, but with the metallicity fixed at 0.4 solar abundance, which represents the soft thermal emission surrounding the radio galaxy as detected by KEA95; and (3) the contaminating source 1. We analyzed the ROSAT-PSPC spectrum of source 1, and found that it can be described with a power-law of energy index and flux density Jy [W m-2Hz-1] at 1 keV, absorbed by a column density of H atoms m-2 with . In the fit to the GIS data, we constrained the component (3) to take these best-fit ROSAT parameters. We calculated the ASCA response function for the three observations individually, and then took their weighted average. This three component model has successfully described the spectrum with d.o.f. . The best-fit parameters are shown in Table 1. The 2 – 10 keV flux obtained from the lobe region is W m-2, which is consistent with that evaluated by KEA95. The derived energy index of the IC component () agrees with that obtained by KEA95 (), and the accuracy is much improved.
A similar good fit was obtained by replacing the power-law component (1) with a second thin thermal plasma emission model, of temperature keV, emission measure of m-3, and abundance fixed at 0.4 solar.
3.3 X-ray brightness distribution
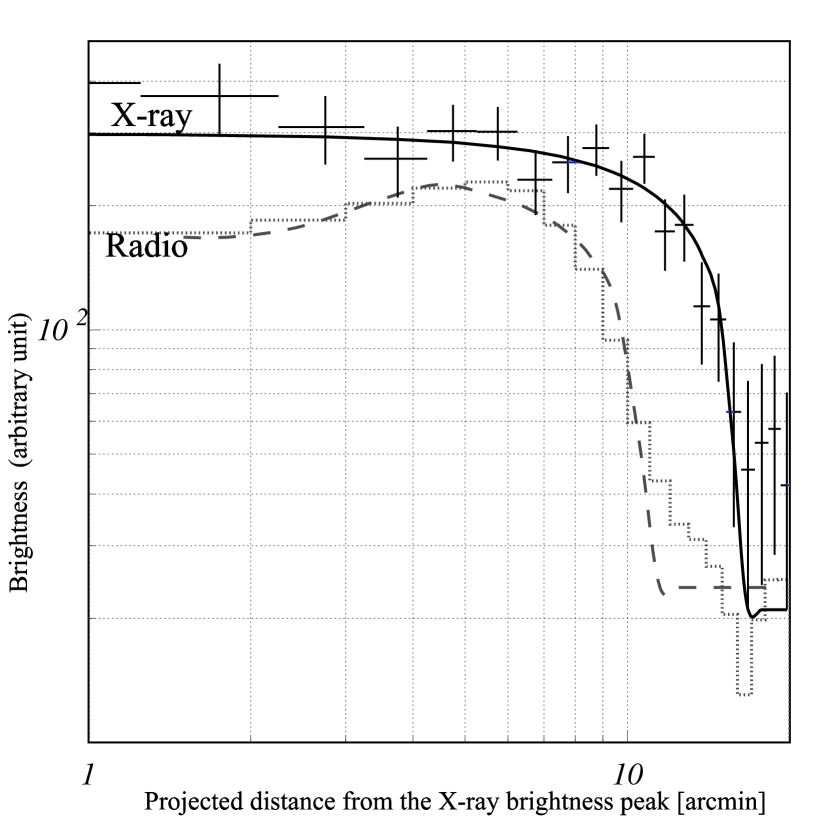
We saw in Figure 2 that the IC X-ray emission is relatively concentrated on the center of the lobe. To quantify the surface brightness distributions, we masked the contaminant discrete sources (§ 3.1) and made a 1.0 – 10 keV radial brightness profile around the X-ray brightness peak (the cross in Fig. 2). The X-ray surface brightness distribution is so flat within a few arcmin that the radial profile is little sensitive to the position of the center (Fig. 2). To compare with the X-ray radial profile around the same center, we made a radial brightness profile in radio utilizing the 1.4 GHz image by Ekers et al. (1983), and show them in Figure 4. Thus, the two profiles resemble each other, but differ in two points; the rim-brightened feature seen in the radio profile is absent in X-rays, and the X-ray distribution appears to have a larger radius than the radio distribution.
To examine possible instrument artifacts, we simulated an expected X-ray image with the XRT and GIS response simulator to fit the observed radial brightness profile. The position resolution and vignetting effect of were calculated based on calibration data from Cygnus X-1 (Ikebe 1995; Takahashi et al. 1995). We assume isotropic distribution of the emissivity through the simulation. This analysis revealed that a homogeneously filled spherical emissivity model with the outer boundary of reproduces the observed X-ray radial profile very well (the solid line in the Fig. 5).
On the other hand, a shell-shaped emissivity model reproduced the rim brightened radio profile very well, as represented with a dashed line in Figure 4. The outer boundary of the shell is constrained to be , while the inner boundary . The shell-shaped model, however, could not describe the obtained X-ray profile with a finite inner boundary. Therefore, unlike the case of X-ray emissivity, the radio profile requires a reduced emissivity at the lobe center, although we see no significant discrepancy between the derived outer boundaries of the X-ray and radio profiles. Since the radio data provided better accuracy, we regard the value of derived from radio data as the common outer boundary of radio and X-rays in discussion below.
4 Discussion
We measured the diffuse X-rays of the Fornax A west lobe with an improved accuracy employing the ASCA follow up observations. The diffuse emission spatially coincides with the radio synchrotron lobe on a large scale. The derived 0.7–10 keV spectrum of the lobe X-rays is well described with a power-law model, whose energy index of agrees with the synchrotron radio emission energy index, , derived from published radio fluxes observed at 408 MHz, 1.4 GHz, and 2.7 GHz (Cameron 1971; Ekers et al. 1983; Shimmins 1971, respectively). Although the obtained spectrum formally accepts a thin thermal plasma model, the high temperature ( keV) will allow neither gravitational confinement nor cooling flow to explain the emission. The derived emission measure requires a thermal pressure of J m-3. If we assume a magnetic field of nT to confine the possible thermal plasma, that field will reduce the synchrotron cooling time down to yr (Iyomoto et al. 1998). This is too short for the relativistic electrons to diffuse in the whole lobes, considering the estimated growth speeds of lobes (Scheuer 1995). Therefore, we reconfirm, with a higher accuracy, that the diffuse X-ray emission is produced via the IC process in which the cosmic microwave background (CMB) photons are boosted by the synchrotron electrons, as FEA95 and KEA95 concluded.
With the follow up observations pointing on the west lobe, we examined the brightness distribution of the IC X-ray emission, and revealed that it indicates a center-filled emissivity distribution in contrast to the rim-brightening radio shape. This indicates that the relativistic electrons homogeneously in the sphere of radius kpc , where is the Hubble constant normalized to . We therefore regard the rim brightened radio emission as a direct indicator of the magnetic pressure distribution, represented with a shell of inner and outer boundaries of kpc and kpc , respectively. On the basis of the spectral and spatial analysis, we evaluate the energy densities of magnetic field () and electrons () according to Harris and Grindlay (1979). Since is determined by the ratio of the synchrotron radio flux to the IC X-ray flux emitted from the same volume, is in inverse proportion to the volume ratio of the shell to the electron filled sphere, which is . We estimate the 1.4 GHz flux falling inside the X-ray integration region as 50 Jy (W s-1m-2), based on the radio map by Ekers et al. (1983). We then calculate after Harris and Grindlay (1979), considering the filling factor () to the shell region, and assuming the magnetic fields to have random directions to the line of sight. The result is J m-3.
The derived corresponds to the magnetic field strength of nT at . Note here we adopted an IC scattering electron density, at Lorentz factor , estimated through extrapolation from the observed synchrotron spectrum at – 13000. Utilizing equation (10) of Harris and Grindlay (1979), we also derive in the sphere. We assume that the electron Lorentz factor ranges in calculation below, as KEA95 adopted. Thus we obtained from the estimated IC X-ray flux (Table 1) as J m-3. Although the derived is nominally larger than the by a factor of 2.3 in the shell, we cannot immediately reject electon-magnetic field equipartition () there, without determining the electron energy spectrum below . If the spectrum turns down just below , the estimated . On the contrary, assuming that the spectrum extends down to ( MHz in synchrotron emission), the integrated becomes equivalent to in the shell region.
The results obtained here suggest a picture that the lobe interior is dominated by the particle pressure, whereas the magnetic field pressure becomes significant in the shell region defined by the lobe boundary. Interestingly, we see a similar situation in the lobes of Centaurus B (PKS 1343601), as Tashiro et al. (1998) showed. The similarity is thought to reflect energetics and evolutions of radio lobes (e.g. Blundell & Rawlings 2000) and the inter-galactic environments of particle and magnetic fields. Further investigation with recent advanced X-ray observatories are expected.
| component | bbPhotoelectric absorption column density in the unit of H atoms m-2. | energy index | [keV] | ccFlux density at 1 keV in the unit of 1 Jy = W m-2Hz-1. |
|---|---|---|---|---|
| source 1 | (8.0)ddFixed at the best-fit values of the ROSAT-PSPC data. | (3.2)ddFixed at the best-fit values of the ROSAT-PSPC data. | — | (0.008)ddFixed at the best-fit values of the ROSAT-PSPC data. |
| IC emission | (2.06)eeFixed at the Galactic line-of-sight value. | — | ||
| ambient thermal | (2.06)eeFixed at the Galactic line-of-sight value. | — |
References
- (1) Blundell, K. M., & Rawlings, S. 2000, AJ, 199, 1111
- (2) Brunetti, G., Comastri, A., Setti, G., & Feretti, L. 1999, A&A, 342, 57
- (3) Burke, B. E., Mountain, R. W., Harrison, D. C., Bautz, M. W., Doty, J. P., Ricker, G. R., & Daniels, P. J. 1991, IEEE Trans., ED-38, 1069
- (4) Cameron, M. J. 1971, MNRAS, 152, 439
- (5) Ekers, R. D., Goss, W. M., Wellington, K. J., Bosma, A., Smith, R. M.,Schwaizer, F. 1983, A&A, 127, 361
- (6) Feigelson, E. D., Laurent-Muehleisen, S. A., Kollgaard, R. I., & Fomalont, E. B. 1995, ApJ, 449, L149
- (7) Fomalont, E.B., Ebneter, K.A., van Breugel, W.J., Ekers R.D. 1989, ApJ, 346, L17
- (8) Harris, D. E., & Grindlay, J. E. 1979, MNRAS, 188, 25
- (9) Ikebe, Y. 1995, Ph. D. thesis, University of Tokyo
- (10) Iyomoto, N., Makishima, K., Tashiro, M., Inoue, S., Kaneda, H., Matsumoto, Y., & Mizuno, T. 1998, ApJ, 503, L31
- (11) Kaneda, H., et al. 1995, ApJ, 453, L13 (KEA95)
- (12) Kim, D. -W., Fabbiano, G., & Mackie, G. 1998, ApJ, 497, 699
- (13) Longhetti, M., Rampazzo, R., Bressom, A., & Chiosi, C. 1998, A&AS, 130, 267L
- (14) Makishima, K., et al. 1996, PASJ, 48, 171
- (15) Miller, N. A., Owen F. N., Burns, J. O., Ledlow, M. J., & Voges, W. 1999, AJ, 118, 1988
- (16) Ohashi, T., et al. 1996, PASJ, 48, 157
- (17) Pfeffermann, E., & Bruel, U. G. 1986, SPIE, 733, 519
- (18) Raymond, J. C., & Smith, B. W. 1977, ApJ Suppl., 35, 419
- (19) Scheuer, P. A. G. 1995, MNRAS, 277, 331
- (20) Serlemitsos, P., Loewenstein, M., Mushotzky, R. F., Marshall, F. E., & Petre, R. 1993, ApJ, 413, 518
- (21) Shimmins, A. J. 1971, Australian J. Phys. Astrophys. Suppl., 21, 1
- (22) Tanaka, Y., Inoue, H., & Holt, S. S. 1994, PASJ, 46, L37
- (23) Takahashi, T., et al. 1995, ASCA News, 3, 34
- (24) Tashiro, M., et al. 1998, ApJ, 499, 713
- (25) Tashiro, M., Makishima, K.,& Kaneda, H. 2000, Adv. Space Res., 25, 751
- (26) Trümper, J. 1983, Adv. Space Res., 2, 241
- (27) Yamashita, A. et al., 1997, IEEE Trans. Nucl. Sci., 44, 847