J.H. Fan
Optical observations of BL Lacertae from 1997 to 1999
Abstract
We present the optical (V, R, and I) photometry for BL Lacertae, which was observed from 1997 through 1999, with the 1.56-m telescope at the Shanghai astronomical observatory (SHAO). After the 1997 outburst, it dimmed to a low state and then brightened again. During the period JD 2450701 to JD 2450701.5, variations of 0.40mag, 0.27mag, and 0.21mag over a time scale of 100 minutes were found for V, R, and I bands, suggesting that the variations were decreasing with wavelength. The correlation between V, R, and I is also analyzed using the DCF (Discrete Correlation Function) method. This shows that the variability in the V, R, and I bands are correlated with no time delay longer than 0.2 day.
keywords:
Galacxies: active; BL Lacertae objects:individual:BL Lac (PKS 2200+420); Galaxies: photometry1 Introduction
The nature of active galactic nuclei (AGNs) is still an open problem. Photometric observations of AGNs are important for constructing their light curves and to study their variation behavior on different time scales. Blazars are an extreme subclass of AGNs and often show large and violent variations. The variability on very short time scales from minutes to hours is a common property of blazars, and is observed in many objects ( Rieke et al. 1976; Smith et al. 1987; Sillanpaa et al. 1991; Carini et al. 1992; Romero et al. 1994, 1995a,b, 1997, 2000; Heidt & Wagner 1995; Miller & Noble 1996; Villata et al. 1997, 1999; Terasranta et al. 1998; Takalo 1994; Bai et al. 1999; Kraus et al. 1999; Raiteri et al. 1999).
BL Lacertae (PKS 2200+420), the archetype of its class, lies in a giant elliptical galaxy at a redshift of ( Miller et al. 1978). It is one of the best-studied objects. Superluminal components have been observed from the source( Mutel & Phillips 1987; Vermeulen & Cohen 1994; Fan et al. 1996; Xie et al., 1992, 1994; Webb et al. 1988; 1998; Catanese et al. 1997; Qin & Xie 1997; Fan et al. 1998a,b; Fan & Lin 1999, 2000 and reference therein). Its spectrum is usually featureless, but weak emission lines are indeed identified when the source is in the fainter state (Corbett et al. 1996). The optical variability is extremely irregular over periods of hundreds of days of continuous observation but a possible 14-year period was found in the B light curve (see Fan et al. 1998a). In addition, some rapid variability over short time scales has been reported: for example, a variation of 1.5 magnitude over a time scale of 20 hours (Weistrop, 1973), daily variation as great as 0.3 magnitude (Carswell et al. 1974), and variation of 0.1 magnitude over 30 minutes in the V band (Corbett et al. 1996). During the 1997 outburst period, it was widely observed in optical bands by many groups ( Nesci et al. 1998; Bai et al. 1999; Kovael et al. 1999; Massaro et al. 1999; Matsumoto et al. 1999; Miller et al. 1999; Nikolashvili et al. 1999a,b; Sobrito et al. 1999; Tosti et al. 1999a,b; Qian et al. 2000; Ghosh et al. 2000a,b and reference therein).
BL Lacertae is also one of the sources in our observing program. To investigate their short time-scale variability, we have made optical observations of blazars with the 1-m telescope at Yunnan Astronomical Observatory (YAO), the 1.56-m telescope at Shanghai Observatory (SHAO), and the 2.16-m telescope at Beijing Observatory (BAO) (Fan et al. 1997, 1998a; Qian et al. 2000; Xie et al. 1992, 1994).
In this paper, we present the BL Lacertae optical photometry observed with the 1.56-m telescope at SHAO during the period 1997 to 1999. In section 2, we present the data and analysis; in section 3, a brief conclusion.
2 Observations and analysis
2.1 Data reductoin
BL Lac is one of the regularly monitored objects at SHAO using the Cassegrain focus of the 1.56m telescope with a liquid nitrogen cooled Photometric 200 series CCD camera having pixels. The filters are standard Johnson and Cousins BVRI filters. The field of view is 4’17”, with 1 pixel=0.25”. The exposure times are typically set according to the sky conditions. The seeing at the Sheshan Station of SHAO usually varies from 1.2” to 1.5”.
The obtained frames were processed with the photometric task APPHOT of the IRAF software package after bias, dark and flat-field corrections. The bias frames were taken at the beginning and the end of the night observation. In addition, some were taken in the middle of the observations. Sky flat-field images were taken at dusk and dawn where possible. Otherwise, a dome flat was used. The dark and the flat-field corrections are 0.01 to 0.02 mag, mainly contributed by the flat-field.
We used stars B and C (Smith et al., 1985) as photometric comparison stars. Their colors are , for B and , for C while their magnitudes are , , for B and , , for C. Based on the long-term data, the colors of BL Lacertae are and on average, while the magnitudes are in the ranges: V = 10.52 to 15.25, R = 11.78 to 14.91, and I = 10.74 to 14.19 (Fan et al. 1998a). Because the colors of the comparison stars are similar to those of BL Lacertae while the magnitudes of the comparison stars are in the magnitude range of BL Lacertae, the reduction of the photometry is simplified, with no needed corrections for color or non-linearity.
We determined differential magnitudes of BL-B and B-C from the instrumental magnitudes of BL Lacertae (BL), the Star B (B), and star C (C). The curves B-C indicate observational uncertainties and the intrinsic variability of the stars. The variability of the target object BL Lacertae is investigated by means of the variability parameter, , introduced by Romero et al. (1999, see also Cellone et al. 2000). To do so, we determine the scatter of the differential magnitudes BL-B and B-C, and , the variability parameter is expressed as . If , then the target is variable.
The rms errors are calculated from the two stars using the formula:
where is the differential magnitude of stars B and C while is the differential magnitude averaged over the entire dataset, and is the number of the observations on a given night. The results are given in Table 1 for filters V, R and I. Column (1) is the Julian date, column (2) the V magnitude, column (3) the uncertainty in V, column (4) the R magnitude, column (5) the uncertainty in R, column (6) the I magnitude, and column (7) the uncertainty in I. The light curves are shown in Figure 1 for the bands R, V and I.
2.2 Analysis
2.2.1 Variation
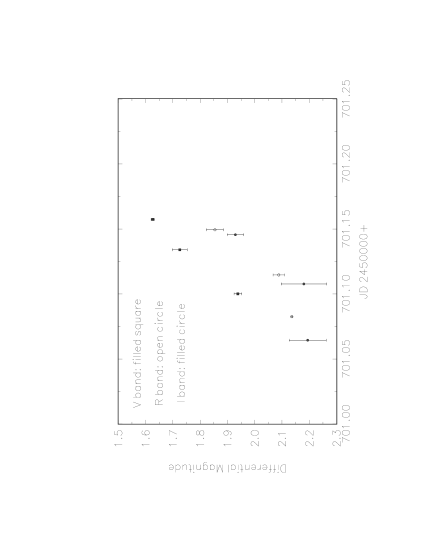
During the 1997 outburst, rapid variations of over 90 minutes by Sobrito et al. (1999) and over 40 minutes by Matsumoto et al. (1999) were found (see also Nesci et al. 1998). Our observations show that in the period JD 2450692 to JD 2450702, a variation of about 1 mag over a week is found in the three bands. In the period JD 2450701 to JD 2450701.5, variations of 0.40mag, 0.27mag, and 0.21mag over a time scale of 100 minutes were found in the V, R, and I wavebands (see Fig. 2) suggesting that the variations decrease with increasing wavelength, consistent with the findings of Nikolashvili et al. (1999a). No similar rapid variation was found in our other observations of the source during our monitoring period 1997 to 1999, which suggests that this does not happen often. The corresponding variability parameters are greater than 10.0.
After the 1997 outburst, it dimmed to a very low state (Fig. 1), with R = 14.76 on JD 2450738, and then brightened again. The brightening tendency is consistent with the later observation of a high state of R = 12.44 on JD 2451514.32 (Massaro & Nesci 1999). On JD 2451328.5 R = 13.10 was observed by Tosti & Nucciarelli (1999). On those days, we have no observations, but our data (R = 13.24 on JD 2451104 and R = 13.18 on JD 2451379) combined with those by Tosti & Nucciarelli (1999), and Massaro & Nesci (1999) suggest a brightening tendency.
2.2.2 Correlated variability
BL Lacertae was observed in V, R, and I bands from 1997 through 1999, which makes it possible for us to discuss the correlated variability among the colors. We analyzed our time-series data to search for time lag using the method of Discrete Correlation Function (DCF) (Edelson & Krolik 1988; also see Fan et al. 1998c, and Tornikoski et al. 1994).
First, we calculated the set of unbinned correlation coeffieient (UDCF) between data points in the two data streams and , i.e.
| (1) |
where and are points in the data sets, and are the average values of the data sets, and and are the corresponding standard deviations. Secondly, we averaged the points sharing the same time lag by binning the in suitably sized time-bins in order to get the for each time lag :
| (2) |
where is the total number of pairs. The standard error for each bin is
| (3) |
The results for time bins of 0.2 days are shown in Fig. 2 for V vs. R, R vs. I, and V vs. I respectively. No time delay longer than 0.2 day is found between any two bands.
3 Conclusion
BL Lacertae is a variable source through the whole magnetic waveband, and has been observed intensively. In this paper, we presented our measurements of V, R, and I bands for the period of 1997 to 1999. Short time scale variability over 100 minutes was found in the three bands, with the variation amplitude found to decrease with wavelength. This variation property was also noted by other authors. The optical variations are found to be correlated with no time delay exceeding 0.2 days.
Acknowledgements
The authors thank Dr. Wills for the comments and suggestions that improve the paper. JHF thanks Dr. G.E. Romero for his comments. This work is supported by the National Scientific Foundation of China (19973001) and the National 973 Project of China (NKBRAF G19990754).
References
- [] Bai, J.M., Xie, G.Z., & Li, K.H. et al. 1999, A&AS, 136, 455
- [] Carini M. T., Miller H. R., Noble J. C., Goodrich B. D. 1992, AJ 104, 15
- [] Catanese, M., Akerlof, C.W. Biller, et al. 1997, ApJ, 480, 562
- [] Corbett, E. Robinson, Axon, D.J. Hough, J. et al. 1996, MNRAS, 281, 737
- [] Edelson R. A., Krolik J. H., 1988, ApJ 333, 646
- [] Fan J.H., Xie, G.Z., & Wen S.L. 1996, A&AS, 116, 409
- [] Fan J.H., Xie G.Z., Pecontal E., et al. 1998a, ApJ 507, 173
- [] Fan J.H., Xie G.Z., Lin R.G., Qin Y.P., 1998b, A&AS 133, 217
- [] Fan J.H., Lin R.G., 1999, ApJS, 121, 131
- [] Fan J.H. Lin R.G., 2000, ApJ, 537, 101
- [] Ghosh K.K., Ramsey B.D., Sadun A.C., et al. 2000a, ApJS 127, 11
- [] Ghosh K.K., .; Ramsey, B. D.; Sadun, A. C. et al. 2000b, ApJ 537, 638
- [] Heidt J., Wagner S. 1995, A&A 305, 42
- [] Kovalev Yu.A., Berlin A.B., Nizhelsky N.A., Kovalev Y.Y., 1999, ASP Conf. Ser. Vol 159, p63
- [] Kraus A., Quirrenbach A., Lobanov A.P., et al., 1999, ASP Conf Ser, Vol 159, p67
- [] Massaro E., Nesci R., 1999, Blazar Data News N 24,
- [] Massaro E., Catalano S., Frasca A., et al. 1999, in OJ-94 Annual Meeting 1999, Eds. C.M. Raiteri, M., Villata, L.O., Takalo, p10
- [] Matsumoto K., Kato T., Nogami D. et al. 1999; PASJ, 51, 253
- [] Miller H.R., Ferrara E.C., Daya A.B. et al. 1999, in OJ-94 Annual Meeting 1999, Eds. C.M. Raiteri, M., Villata, L.O., Takalo, p20
- [] Miller, J.S. French, H.B., Hawley, S.A. 1978, ApJ, 219, L85
- [] Miller, H.R. & McGimsey B. 1978, ApJ, 220, 19
- [] Miller H.R., Noble J.C. 1996, APS Conf. Ser. Vol. 110,
- [] Mutel, R.L. Phillips, R.B. 1987, in Superluminal Radio Sources, eds, J.A. Zensus & T.J. Pearson,(Cambridge), p60
- [] Nesci R., Maessano M., Massaro E. et al. 1998, in: Tosti G., Takalo L. (eds.) Proc. OJ-94 Annual Meeting 1997. p193
- [] Nikolashvili M.G., Kurtanidze O.M., Richter G.M. 1999a, in C.M. Raiter et al.(eds.) OJ-94 Annual Meeting 1999, p33
- [] Nikolashvili M.G., Kurtanidze O.M., Richter G.M. 1999b, in C.M. Raiter et al.(eds.) OJ-94 Annual Meeting 1999, p36
- [] Qian B.C., Tao J., Fan J.H., 2000, (submitted)
- [] Qin Y.P., Xie G.Z., 1997, ApJL 487, 41
- [] Raiteri C.M., Villata M., Tosti G., 1999, in OJ-94 Annual Meeting 1999, Eds. C.M. Raiteri, M. Villata, L.O., Takalo, p76
- [] Rieke G.H., Grasdalen G.L., Kinman T.D. et al. 1976, Nat. 260, 754
- [] Romero G.E., Combi J.A., Colomb F.R., 1994, A&A 288, 731
- [] Romero G.E., Surpi G., Vucetich H. 1995a, A&A 301, 641
- [] Romero G.E., Combi J.A., Vucetich H. 1995b, ApSS 225, 183
- [] Romero G.E., Surpi G., Vucetich H. 1997, A&A 326, 77
- [] Romero G.E., Cellone S.A., Combi J.A., 2000, AJ 120, 1192
- [] Sillanpaa, A. Mikkola, S. Valtaoja, L. 1991, A&AS, 88, 225
- [] Smith, P.S. Balonek, T., Elston, R. Heckert, P.A; 1987, ApJS, 64, 459
- [] Smith, P.S. Balonek, T., Heckert P. Elston, R. Schmidt, G.D.; 1985, AJ, 90, 1184
- [] Sobrito G., Villata M., Raiteri C.M. et al. 1999, Blazar Data 1, 5
- [] Takalo, L.O. 1994, VA 38, 77
- [] Teraesranta H., Tornikoski M., Mujunen A. et al. 1998, A&AS 132, 305
- [] Tornikoski M., Valtaoja E., Terasranta H. et al. 1994, A&A 289, 673
- [] Tosti G., Luciani M., Frorucci M. et al. et al. 1999a, Blazar Data 2, 1
- [] Tosti G., Luciani M., Massaro E. et al. et al. 1999b, in L.O. Takalo & A. Sillanpaa (eds.), ASP Conf. Ser. Vol. 159, p145
- [] Tosti G. & Nucciarelli, G. 1999, Blazar Data News N. 22
- [] Vermeulen, R.C. & Cohen, M.H. 1994, ApJ, 430, 467
- [] Villata M., Raiteri C.M., Tosti G., et al., 1999, bmtm.proc, 73
- [] Villata M., Raiteri C.M., Ghisellini G., et al., 1997, &AS, 121, 119
- [] Webb, J.R., Smith, A.G., Leacock, R.J. et al. 1988, AJ, 95, 374
- [] Webb J.R., Freedman I., Howard E., et al. 1998, AJ 115, 2244
- [] Xie G.Z., Li K.H., Zhang Y.H., Liu F. K., Fan J. H., Wang J. C, 1994, A&AS, 106, 361
- [] Xie G.Z., Li K.H., Liu F.K., Lu R. W., Wu J. X., Fan J. H., Zhu Y. Y., Cheng F. Z., 1992, ApJS, 80, 683

bands.

![[Uncaptioned image]](/html/astro-ph/0103054/assets/x4.png)
![[Uncaptioned image]](/html/astro-ph/0103054/assets/x5.png)
![[Uncaptioned image]](/html/astro-ph/0103054/assets/x6.png)
![[Uncaptioned image]](/html/astro-ph/0103054/assets/x7.png)
![[Uncaptioned image]](/html/astro-ph/0103054/assets/x8.png)
![[Uncaptioned image]](/html/astro-ph/0103054/assets/x9.png)
![[Uncaptioned image]](/html/astro-ph/0103054/assets/x10.png)
![[Uncaptioned image]](/html/astro-ph/0103054/assets/x11.png)
![[Uncaptioned image]](/html/astro-ph/0103054/assets/x12.png)