An upper mass limit for the progenitor of the Type II-P supernova SN1999gi 111Based on observations made with the NASA/ESA Hubble Space Telescope, obtained from the data archive of the Space Telescope Institute, which is operated by the Association of the Universities for Research in Astronomy, Inc., under NASA contract NAS 5-26555.
Abstract
Masses and progenitor evolutionary states of Type II supernovae remain almost unconstrained by direct observations. Only one robust observation of a progenitor (SN1987A) and one plausible observation (SN1993J) are available. Neither matched theoretical predictions and in this Letter we report limits on a third progenitor (SN1999gi). The Hubble Space Telescope has imaged the site of the Type II-P supernova SN1999gi with the WFPC2 in two filters (F606W and F300W) prior to explosion. The distance to the host galaxy (NGC3184) of 7.9 Mpc means that the most luminous, massive stars are resolved as single objects in the archive images. The supernova occurred in a resolved, young OB association 2.3 kpc from the centre of NGC3184 with an association age of about 4 Myrs. Follow-up images of SN1999gi with WFPC2 taken 14 months after discovery determine the precise position of the SN on the pre-explosion frames. An upper limit of the absolute magnitude of the progenitor is estimated (). By comparison with stellar evolutionary tracks this can be interpreted as a stellar mass, and we determine an upper mass limit of 9M⊙. We discuss the possibility of determining the masses or mass limits for numerous nearby core-collapse supernovae using the HST archive enhanced by our current SNAP programme.
1 Introduction
Supernovae of Types II and Ib/Ic are thought to follow core collapse in massive stars at the end of their lifetimes. However the only definite and unambiguous detection of a SN progenitor is that of SN1987A in the LMC (White & Malin, 1987), which was a blue supergiant (B3Ia; Walborn et al., 1989). The progenitor of SN1993J in M81 was possibly identified as a K0 Ia star with some excess band flux either from unresolved OB association contamination or a hot companion (Aldering et al., 1994). Neither progenitor is consistent with the canonical stellar evolution picture, where core-collapse occurs while the massive star is an M-supergiant. There is an understandable lack of observational data to constrain the last moments of stellar evolution and explosion models for core collapse SNe. The supernova SN1999gi was discovered in NGC3184 on December 9th 1999 by Nakano & Kushida (1999) at an unfiltered CCD magnitude of 14.5, and confirmed to be a Type II-P (see Leonard & Filippenko, 2001, and references therein). Two SNAP programs with HST had previously imaged the SAB(rs)cd galaxy NGC3184 in two filters in June 1994 and June 1999 with the WFPC2. The distance to NGC3184 has been estimated by three methods which give good agreement of Mpc (). The first is determined from the recession velocity of 592 kms-1 (as given in NED and assuming H kms-1Mpc-1), the second from the tertiary calibration of de Vaucouleurs (1979), and the third from the Type Ia calibration of Pierce (1994). The relative proximity of SN1999gi, and the existence of high spatial resolution observations prior to explosion alerted us to the possibility of identifying the massive progenitor star which exploded. This Letter describes the analysis of the pre-explosion data, showing that a progenitor star is not detected on either of the WFPC2 pre-explosion frames. We set direct observational limits on the bolometric magnitude and luminosity of the progenitor star (which we refer to as PSN1999gi) and by comparison with stellar evolutionary models we can estimate an upper mass limit to the progenitor.
2 Observational data and analysis
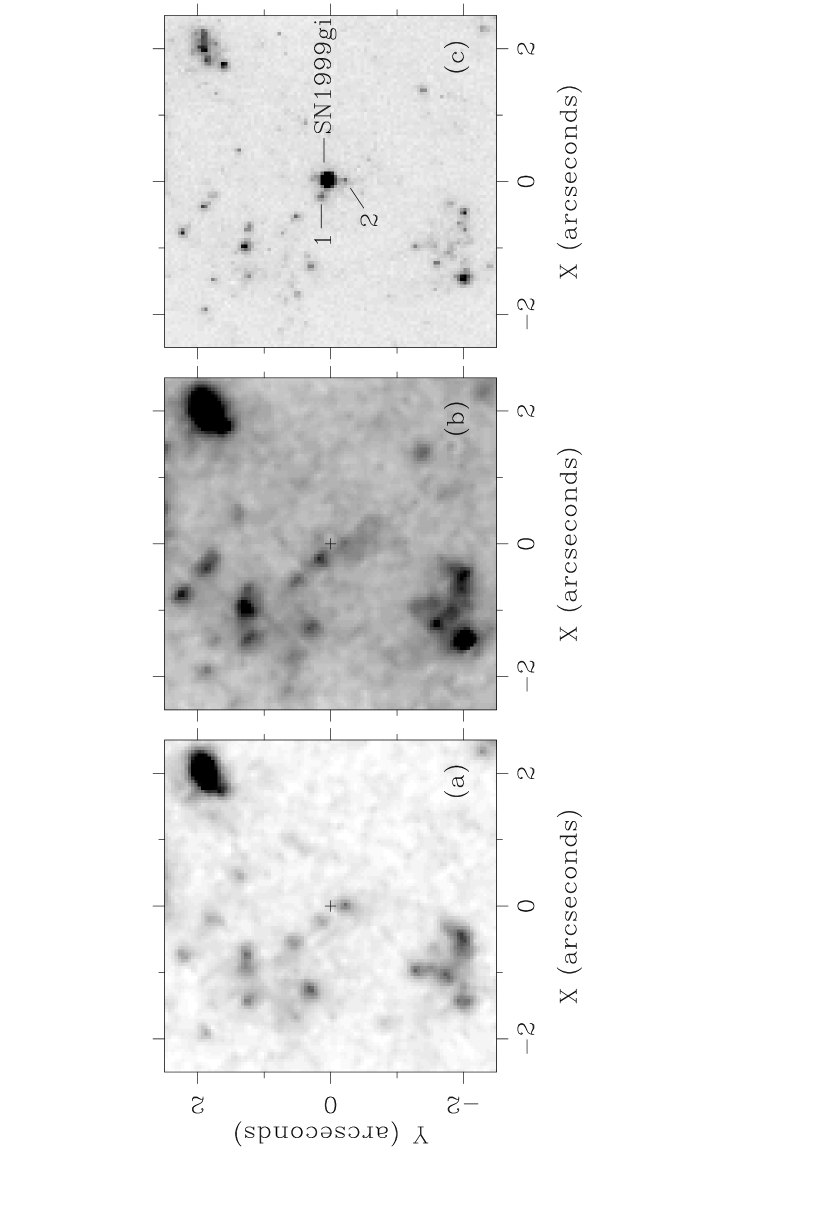
Observations of the galaxy NGC3184 were taken with the Wide-Field-Planetary-Camera-2 (WFPC2) on board the Hubble Space Telescope on two separate occasions through the filters F606W and F300W centred on 5957Å and 2911Å respectively (details are given in Table 1). The accuracy to which one can determine absolute astrometry of the WFPC2 frames () combined with the probable error on the position of SN1999gi (), means that the supernova position cannot be accurately determined on the pre-explosion data without a further calibration step. We hence re-observed the stellar association containing SN1999gi, with HST to locate precisely the supernova position on the pre-explosion observations. We placed the SN on WF4 to match the existing data as closely as possible and took repeat F606W/F300W data and supplemented this with F439W, F814W and F555W observations (for future detailed analysis of the host stellar association). The supernova was also observed ( in F555W only) by the SNAP programme 8602 to image the sites of recent nearby supernovae. In this case, SN1999gi was centred on the PC1 chip and, given the better effective resolution of this data, we have also used this image in our analysis (see Fig. 1). The SN originates in a resolved populous stellar cluster which, given the bright UV-magnitudes of the members, is clearly a large, young OB association which we will label NGC3184-OB1. To match the pre-explosion data to the pixel grid of the post-explosion frames (the F555W U6A05201R/2R is taken as reference), a simple 2-dimensional pixel transformation was calculated. Sixteen isolated, fairly bright stars common to all frames were identified and their centroids and magnitudes measured within the iraf daophot package using PSF fitting techniques (see below for more details). A geometric solution was calculated by fitting orthogonal polynomials which resulted in residuals of in each direction. Similar mean shifts between the stellar centroids in the resulting transformed frame and the reference F555W frame were measured indicating excellent mapping accuracy, and we set the SN position at coordinates (0,0). At this position there is no detection of a single star either through visible inspection, finding routines or aperture photometry. There are two bright blue stars nearby (OB1-1 and OB1-2) each from the SN but both are clearly visible on the post-explosion frames.
Therefore the progenitor is below the detection limits of both the F300W and F606W pre-explosion data. Simulations with synthetic stars were performed to determine the detection limits of the data in the vicinity of the SN position. Model point spread functions (PSFs) were used to make two 33 grids of stars of incrementally varying magnitudes (using Tiny Tim, Krist & Hook, 1999) and these were coadded to the observational data frames. Aperture photometry was used within DAOPHOT to find the stars and determine their magnitudes. We have taken the detection limit to be when more than 90% of the synthetic stars are detected by the daofind algorithm at more than 3 of the background level, their mean magnitudes are consistent with those of the model PSFs and they are visually identifiable. We estimate the detection limit of the F606W exposures to be , and for the F300W exposures . The calibration of Whitmore et al. (1999) was used to estimate the charge-transfer-efficiency effect, which reduces these limits by 4% and 26% respectively. Three other adjustments were made for geometric correction, aperture correction and contamination (Holtzman et al., 1995a, b), giving final corrected limits of , and . Both these values are consistent with the faintest detected objects on the WF4 chip.
To estimate the reddening, and approximate age of the OB1 association, photometry of the single resolved stars was performed on the F300W and F555W post-explosion exposures. Standard methods of point spread function (PSF) fitting photometry were used within the IRAF package daophot with TinyTim PSFS (e.g. Johnson et al., 2001). Counts were first determined within apertures and the standard corrections for geometric distortion, and charge-transfer-efficiency (CTE) were performed, according to Holtzman et al. (1995a) and Whitmore et al. (1999). An aperture correction was then made to a aperture, and contamination corrections in the two filters (again Holtzman et al., 1995a, b) were applied. We removed objects which are much broader than a typical PSF and which have poor goodness-of-fit parameters (using the sharpness and chi values produced by allstar), and a colour-magnitude diagram is shown in Fig. 2. The Geneva evolutionary isochrones from Lejeune & Schaerer (2001) were reddened assuming values of E(B-V)= by using transformations calculated within synphot. A good fit to the luminous stars in the cluster is found with a value of E(B-V)=0.15, and an age of 4 Myrs. Such a young age is required to fit the most luminous, and hottest stars in the cluster. A value of E(B-V)=0.3 cannot be ruled out, although it does not trace the position of the brightest stars in the diagram. As discussed below, Zaritsky et al. (1994) determined the reddening towards the H ii region surrounding OB1 to estimate nebular abundances, and quote Av=1.07, more compatible with the E(B-V)=0.3 value. The best estimate from the stellar content appears to be E(B-V)=0.15, and we discuss the consequences for a larger reddening below.
The detection limits of the and pre-explosion images can be converted to limits on the bolometric magnitude and hence luminosity of the progenitor object, if we assume that the reddening estimated for the cluster stars is representative of that towards PSN1999gi. The upper limit can be converted to an absolute visual magnitude through the standard relation (where ; a colour correction to convert the STMAG to a Johnson V, which is dependent on stellar spectral type).
| (1) |
As we have no knowledge of the spectral type of the progenitor we can calculate for the range of supergiant spectral type possibilities, and these are listed in Table 2. The value for is calculated for each spectral type within synphot using the Bruzual atlas of model spectra provided, and the bolometric corrections (BC) are taken from Drilling & Landolt (2000). In this table we also list the upper limit of the stellar luminosity, assuming the solar . Similarly we can use the limiting magnitude, and through synphot calculate the colour difference as a function of spectral type, and hence calculate an equivalent and upper limit to the stellar luminosity.
3 Discussion
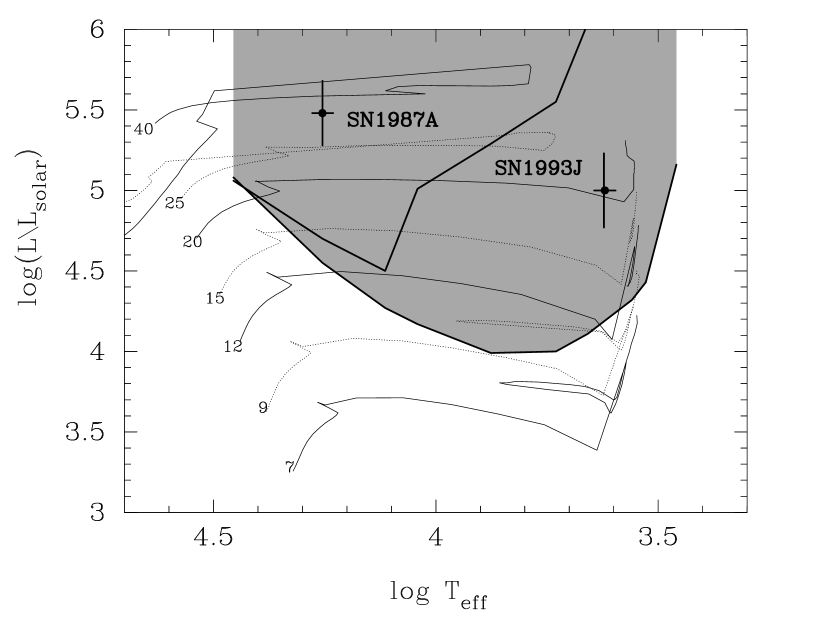
The limits we have set on the total luminosity of PSN1999gi allow comparison with stellar evolutionary model predictions for pre-supernova massive stars, and we have chosen the Z=0.04 metallicity Geneva tracks (Meynet et al., 1994; Schaller et al., 1992, with twice the normal mass-loss rates) for the following reason. The oxygen abundance gradient in NGC3184 has been determined by Zaritsky et al. (1994) and their H ii region N and E (2.3 kpc radial distance) from the nucleus of NGC3184 is almost certainly the H ii region associated with NGC3184-OB1. The O/H abundance derived is 9.260.2 dex, suggesting that the stars in this cluster are significantly more metal rich than solar (8.83 dex from Grevesse & Sauval, 1998). The mass-loss rates used in these models are particularly high for the more massive stars which experience Wolf-Rayet phases of evolution. However for masses of less than (which we show below is the region of interest) mass-loss plays only a minor role in determining the point in the H-R diagram at which the star explodes and we find similar constraints with alternative models, including those with no mass loss (e.g. Pols et al., 1998). The WFPC2 pre-explosion images are sensitive to all objects located in the shaded regions in Fig. 3. For reference we show the position of Sk69202, the B3Ia progenitor of SN1987A. Clearly PSN1999gi was not a similar massive B-type progenitor, or it would have been detected on both the F606W and F300W frames. The best, and fairly conservative, estimate of the upper mass of the progenitor is 9M⊙. We have assumed a reddening of E(B-V)=0.15, and if this was increased to 0.3 (as discussed in the previous section), the luminosity limits would increase by 0.2. This effectively increases the mass limit to 12M⊙, but still rules out a 15M⊙ or above progenitor.
This quite low initial mass value is surprising given the nature of the massive luminous stars in the OB1 association, and the age we derived from the Lejeune & Schaerer (2001) isochrones of 4 Myrs. The bluest, bright stars in this cluster have and magnitudes consistent with being very massive OB-supergiants (40-60M⊙) which have main-sequence lifetimes of Myrs. However a 9M⊙ progenitor would have a lifetime of Myrs (Schaller et al., 1992). The progenitor was clearly not one of the most massive stars in this association, in fact not even close in mass to the most luminous stars visible. This suggests that the cluster did not form coevally and the age spread is Myrs. Although quite broad, this is not unprecedented; for example see the work on the the Milky Way double cluster h and Persei (Wildey, 1964; Vogt, 1971), and the 30 Doradus complex in the LMC (Walborn & Blades, 1997). One caveat is that the detection limits are not sensitive to all evolved, hot massive stars i.e. Wolf-Rayet types. The WR stars span a large range in ( to ; Vacca & Torres-Dogden, 1990), and the fainter ones would be below the detection limits, but given that SN1999gi was a Type II-P containing substantial H i it is unlikely that the progenitor was a hydrogen depleted WR star. It could possibly have exploded during the early stages of Wolf-Rayet evolution while it still has a significant hydrogen envelope but is sufficiently blue to remain undetected. However we do not favour this possibility because it requires fine tuning of the mass-loss rate but note that a similar evolutionary scenario would explain the blue progenitor of SN1987a. One could alternatively imagine the progenitor being a high mass, dust embedded star whose luminosity is extinguished by extinction, however this dust would also have dimmed the SN event itself. The lightcurve of SN1999gi peaked at approximately (from various web sources), suggesting M, which is not an underluminous event by any means (see Miller & Branch, 1990).
Our conclusion is that SN1999gi was not a very high mass star and very likely had an initial mass of less than 9M⊙. The well maintained, and easily accessible HST archive has made this project feasible and, in the future, will allow the investigation of SNe sites before explosion to be investigated in a systematic way. We have a Cycle 10 SNAP project that will bring the number of late-type galaxies (within a distance of 17 Mpc) with WFPC2 2 or 3-colour photometry to 350. This will allow the sites of future core-collapse SNe in these galaxies to be imaged prior to explosion and will extend the present work to a more statistically meaningful sample. The advent of Virtual Observatory initiatives both in Europe and the US (e.g. astrovirtel) will make this type of project even easier to manage, and allow very fast reaction to events where either limits can be set on the progenitor or in the event that a candidate star is identified.
References
- Aldering et al. (1994) Aldering G., Humphreys R.M., Richmond M., 1994, AJ, 107, 662
- de Vaucouleurs (1979) de Vaucouleurs G., 1979, ApJ, 227, 729
- Drilling & Landolt (2000) Drilling J.S., Landolt A.U., 2000, in Allen’s Astrophysical Quantities, ed. A.N. Cox, AIP Press
- Grevesse & Sauval (1998) Grevesse N., Sauval A.J., 1998, Space Science Rev., 85, 161
- Holtzman et al. (1995a) Holtzman J.A., et al., 1995, PASP, 107, 156
- Holtzman et al. (1995b) Holtzman J.A., et al., 1995, PASP, 107, 1065
- Johnson et al. (2001) Johnson R.A., Beaulieu S.F., Gilmore G.F, Hurley J., Santiago B.X, Tanvir N.R, Elson R.A.W., 2001, MNRAS, in press, (astroph-0012389)
- Krist & Hook (1999) Krist J., Hook R., 1999, The Tiny Tim Users Guide, wwww.stsci.edu/software/tinytim
- Lejeune & Schaerer (2001) Lejuene T., Schaerer D., 2001, A&A, 366, 538
- Leonard & Filippenko (2001) Leonard D.C., Filippenko A.V., 2001, PASP, in press, astro-ph/0105295
- Meynet et al. (1994) Meynet G., Maeder A., Schaller G. Schaerer D., Charbonnel C., 1994, A&AS, 103, 97
- Miller & Branch (1990) Miller D.L., Branch D., 1990, AJ, 100, 530
- Nakano & Kushida (1999) Nakano S., Kushida R., 1999, IAU Circ., 7329
- Pierce (1994) Pierce M.J., 1994, ApJ, 430, 53
- Pols et al. (1998) Pols, O. R., Schroder, K.-P., Hurley, J. R., Tout, C. A., & Eggleton, P. P. 1998, MNRAS, 298, 525
- Schaller et al. (1992) Schaller G., Schaerer D., Meynet G., Maeder A., 1992, A&AS, 96, 269
- Vacca & Torres-Dogden (1990) Vacca W.D., Torres-Dogden A.V., 1990, ApJS, 73, 685
- Vogt (1971) Vogt N., 1971, A&A, 11, 359
- Walborn & Blades (1997) Walborn N., Blades C., 1997, ApJS112, 457
- Walborn et al. (1989) Walborn N. et al., 1989, A&A, 219, 229
- White & Malin (1987) White G.L., Malin D.F., 1987, Nature, 327, 36
- Whitmore et al. (1999) Whitmore B. et al., 1999, PASP, 111, 1559
- Wildey (1964) Wildey R.L., 1964, ApJS, 8, 439
- Zaritsky et al. (1994) Zaritsky D., Kennicutt R.A., Huchra J.P., 1994, ApJ, 420, 87
| Dataset | Date | Filter | Exposure Time | Location |
|---|---|---|---|---|
| U3HY2901R/2R | 9th June 1994 | F606W | 160s | WF4 |
| U29R1501T/2T | 21st June 1999 | F300W | 800s | WF4 |
| U6BR0105R/6R/7R | 2nd March 2001 | F300W | 1200s | WF4 |
| U6A05201R/2R | 24th January 2001 | F555W | 700s | PC1 |
| Limits from | Limits from | |||||||
|---|---|---|---|---|---|---|---|---|
| Sp. Type | (K) | BC | BC | |||||
| B0 | 28500 | 2.90 | 7.96 | 5.08 | 1.06 | 7.92 | 5.06 | |
| B3 | 18000 | 1.57 | 6.63 | 4.55 | 0.15 | 7.01 | 4.70 | |
| B8 | 13000 | 0.87 | 5.93 | 4.27 | 0.34 | 6.52 | 4.50 | |
| A0 | 11000 | 0.62 | 5.68 | 4.17 | 0.93 | 7.79 | 5.01 | |
| F0 | 7500 | 0.18 | 5.24 | 3.99 | 1.63 | 8.49 | 5.29 | |
| G0 | 5370 | 0.19 | 5.25 | 4.00 | 2.28 | 9.04 | 5.55 | |
| K0 | 4550 | 0.47 | 5.53 | 4.11 | 3.51 | 10.37 | 6.04 | |
| M0 | 3620 | 0.99 | 6.05 | 4.32 | 5.33 | 12.19 | 6.77 | |
| M2 | 3370 | 1.27 | 6.33 | 4.43 | 5.62 | 12.48 | 6.89 | |
| M5 | 2880 | 3.11 | 8.17 | 5.16 | 7.47 | 14.33 | 7.63 | |