The Millennium Outburst of the Cool Hypergiant Cassiopeiae : Spectroscopy and Modeling
Abstract
Between 2000 June and September an exceptional variability phase occurred in the peculiar F-type hypergiant Cas, when the -brightness dimmed by at least a full magnitude. The star recovered from this deep minimum by 2001 April. It is the third outburst of Cas on record in the last century. We observe TiO absorption bands in high-resolution optical and near-IR spectra obtained with the Utrecht Echelle Spectrograph during the summer of 2000. TiO formation in the outer atmosphere occurred before the deep brightness minimum. Atmospheric models reveal that the effective temperature decreases by at least 3000 K, and the TiO shell is driven supersonically with 5.4 . Strong episodic mass loss and TiO have also been observed during the outbursts of 1945-47 and 1985-86.
An analysis of the exceptional outburst spectra of 2000–01 is provided, by comparing with high-resolution optical spectra of the early M-type supergiants Cep () and Betelgeuse (). During the outburst, central emission appears above the local continuum level in the split Na lines. A prominent optical emission line spectrum appears in variability phases of fast wind expansion. The radial velocity curves of H, and of photospheric metal absorption lines signal a very extended, and velocity stratified dynamic atmosphere. The outburst spectra indicate the formation of a low-temperature, optically thick circumstellar gas shell of 3 during 200 d, caused by dynamic instability of the upper atmosphere of this pulsating massive supergiant near the Eddington luminosity limit.
We present an equation that correctly predicts the outburst time-scale, whereby the shell ejection is driven by the release of hydrogen recombination energy. The observations reveal that during the outburst the atmospheric hydrogen recombination zone dissipates 5 % of the stellar luminosity into the circumstellar environment, by driving a superwind. We observe that the mass-loss rate during the outburst is of the same order of magnitude as has been proposed for the outbursts of Carinae. These phases of punctuated mass-loss represent the major mass-loss mechanism of cool massive hypergiants. The research results in this paper are described in further detail in Lobel et al. (2003). A spectral movie sequence of the outburst is available at http://cfa-www.harvard.edu/alobel.
Harvard-Smithsonian Center for Astrophysics, 60 Garden Street, Cambridge MA 02138
Instituto de Astrofisica de Canarias, E-38200 La Laguna, Tenerife, Spain
Ritter Astrophysical Research Center, University of Toledo, Toledo, OH 43606
SRON Laboratory for Space Research, Sorbonnelaan 2, 3584 CA Utrecht, the Netherlands
Astronomy Division, PO Box 3000, 90014 University of Oulu, Finland
Special Astrophysical Observatory, Nizhnij Arkhyz 369167, Russia
1. Introduction
Cool hypergiant stars as Cas (HD 224014) and HR 8752 are thought to be post-red supergiants, rapidly evolving toward the blue supergiant phase (de Jager 1998). They are rare enigmatic objects, which we are continuously monitoring with high spectral resolution since about one decade. Yellow hypergiants () are very important objects to investigate the physical causes for the luminosity limit of evolved stars. A spectroscopic study during 1993-95 showed that Cas is a slowly pulsating supergiant with changes in the optical spectrum corresponding to variations in of less than 750 K (=7250 K 6500 K; Lobel et al. 1998).
During a famous outburst of Cas in 1945-47 many zero-volt excitation energy lines appeared, not previously observed in its absorption spectrum. These atomic lines, normally observed in M-type supergiants, were strongly blue-shifted, signaling the ejection of a cool circumstellar gas shell (Beardsley 1961). In the following two decades after this event, several papers were published in the astrophysical literature, discussing Cas’ peculiar spectroscopic changes in the years during and after this dramatic outburst (e.g. Popper 1947; Thackeray 1948). Between 1945 and 1946 the star rapidly dimmed and the spectrum developed optical and near-IR TiO bands. Within a couple of years, the hypergiant brightened up by nearly a full magnitude, and a mid G-type spectrum was recovered around 1950. More recently, Boyarchuk, Boyarchuk, & Petrov (1988) also reported the detection of TiO bands in the optical spectrum during a more moderate outburst of 1985-87.
This paper discusses the spectroscopic changes we monitored during the 2000-01 outburst. We analyze prominent TiO bands newly detected in the spectra, before and during the outburst minimum. A brief discussion of the stellar outburst physics is also provided.
2. Radial Velocity and Brightness Curves
The upper panel of Figure 1 shows photo-electric observations of Cas in the -band (black dots) by Percy, Kolin, & Henry (2000) over the past decade, supplemented with visual magnitude estimates from , and from (French Association of Variable Star Observers) during the outburst of late 2000 (cyan dots). The brightness curve shows semi-regular variability, with the deep outburst minimum of in 2000 September–November, preceded by a conspicuously bright visual maximum () in 2000 March.
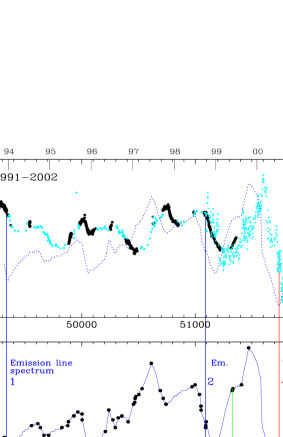
The lower panel shows the radial velocity curve which has been monitored from the unblended Fe i 5572 absorption line (black dots). The radial velocity curve, determined from a linear interpolation of the temporal Fe i line profile changes, is compared with the -magnitude curve in the upper panel (blue dotted line). We observe that the star becomes brightest for variability phases when the atmosphere rapidly expands. decreases by 20 in less than 200 d during the outburst event. The short black vertical lines mark a total of 78 echelle spectra observed with high-resolution spectrographs over the past 8.5 years.
The spectra have been obtained from our long-term monitoring campaigns with four telescopes in the northern hemisphere; the Utrecht Echelle Spectrograph of the William Herschel Telescope (La Palma, Canary Islands), the Sofin spectrograph of the Nordic Optical Telescope (La Palma, Canary Islands), the Ritter Observatory telescope (OH, USA), and the Zeiss-1000 telescope of the Special Astrophysical Observatory of the Russian Academy of Science (Zelenchuk, Russia). The spectra marked with a colored long vertical line (labeled 1 to 5) in Figure 1 are discussed below.
3. Formation of Titanium-oxide Bands during the Outburst
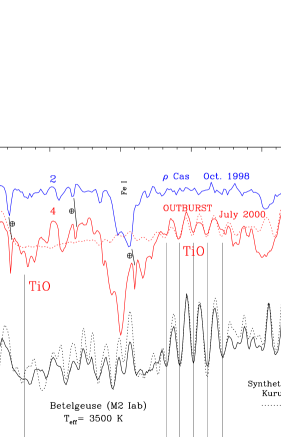
We observe the formation of titanium-oxide (TiO) absorption -system bands in the (WHT-UES) outburst spectra of Cas in July 2000 (red solid line in Fig. 2). The calculated spectrum with only TiO lines is shown in Figure 2 with the red dotted line. A best fit is obtained for a Kurucz model atmosphere of =3750 K and =0. The characteristic TiO bands around 7070 Å (marked with vertical lines) are also observed in the supergiant Betelgeuse (M2 Iab) (black solid line), computed with =3500 K and =0.5 (black dotted line) (see Lobel & Dupree 2000).
The spectrum synthesis typically contains 1500 TiO lines per Å from the P, Q, and R-branches, for five ZTi isotopomers (=46–50), with Earth abundance fractions (Schwenke 1998). The TiO bands in Cas signal the formation of a cool, optically thick, circumstellar gas shell with 4000 K, caused by the supersonic expansion of the outer atmosphere during the outburst. We observe an expansion velocity of =352 for these TiO bands, about 15–20 faster than the atmospheric expansion velocity we determine from the atomic photospheric absorption lines.
4. Modeling the Outburst Spectrum
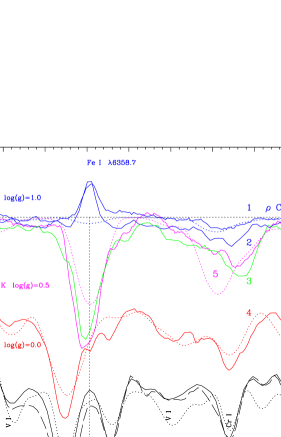
In Figure 3 a best fit to the atomic spectrum, observed during the outburst of Cas (solid red line labeled 4), is computed with =4250 K and =0 (red dotted line). The graph is centered in the heliocentric velocity scale around the Fe i and V i blend at 6358. The vertical dotted line is drawn at the stellar rest velocity of 47 (Lobel 1997). During the outburst, the entire photospheric spectrum Doppler shifts toward the shorter wavelengths, and develops many atomic absorption features also observed in Betelgeuse and Cep (compare with lower black lines).
We also observe many peculiar metal emission lines appearing above the stellar continuum level during two phases with very fast atmospheric expansion in 1993 December (blue vertical line labeled 1 in Figure 1) and 1998 October (labeled 2). The accelerated stellar wind collides with circumstellar or interstellar material, which excites the permitted emission line spectrum. Further analyses of the formation of the peculiar emission line spectrum in Cas are presented in Lobel (1997 Chapter 4; 2001a). For these variability phases we compute that =7250 K (upper blue dotted curve in Figure 3). The spectrum modeling therefore reveals a decrease in of at least 3000 K during the outburst of Cas in late 2000.
5. Mass-loss Rate During the Outburst
We compute from the synthetic spectrum fits to the TiO bands a mass-loss rate of 5.4 during the outburst of Cas. We assume spherical geometry; =4 , with =400100 , and the minimum density in the TiO line formation region. The spectrum synthesis reveals that returned to 5750 K within 100 d after the deep outburst minimum (magenta dotted line in Figure 3), corresponding to a brightness increase of (magenta vertical line labeled 5 in Figure 1).
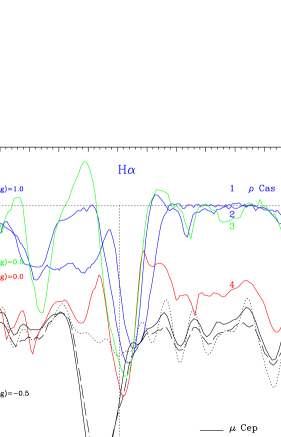
During the outburst, the H line profile develops prominent emission wings, signaling a large , around a central absorption core that becomes unusually weak (red line in Figure 4). The comparison with the H profiles of Betelgeuse and Cep in Figure 4 (lower black lines) reveals that the line core during the outburst is not excited by a stellar chromosphere, as is the case for these M-type supergiants. The spectrum computed for Betelgeuse without the model for the chromosphere (black dotted line) shows that the H transition is not sufficiently excited to match the depth of the observed absorption line core. The H line profile of Cas is filled in by recombination line emission during the outburst cooling of the upper atmosphere. The line thereby assumes a self-absorbed shape, indicating a very extended H envelope which is optically thick. In 1999 May we observe (green vertical line labeled 3 in Figure 1) a very prominent blue emission wing in H, while the photospheric spectrum strongly shifts to the longer wavelengths (green line in Figure 4). It indicates an exceptional (pre-outburst) variability phase with very strong downflow in the upper and lower atmosphere, which precedes the brightness maximum of 2000 March, leading up the actual outburst event.
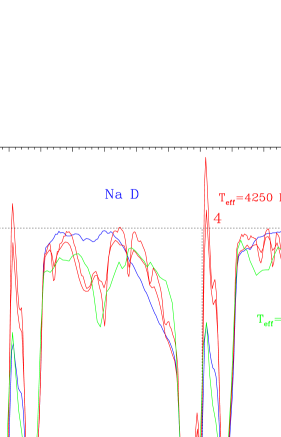
6. Na Emission During the Outburst
During the outburst we observe prominent emission lines in the deep and broad absorption cores of the split Na doublet lines. The central emission maxima appear above the local continuum level in Figure 5 (red lines labeled 4). This results from the strong decrease of the optical continuum flux due to the decrease of by at least 3000 K. We observe that the TiO bands develop before the deep brightness minimum is reached, when the photosphere assumes the maximum expansion velocity in Figure 1 (vertical red line labeled 4). The -brightness minimum results from a strong decrease of the entire atmospheric temperature structure. Unlike the photospheric absorption lines, the Na lines are intensity saturated and do not reveal Doppler shifts with time (compare with 1 and 3 in Figure 5). The far violet extended Na line wings form in an optically thick wind during the fast atmospheric expansion. These extended line wings were very strong in 1993 December (blue line labeled 1), with maximum wind velocities up to 130 .
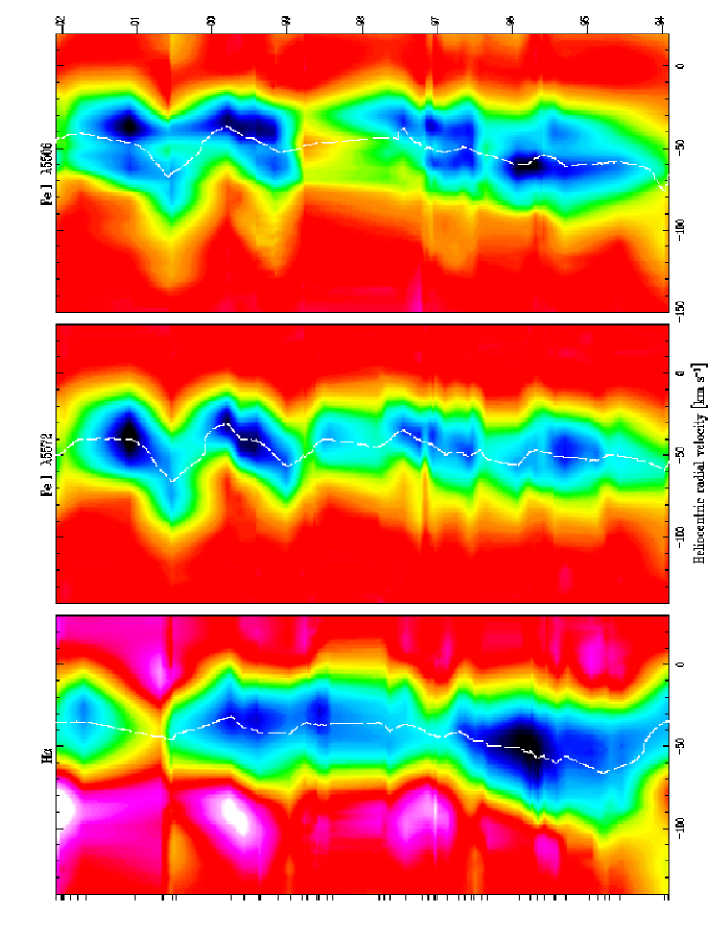
7. Dynamic Spectra of 1993–2002
Figure 6 shows the dynamic spectra of H, Fe i 5572, and the split Fe i 5506 line, observed between 1993 November and 2002 February. Red color indicates the stellar continuum level, and blue color the flux depression in the absorption lines. The white spots in H are emission above the stellar continuum level. The line profiles are linearly interpolated between consecutive observation nights, marked with the left-hand tickmarks. The radial velocity curves at half intensity minimum of H, and of the Fe i lines (white dashed lines) reveal a strongly velocity stratified dynamic atmosphere. We observe that H varies over a much longer period of time compared to the photospheric Fe i lines. It signals that H forms on average higher, over a more extended portion of the pulsating atmosphere. Notice the strong blueshift of the Fe i lines during the outburst of mid 2000. The outburst is preceded by very strong line emission in the short wavelength wing of H, while the absorption core extends longward, and the photospheric Fe i lines strongly red-shift. We observed that a strong collapse of the entire atmosphere precedes the outburst event during the pre-outburst cycle of 1999.
Notice further the development of even stronger emission in the short-wavelength wing of H, and very weak Fe i lines during the more recent brightness maximum of 2002 December. High-resolution observations of 2002 June and July reveal a remarkable split H absorption core. This type of line shape was not observed in the past 8.5 years. Only Beardsley (1961) mentions the observation of “core emission” in H during the famous outburst of 1945–47. Our H observations may therefore signal that a new, presumably stronger, outburst is imminent in Cas.
A spectral movie of the Cas outburst is electronically available at
http://cfa-www.harvard.edu/alobel through animated GIF and AVI format files.
A high-resolution atlas of the optical spectrum of Cas will also be posted at
this URL address.
8. Hydrogen Recombination Driving Mechanism
We compute that the hypergiant atmosphere becomes dynamically unstable because the first generalized adiabatic index ( ln / ln , volume averaged over the atmosphere, assumes values below the stability value of 4/3 (Lobel 2001b). 4/3 when increases to 7250 K during the strong atmospheric collapse before the outburst. The outburst event, directly following this strong collapse, is driven by the release of ionization energy due to the recombination of hydrogen with the cooling of the entire atmosphere by 3500 K. For an adiabatic spherical expansion we calculate that the outburst time-scale is correctly predicted with (Lobel et al. 2003):
| (1) | |||
is the third adiabatic index, evaluated for a mean ionization fraction of 1/2, in the partial hydrogen ionization zone, where the atmosphere is most expandable (or compressible). For =400 , =7250 K, and 8000 K in the partial hydrogen ionization zone with =13.6 eV, we compute =221 d, and an expansion velocity of 36 , in good agreement with the observed values. Hence, equation (1) predicts that during the outburst the atmosphere expands over 2.5 with the complete recombination of hydrogen.
We also estimate that the time-scale over which the total hydrogen recombination energy, released into the circumstellar environment by the outburst, is dissipated by the stellar radiation field during a period following the fast envelope expansion of
| (2) |
where is the Stefan-Boltzmann constant. For an atmospheric expansion of = 869 during outburst, and a mean envelope density of = , we compute with equation (2) that 86 d for =3500 K. This time-scale corresponds very well to the period over which the deep brightness minimum of 100 d was observed in late 2000. The total energy released into the circumstellar environment = 4 with complete hydrogen recombination is erg. This amount of energy yields a luminosity of = 1.8 , when radiated during 100 d. For a total stellar luminosity of = 3.5 during quiescent variability phases, is 5% of .
In conclusion, we find that during the outburst the partial hydrogen recombination zone of the hypergiant atmosphere dissipates several percent of the stellar luminosity into the stellar environment, thereby driving an expanding wind to highly supersonic outflow velocities during a global cooling of the entire atmosphere by more than 3000 K.
9. Conclusions
We observe the formation of TiO bands in the spectrum of Cas before the deep brightness minimum in the outburst of 2000-01. A supersonic expansion velocity is observed for the new TiO bands, while rapidly dims by more than a full magnitude. The TiO shell expands faster than the photosphere, observed from atomic metal absorption lines. A large oscillation cycle and a very bright light maximum, with above 7250 K, precede the outburst event. We compute that 5.4 during the outburst, whereby decreases from 7250 to 3750 K. returns to 5750 K within 100 d after the deep outburst minimum. Since recurrent outbursts occur about every half century in Cas, these outburst phases of punctuated mass-loss are the major mass-loss mechanism of this massive cool hypergiant. A prominent emission line spectrum is observed above the stellar continuum level in Cas during phases of fast wind expansion. We compute that the outburst is driven by the release of hydrogen recombination energy with the cooling of the entire atmosphere. Based on observations of the H line profile evolution in the summer of 2002 we expect that a new outburst of Cas is imminent.
Acknowledgments.
This research is supported in part by an STScI grant GO-5409.02-93A to the Smithsonian Astrophysical Observatory. A. L. gratefully acknowledges support from SRON-Utrecht (The Netherlands) over the years for maintaining the spectral data base of Cas. We thank the numerous observers of the WHT-UES service programs who have contributed to this long-term project.
References
Beardsley, W. R. 1961, AJ, 58, 34
Boyarchuk, A. A., Boyarchuk, M. E., & Petrov P. P. 1988, Proc. of the sixth Soviet-Finnish Astronomical Meeting held in Tallinn, Nov. 10-15, 1986, U. Hanni & I. Tuominen (eds.), Tartu Astrophysical Obs. Teated, 92, 40
de Jager, C. 1998, A&ARev., 8, 145
Lobel, A. 1997, Pulsation and Atmospherical Instability of Luminous F and G-type Stars, PhD. thesis, Brussels Univ., ISBN 90-423-0014-0, Shaker Publ., Maastricht
Lobel, A. 2001a, http://lanl.arXiv.org/abs/astro-ph/0108358
Lobel, A. 2001b, ApJ, 558, 780
Lobel, A., & Dupree, A. K. 2000, ApJ, 545, 454
Lobel, A., Dupree, A. K., R. P. Stefanik, G. Torres, G. Israelian, C. de Jager, H. Nieuwenhuijzen, I. Ilyin, N. Morrison, & F. Musaev 2003, ApJ, in press
Lobel, A., Israelian, G., de Jager, C., Musaev, F., Parker, J. Wm., & Mavrogiorgou, A. 1998, A&A, 330, 659
Percy, J. R., Kolin, D. L., & Henry G. W. 2000, PASP, 112, 363
Popper, D. M. 1947, AJ, 52, 129
Schwenke, D. W. 1998, Faraday Discuss., 109, 321
Thackeray, A. D. 1948, MNRAS, 108, 279