Quasi-Periodic Oscillations in Numerical Simulation of Accretion Flows Around Black Holes
Abstract
We present results of several numerical simulations of two dimensional axi-symmetric accretion flows around black holes using the Smoothed Particle Hydrodynamics (SPH). We consider both stellar black holes and as well as super-massive black holes. We assume bremsstrahlung to be the only source of cooling as it is simpler to implement in numerical simulations. We observe that due to both radial and vertical oscillation of shock waves in the accretion flow, the luminosity and average thermal energy content of the inner disk exhibit very interesting behaviors. When power density spectra are taken, quasi-periodic oscillations are seen at a few Hz and also occasionally at hundreds of Hz for stellar black holes. For super-massive black holes, the time-scale of the oscillations ranges from hours to weeks. The power density spectra have usual flat top behavior with average rms amplitude a few percent and a broken power-law behavior. The break frequency is generally found to be close to the QPO frequency as seen in the observed power spectra of black holes.
(Submitted to Astrophysical Journal)
1 Introduction
Galactic black holes are known to exhibit quasi-periodic oscillations (QPOs). Today, there are almost a dozen of confirmed stellar mass black hole candidates for which QPOs are regularly observed, some at normal frequency (Hz) and some with frequency at hundreds of Hz. Molteni, Sponholz and Chakrabarti (1996, hereafter referred to as MSC96) and Ryu, Chakrabarti, and Molteni (1997) suggested that shock oscillations might be responsible for these observed QPOs. Subsequently, Chakrabarti & Manickam (2000) and Rao, Naik, Vadawale, and Chakrabarti (2000) showed that indeed, the soft X-ray does not participate in the oscillation, but the hard X-ray, which is supposed to be emitted from the post-shock region at the inner edge of the disk, do participate in the oscillations, thereby vindicating the original claim that shock oscillation could really be the reason of most of the QPOs observed. It has been shown earlier that the outflows from the post-shock region depend on the shock strength, i.e., the spectral states (Chakrabarti, 1999). This has also been tested by various observations (e.g., Dhawan et al., 2000).
In the present paper, we make an effort reproduce the observed power density spectra of black hole candidates by simply studying realistic and time-dependent low angular momentum flows close to a black hole as a function of flow parameters. For the sake of simplicity, we use bremsstrahlung cooling only, but increase the accretion rate so that the cooling is more effective (as in the more realistic case of Comptonization, for instance). In the past, enhanced cooling has been modeled by power-law cooling process (e.g., Langer, Chanmugam & Shaviv, 1982; MSC96), but we stick to bremsstralung only. We find that the flow oscillates vertically due to interaction of the inflow and the outflow (e.g., Molteni et al. 2001), and when the parameters are ‘right’, even the shocks oscillate, both in radial and in vertical directions. As a result of these oscillations which cause local density and temperature fluctuations, the cooling rate of the flow can be strongly time-dependent. We made light-curves with the average luminosity as a function of time and studied their power density spectra (PDS). We present only a few illustrative cases to demonstrate that these PDSs generally resemble those observed during hard states of black hole candidates.
Considering that an axisymmetric shock fundamentally separates a flow into a fast moving (lower density) supersonic and a slow moving (higher density) sub-sonic regions, it should not be surprising that its oscillation frequency would lie at or near the break frequency. Of course, shocks are not infinitesimally thin. Neither it is true that the shocks exhibit only a single mode of oscillation. Thus a broad and often multiple peaks are expected. This is precisely what we see. What is more, since the inner sonic point also separates the flow into two parts, namely, the disk-like behaviour and the free-fall behavior, there is often a weak peak in the PDS at hundreds of Hz, perhaps corresponding to oscillation of this inner region. We shall demonstrate these as well. PDS of numerically simulated light curves also has a flat top up to a break frequency, and with an rms amplitude ranging of a few percent depending on the accretion rate of the flow.
In the next Section, we present the basic set-up of our numerical simulation. In Section 3, we present some results of the simulation for galactic and extra-galactic black holes and analyse them to demonstrate shock oscillations. From the PDS of the ‘simulated’ light curves, we show that QPOs are observed and the PDS has the familiar flat top shape with a break. Finally in Section 4, we draw our conclusions.
2 Setup for the Numerical Simulations
We are interested to simulate the behaviour of axisymmetric, inviscid flow in presence of cooling effects. We chose the specific angular momentum to be ‘low’, namely, somewhat smaller compared to the Keplerian value. The motivation for this stems from the fact that accretion processes into a black hole is necessarily transonic and the flow has to be sub-Keplerian near the horizon. Furthermore, the flow can have a substantial amount of sub-Keplerian matter itself because of accretion of winds. Recent observations do indicate presence of both the Keplerian and sub-Keplerian components (Smith, Heindl, and Swank, 2002).
We choose the specific angular momentum and energy of the injected flow in a way such that shocks may form in the flow (Chakrabarti, 1989; MSC96) although in the present circumstance, the shocks need not be standing and has a much wider parameter space (in the sense that the presence of two sonic points could be enough to produce these shocks as the fulfillment of the Rankine-Hugoniot relation is no longer a necessity). We use the Smoothed Particle Hydrodynamics (SPH) to do the simulations as in MSC96, but use both the halves of the flow to inject matter. The code has been tested for its accuracy against theoretical solutions already (MSC96) and we do not repeat them here. Needless to emphasize that the ‘pseudo’-particles have been chosen to be ‘toroidal’ in shape and they preserve angular momentum very accurately (Molteni, Ryu, and Chakrabarti, 1996). In the long run, energy would dissipate, but is found to be negligible compared to our main effect here, namely the bremsstrahlung loss. In MSC96, suggestion was made that the radial oscillations of the shock may take place when the infall time in the post-shock region is comparable to the cooling time scale. Presently, we concentrate on the solutions where such oscillations are present since our goal is to obtain PDS of the light curves and inspect if they exhibit QPOs.
For the injected parameters, we concentrate on both the supermassive black holes and the stellar mass black holes. Table 1 gives the model runs which we report here. There are basically two Groups of inputs. In Group A, we consider the black hole to be super-massive () and in Group B, we consider a stellar mass black hole (). Different Cases are run with the density of matter in c.g.s. unit at the outer boundary of the numerical grid (which is chosen to be ) as the parameter. In all the model-runs we choose the following parameters: the index in the polytropic relation ( is the isotropic pressure and is the gas density) is , the outer boundary , the specific angular momentum , injected radial velocity , the sound velocity and the vertical height at is . The vertical height is so chosen that the flow remains in hydrostatic equilibrium in the vertical direction at the point of injection . Here, we measure all the distances in units of the Schwarzschild radius of the black hole , all the velocities in units of the velocity of light and all the masses in units of , the mass of the black hole. Here and are the velocity of light and the gravitational constant respectively. It is to be noted that the marginally stable (lowest possible angular momentum with a stable Keplerian orbit) angular momentum is in this unit. We give the accretion rates () in units of the Eddington rate in the third column. In the fourth column, we give the average location of the shock and in the fifth column, the range of variation of the shock location is given. In the sixth column, we give the average number of ‘pseudo’-particles in each run and in the seventh column, the range in which the number varies is provided. In the last two columns we present the QPO frequency in Hz and the amplitude in percentage about which we shall discuss in the next section. As in MSC96, we choose the Paczyński-Wiita (1980) pseudo-Newtonian potential to describe the spacetime around the Schwarzschild black hole.
TABLE 1: Inputs and extracted parameters for the model runs
| Model | (gm/cc) | (Hz) | () | |||||
|---|---|---|---|---|---|---|---|---|
| A.1 | 0.95e-14 | 24 | 16 | 14-18 | 22250 | 4500 | 11.2 | |
| A.2 | 1.265e-14 | 32 | 13 | 11-15 | 19250 | 2500 | 11.2 | |
| A.3 | 3e-14 | 77 | 6 | 3-9 | 12875 | 750 | 11.2 | |
| A.4 | 5e-14 | 128 | 5 | 4.5-5.5 | 10500 | 400 | 3.3 | |
| B.1 | 3.6e-10 | 0.09 | 15.8 | 14.6-17 | 21950 | 700 | 3.5 | |
| B.2 | 4.5e-10 | 0.115 | 16.25 | 14.5-18 | 22050 | 900 | 4.0 | |
| B.3 | 4.5e-8 | 11.5 | 24 | 21-30 | 33500 | 5000 | 14.0 | |
| B.4 | 4.5e-7 | 115.0 | 5 | 4.6-5.4 | 10825 | 350 | 3.75 | |
In order to study the effect of cooling, we introduce the bremsstrahlung process. Thus the specific energy is not conserved. As we increase the density of the gas, the accretion rate increases and so does the cooling rate. The thermal pressure is thus decreased, especially in the post-shock region. One of the important conditions of a standing shock (formed due to the centrifugal force close to the black hole) is that the thermal pressure () plus ram pressure () should be continuous across the shock in the steady state. As the density is further increased in the post-shock region due to compression, the reduction of thermal pressure due to excessive cooling causes the shock to generally move closer to the black hole. In our time-dependent cases, we generally see this trend in Group A Cases (Table 1). Along with the shock location, there is a systematic decrease in frequency as well since the flow gets cooler and the time-scale of cooling is increased.
In Group B Cases, within our parameter range, occasionally there were stronger shocks which oscillated radially and the interaction between the outflow and the inflow also produces vertical oscillations. There were strong turbulences in the post-shock region which contributed to pushing the shock backward. As a result, the shock location was not seen to change monotonically with accretion rate. The location is clearly determined by several effects: centrifugal force, thermal pressure, ram pressure, energy loss, turbulent pressure etc.
In presence of Comptonization, the complexity is expected to be compounded since the cooling will depend on the soft photon supply (which may depend on the Keplerian rate and the location of the inner edge of the Keplerian disk). This will be dealt with in a future work. For reference we may add that the light crossing times of the horizon for the two classes of the black holes are s and s respectively. Since a steady shock may form anywhere between to , the QPO time-period may be close to to s for supermassive black holes, and close to s to s for stellar mass black holes. Since we chose the outer boundary of simulation to be at , the in-fall time is roughly . In order to trust the results of our simulations, we ran the code several hundred times of this timescale (typically or more). For a black hole of , this time corresponds to only s. Because we kept the accretion rate and the cooling type to be fixed for a given case, we reproduce only a single type of light curve, namely, that of the hard states which may contain QPOs.
3 Results
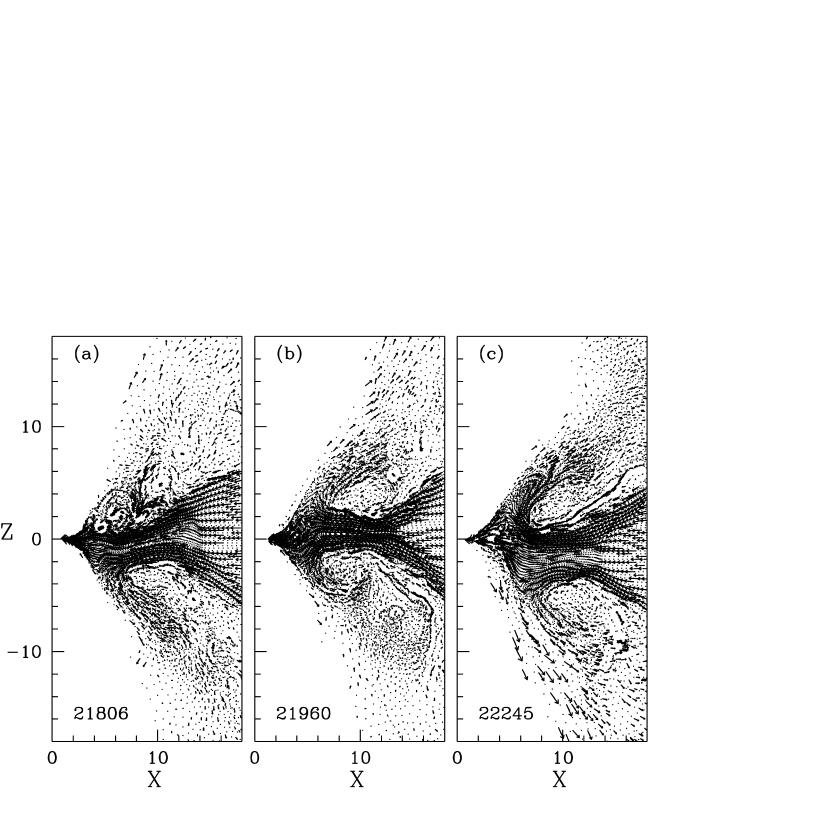
First we show examples of shocks with radial and/or vertical oscillations. Fig. 1(a-c) shows the locations of the SPH particles (dots) along with the velocity vectors (arrows) of every fifth particle for clarity. This case corresponds to the Case A.2. Matter distribution is shown at three different times (in units of ) illustrating the vertical and radial motions of the shock which oscillated between to Schwarzschild radii, mostly staying close to . Some matter could be seen bouncing back from the centrifugal barrier (empty region) near the axis and forming giant vortices which interact with the inflow. These vortices push the post-shock region () alternatively in the upper and in the lower halves.
In Fig. 2(a-d), we show the variation of the light curve in Cases A.1-A.4 (marked by a-d in the Figure). The light curves are the variations of the luminosity of bremsstrahlung radiation (in units of ) () with time (in seconds). As the density is increased, the average thermal energy gradually goes down due to the presence of enhanced cooling and thus the luminosity also goes down. The average location of the shock decreases (Table 1). The average number of pseudo-particles as well as the variation of the number of these particles also go down (Table 1). As a result, with the increase in accretion rates, the light curves are found to be less noisy, and the amplitude of fluctuation is found to be less.
In Fig. 3(a-d) we show the results of the Fast Fourier Transform of these light curves using FTOOLS provided by NASA, the same software package which is used to analyse observational results. We find remarkable result of familiar power density spectra (PDS) with a QPO near the break frequency. The QPO frequencies are presented in Table 1. We find that, perhaps due to the presence of both the vertical and radial oscillations, there are two QPOs; the frequency of the stronger one gradually increases with the accretion rate, while that of the weaker one gradually decreases. The occurance of QPO frequencies at or near the break frequency of the PDS can be understood by the following: According to our solution, QPOs occur due to oscillations of the shock waves which separate two ‘phases’ of the fluid — the preshock flow is supersonic and weakly radiating, while the post-shock flow is subsonic and strongly radiating. It appears that the former region of the flow produces the ‘flat-top’ region in the PDS, while the later region produces a PDS with a slope . The rms amplitude of the flat top region is shown in Table 1. It is generally similar at 11.2% except in (d) when it is only 3.3%.
In Fig. 4(a-d), we present similar results as in Fig. 2 for stellar mass black holes (Cases B.1 - B.4 of Table 1). Here too, the disk becomes cooler with increasing density and the nature of the light curve changes according to whether the shocks are strong or not. In Fig. 4(c), the parameters are such that a strong shock forms and it heats up the disk (accretion rate was not large to cool the post-shock region effectively), while for parameters in Fig. 4(d), a very weak shock forms. Shock oscillation produces a large amplitude noise in the B.3 Case (Fig. 4c). In Fig. 5(a-d), the PDS of these four Cases are shown. As in Figs. 3(a-d), here too QPOs are observed. For small black holes QPOs occur at a few Hz the QPO is located at or near the break frequency. Radial and vertical oscillations often produce multiple peaks in this Case as well. Other details could be seen in Table 1.
Occasionally, peaks at a very high frequency could be seen, but that is found to be transient. If the entire light curve is broken into smaller pieces, weak peaks at frequencies Hz could be seen, though they do not persist. One example of this is shown in Fig. 6(a) where the PDS of the average thermal energy up to is plotted for the Case B.4. In Fig. 6(b) and (c) we show the flow pattern at two times which are separated by only units (s). The shock located at shows two distinctly different shapes at these two times, bending up and down. Oscillation of a density enhancement at would have a time period of s, where , the compression ratio is for a weak shock. The corresponding frequency is Hz. The weak peak at Hz (Fig. 6a) may be due to this oscillation. Taking data for much longer time removes this weak peak. Since average thermal energy of the disk is a measure of Comptonized spectrum, we have taken the PDS of this quantity in Fig. 6a. The emitted luminosity is too noisy to show this property.
4 Discussion and conclusions
In earlier papers, such as in MSC95 and in Chakrabarti & Manickam (2000), we suggested that shock oscillations might contribute to observed QPOs. In this present work, using PDS of light-curve obtained from time dependent numerical simulations of sub-Keplerian flows, we convincingly demonstrated that the shock oscillations could truly be the cause of the QPOs in black hole candidates. We showed that the computed light-curve produces power density spectra with characteristic QPOs located at or near the break frequency which separates the flat-top type and power-law type PDSs. For stellar black holes, we not only reproduce QPOs at reasonable frequencies (Hz), but also find that very often high frequency QPOs (at around Hz) are produced. We demonstrated that this could be due to oscillation at the very inner edge where the flow becomes supersonic. For Active Galaxies and Quasars, oscillations at very low frequencies ( Hz) are expected since the time scales scale linearly with the mass of the black hole.
We have considered only bremsstrahlung effects for illustration purposes. We have verified that the average thermal energy of the disk, which is perhaps a measure of Comptonized hard X-ray luminosity in hard states, also exhibits oscillations at similar frequencies. Thus, we believe that the result could be relevant for the study of QPOs.
SKC thanks the support of Indian Space Research Organization for a RESPOND project. Discussions with Prof. A.R. Rao (TIFR) and Mr. A. Nandi (SNBNCBS) are also acknowledged.
References
- (1) Chakrabarti S.K. 1989, ApJ, 347, 365
- (2) Chakrabarti S.K. 1999, A&A 351, 185.
- (3) Chakrabarti S.K., & Manickam, S.G. 2000, ApJ 531, L41 (CM00)
- (4) Dhawan, V., Mirabel, I. F., & Rodriguez, L. F. 2000, ApJ 543 373
- (5) Molteni, D., Acharya, K., Kuznetsov, O., Bisikalo, D. & Chakrabarti, S. K. 2001, ApJL, 563, L57
- (6) Molteni, D., Sponholz, H., & Chakrabarti, S. K. 1996, ApJ, 457, 805
- (7) Molteni, D., Ryu, D., & Chakrabarti, S. K. 1996, ApJ, 470, 460
- (8) Paczyński, B. & Wiita, P.J., 1980, A&A, 88, 23
- (9) Langer, S.H., Chanmugam, G. & Shaviv, G., 1982, ApJ, 258, 289
- (10) Rao, A.R., Naik, S., Vadawale, S.V. & Chakrabarti, S.K. 2000, A&A 360, L25
- (11) Ryu, D., Chakrabarti, S.K. & Molteni, D. 1997, ApJ, 474, 378
- (12) Smith, D. M., Heindl, W. A., & Swank, J. H., 2002, ApJ, 569, 362