1]Sterrewacht Leiden, P.O. Box 9513, 2300 RA Leiden, The Netherlands 2]Space Research Organisation Netherlands, The Netherlands 3]Universidad Autónoma de Madrid, Spain 4]ESTEC Noordwijk, The Netherlands 5]MPA, Garching, Germany
Astrophysical imaging with the Darwin IR interferometer
Abstract
The proposed infrared space interferometry mission Darwin has two main aims: (i) to detect and characterize exo-planets similar to the Earth, and (ii) to carry out astrophysical imaging in the wavelength range 6 - 20 micron at a sensitivity similar to JWST, but at an angular resolution up to 100 times higher. In this contribution we will first briefly discuss the imaging performance of the Darwin mission. We will then discuss how Darwin will contribute in a very significant way to our understanding of the formation and evolution of planets, stars, galaxies, and super-massive black-holes located at the centers of galaxies.
keywords:
instrumentation: interferometers; infrared: general; stars: formation; galaxies: active; galaxies: evolution1 Introduction
The main focus of this conference is to discuss the wonderful recent results on planets orbiting other stars and the prospects of the Darwin and TPF missions for detecting and characterizing planets with properties similar to our beloved Earth. For a long list of reasons, detecting and studying exo-earth’s is technically very challenging. Let us consider an exo-earth in the habitable zone of a G-type star at a distance of 10 pc. It will be very dim: in the IR, it will have a flux density of 0.34 Jy (Beichman et al. 1999), and in the optical magnitude of . Furthermore, it will be located at a close angular separation of 100 mas from the parent star. To be able to detect and study such earth-like planets very sensitive observations at high angular resolution are clearly needed. An instrument that is capable of delivering such exquisite measurements will be able to also do very important observations for general astrophysics. In this contribution we will concentrate on the promise of Darwin for such studies. In the wavelength region around 10 micron, Darwin will have a similar sensitivity to JWST, but with an angular resolution a factor of larger.
The Darwin mission was an integral part of ESA’s Horizon 2000+ programme and was designed from the beginning with these two goals in mind. The proposal by Léger et al. (1996) to build Darwin originated from a time before the first exo-planet was discovered. With more than 100 planets now discovered, the landscape of this field has changed dramatically, making it even more clear that a machine that can study exo-earth’s is needed. Also for “normal” astrophysics the scene has changed significantly, mainly due to the advent of 10-m class optical/near IR telescopes and X-ray and infrared satellites.
There are a number of very good reasons to have a Darwin mission with astrophysical observations as one of its key drivers. First, it is a logical next step after a long series of IR missions (IRAS, ISO, SIRTF and JWST). The angular resolution that will be needed as a follow-up of sources studied by SIRTF and JWST can not naturally be obained with a single dish telescope, but will require interferometry. Second, an important argument is that of “cost effectiveness”: the Darwin mission will be very expensive, and if it can do “two missions at (more or less) the price of one”, this will be very valuable. Third, there is the argument of redundancy. The whole mission will be very challenging, and having more than one goal will help reducing the scientific and technical risk of the entire mission.
In this presentation, we will first discuss the performance of the Darwin imaging mission. Subsequently we will briefly describe the research into three areas of astrophysics (star formation, galaxy formation and evolution, and active galactic nuclei) that Darwin will contribute to in a major way.
2 Imaging considerations
2.1 Sensitivity
The proposed configuration for Darwin consists of 6 telescopes each with a diameter of 1.5 m and a central beam-combiner. The relevant systems at the telescopes and beam-combiner will be passively cooled to 40 K, so that the sensitivity will be limited by shot-noise from emission by the zodiacal background (Fridlund et al. 2001, Nakajima and Matshura 2001). This system should be a able to detect a point source of 2.5 Jy with a signal to noise of 5 in one hour of integration time. For sources that are more complex, assessing the integration time depends on the details of the morphologies. A simple rule of thumb that is used in the radio astronomical community, is that an object can be imaged in a certain integration time provided that the total signal within the primary field of view is larger by about a factor than the expected off-axis rms noise in the final map. For Darwin the point-spread function (PSF) for a single telescope is 1.4 arc-sec at 10 micron. This is the maximum field of view (FOV) if the beam combination is done in the pupil-plane. The image requirements for Darwin therefore are that a source can be “mapped” with an integration of one hour, provided that the total flux within arc-sec is more than Jy.
2.2 Resolution and filling of the UV plane
The maximum baselines that are foreseen are about 500 meter, which translates into a maximum resolution of 4 mas at 10 micron. This is a factor of more than 100 higher than the nominal resolution at 10 micron of 350 mas of the 6.4 m mirror of JWST. Let us consider an experiment with baselines of up to 150 meters. With the resulting resolution and the FOV as determined by the PSF’s of the individual telescopes, a final map will contain up to individual pixels. This number of pixels is directly set by the ratio of length of the maximum baseline to the size of the FOV. For mapping very complex objects it is essential that the number of visibilities that are measured in the UV plane is significantly greater than the number of parameters that is needed to describe the image. Furthermore, these visibility measurements should be well distributed over the UV plane. This means that in the case that our complex object occupies a significant fraction of the 1002 pixels, also on the order of 1002 visibility measurements will be needed.
Per Darwin configuration, a maximum of 15 independent visibility points can be obtained. This immediately indicates that a 1002 map would need visibility measurements from 666 different configurations. This is not such a severe requirement if we take a closer look at the dynamics of the configuration. For a more detailed discussion, see d’Arcio et al. 2003. A basic approach to filling up the UV plane might be a single expansion coupled with a 60 degree rotation For the resulting UV-plane coverage, see Fig. 1. With the planned thrusters delivering 1 mN, the fastest reconfiguration cycle takes about 16 hours. The average baseline rate will be about 1.5 cm s-1. The maximum integration time for a single UV point is then set by the requirement that each UV point should not be significantly blurred by the movement of the array. For a telescope of 1.5 meter a movement of 15 cm in the UV plane is certainly tolerable, indicating maximum individual integration times of about 10 seconds. This would yield 15 * 16 hours * 3600 sec / 10 sec = 86400 different UV samples, far more than our simple required minimum of 666 samples needed for complex maps.

Interestingly, this leads to the conclusion that the free flying telescopes allow for much “easier” filling of the UV plane than is possible with fixed ground based telescopes. Furthermore, the number of UV points needed is modest compared to conventional radio synthesis telescopes. For example, for the VLA the ratio of maximum baseline size over the size of the individual apertures is 27 km/25 m = 1000, a factor of 10 more than Darwin. For very large baseline interferometry with radio telescopes scattered all over the globe, the ratio is many orders of magnitude worse.
2.3 Co-phasing
While the telescopes are moving it is essential that the system is able to integrate to obtain the desired visibility measurements. Note that since the aim is to perform imaging, both the amplitude and the phase of the visibilities need to be measured. To be able to do this, the array needs to remain co-phased while moving. In general, the science targets are too faint to give enough signal for co-phasing. Instead the light from an off-axis bright reference star is used. A system based on such a principle is currently being implemented at the VLTI under the name PRIMA, which stands for Phase-Referenced Imaging and Microarcsecond Astrometry. For a detailed description of this instrument we refer to the contribution of Quirrenbach to these proceedings.
d’Arcio et al. 2003 discussed the various options for implementing off-axis referencing. An important design choice is related to how to multiplex the science and reference beam. Sending those two beams along two different path is complicated: it requires relatively large optics and the calibration of the differential path lengths is arduous. Sending the two beams along a common path is therefore clearly preferred. Multiplexing the beams can in principle be done using polarization or splitting up into time sequences. However, multiplexing in wavelengths seems simplest and has therefore been selected by the Alcatel study (Fridlund et al. 2000). Within such a scheme the -band is used for fringe-tracking. At the expected limiting magnitude for fringe tracking of mk=17, almost 100 % of the sky should be observable, provided that the angular distance of the science target and the reference star is allowed to be maximally 1.5 arcminute. An issue is cross talk between the science and reference channels, especially at the shorter science-wavelengths. d’Arcio et al. (2003) showed that levels of a few per cent cross-talk can be tolerable and this is probably achievable with a proper design.
The implementation of such a scheme studied by Alcatel involved modifying the nulling beam combiner. This however, strongly reduces the sensitivity, potentially by a factor of about (d’Arcio et al. 2003). For imaging it would therefore clearly be advantageous to have a separate beamcombiner.
2.4 Extending the field of view
In the case of pupil-plane combination, the field of view of Darwin will be small, of the order of 1 arc-sec. Mapping a larger field of view can always be done through a mosaic of different pointings. This is of course very expensive in time. A natural way of enlarging the field of view is to combine the beams in the image plane. This is somewhat complex since the pupils need to be remapped at the beam-combiner with the correct demagnification and relative distances. Furthermore, the required optics are large in size. An interesting idea, which potentially simplifies the design is to have zoom optics installed at the telescopes, so that at the level of the beam-combiner, the pupils do not need to be reconfigured. In the implementation of such a design that d’Arcio and le Poole discuss in these proceedings, a 4k*4k detector would yield a variable field of view, ranging from 25 arcsec for baselines of 50 m down to 2.5 arcsec for baselines of 500 m.
3 Science with Darwin
3.1 Diagnostics
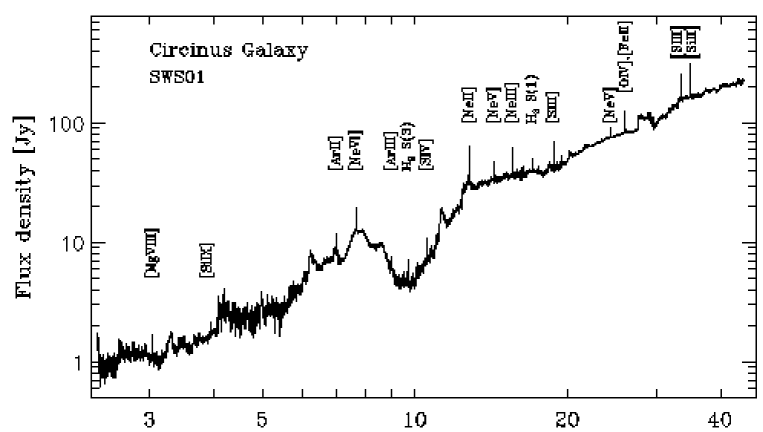
The wavelength region between 5 and 20 micron is very rich in diagnostics for a number of species, including molecules, ions, dust and late type stars (e.g. van Dishoeck 2000). As a nice illustration of this richness, we show in Fig. 2 the infrared spectrum of the famous starburst galaxy Circinus as observed by ISO from Moorwood et al. (1996).
For molecules, rotational and vibrational lines can be observed and for ions, forbidden fine-structure lines. Combined, these can be used to map out the temperature, density, and metallicity, kinematics of gas at intermediate to cold temperatures ( K) and moderate densities cm-3. In this wavelength regime the continuum is often due to emission from dust and Polycyclic Aromatic Hydrocarbon (PAH) molecules. Studying the precise form of the continuum reveals information about the composition and temperature structure of the various dust and PAH components. The spectral energy distribution of a normal nearby galaxy peaks at a rest-frame wavelength of a few microns. For galaxies at high redshifts, this peak shifts to observed wavelengths of microns. High resolution sensitive measurements at microns are therefore very important for understanding the formation and evolution of high redshift galaxies.
4 Star formation
Based on a wealth of observations a sketch of a scenario showing how (isolated low-mass) stars form seems to be in place (Shu et al. 1987). Also the suggested classification scheme for the various evolutionary stages seems commonly accepted. The formation of a star commences with the growth of condensations in molecular clouds. When the density of a condensation reaches a critical value, a collapse sets in, on a time scale likely to be governed by the local sound speed. Subsequently, a protostar surrounded by an accretion disk forms, both deeply embedded within an envelope of infalling dust and gas. A striking phenomenon during this phase is the occurrence of bipolar outflows. Gradually, the inflowing matter will fall more and more onto the disk rather than the star. Within the final stage, the disk might be fully dispersed, for example by an energetic outflow. Alternatively, the disk material might (partially) coagulate and form one or more planets.
Within the vast range of physical conditions that occur during star formation, the high resolution imaging provided by Darwin will map the density, temperature, metallicity and dynamics of young stellar objects. This is particular relevant for studies of the core inflow, the accretion disks, the location of the jet outflow and planet formation. For example, it is not well understood how the jet outflow originates from the accretion disk. How does this start? What keeps the jet stable? Mapping out the structure of the disc will be very important for constraining models of planet formation.
For a first impression of how many sources are available for detailed study with Darwin, we have made a compilation of various ISOCAM surveys at 6.7 and 14.3 micron down to a completeness limit of mJy of three starforming regions (Persi et al. 2000, Bontemps et al. 2001, Kaas, priv. comm.). In Table 1, we give for each of these regions their names, the estimated age of the systems, their distance and the total area surveyed. Furthermore, the total number of sources detected both at 6.6 and 14.3 micron is given and, if possible, the number of sources in each of the star formation classes I, II and III. This classification is done on the basis of the 6.7 and 14.3 colour indices. For more details see Bontemps et al. 2001.
| Region | Chameleon | Ophiucus | Serpens |
|---|---|---|---|
| Age (Myr) | 5 | 0.2-3 | 0.1 |
| Distance (pc) | 160 | 160 | 260 |
| Observed Size | 0.57 | 0.7 | 0.13 |
| (deg. sq.) | |||
| N(6.6 + 14.3) | 103 | 211 | 124 |
| N(Class I) | 16 | 19 | |
| N(Class II) | 46 | 123 | 44 |
| N(Class III) | 19 | 77 | 9 |
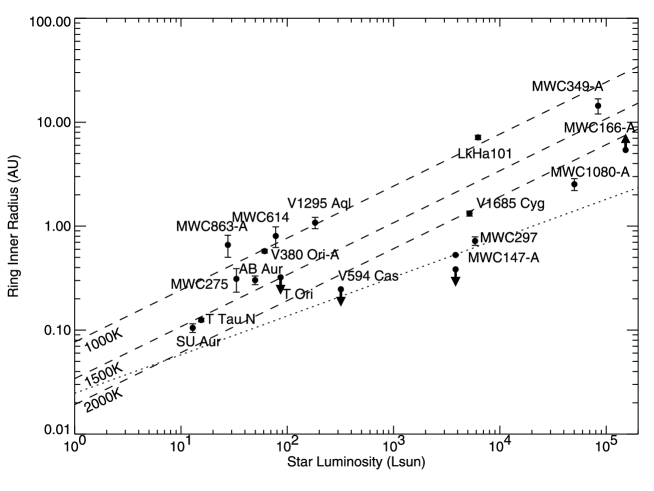
To investigate whether these sources have the appropriate angular scale for observations with Darwin, we use as a starting point the work of Monnier and Millan-Gabet (2002). They have compiled scale sizes at 1.6 and/or 2.2 m for the circumstellar disks around young stellar objects (YSOs), mainly Herbig Ae/Be and T Tauri stars. They find that the inner radii of the disks range from 0.1 AU up to 10 AU and appear to be correlated with the luminosity of the star (see Fig. 3). If we now apply this rough correlation between luminosity and size to the Class II sources as presented in Tabel 1., we find that the majority of these sources have estimated angular sizes between 10 and 500 mas. An alternative way to estimate characteristic angular sizes for such objects is to use models of proto-planetary disks. A family of such models have been developed by D’Alessio et al. (2001). These models solve the radiative transfer through a viscous dusty disk heated by the central region. The resulting synthetic SEDs can then be compared to observed SEDs. Merín et al. (these proceedings) used these models to predict angular size scales for proto-planetary disks and find angular size scales in the range of ten to a few hundred mas, consistent with the observationally based estimate for the sources presented in Table 1.
From these two estimates it is clear that a proper population study requires the sensitivity and angular resolution of the Darwin mission.
5 Active galaxies
Active galaxies are among the most spectacular objects in the sky. Their compact nuclei can be so luminous that they can outshine an entire galaxy. These objects show many interesting observational characteristics (e.g. radio lobes, jets, narrow and broad emission lines, polarized light, X-ray continuum and line emission, see reviews by Antonucci 1993 and Urry and Padovani 1995). The relative importance of these observational characteristics varies dramatically from object to object, and a complicated phenomenological scheme has emerged to classify objects into many different types of AGN, including Sey1, Sey2, QSOs, QSRs, BLACs, radio galaxies, etc. A major issue in this field is how to understand all these different characterics on the basis of the fundamental physical and geometrical properties of the inner heart of the AGN. Orientation is an important factor in determining the appearance of an individual object. Furthermore, the characteristics of the central massive black hole (including total mass and spin) are likely to be directly related to the total output of the AGN and the presence of well defined jets. And finally, over the lifetime of the AGN activity its appearance can change dramatically (for example radio sources can grow up to a few Mpc, starting at the pc scale). This evolution of AGNs is also evident in the fact that at a redshift of bright AGNs are 1000 times more frequent than today. Although it is clear that this indicates a close link between the formation of galaxies and the AGN phenomenon the reason for the existence of this AGN epoch is not understood. More direct evidence for this link between AGNs and galaxy formation is provided by the relationship between galaxy and massive black hole mass, increasing the significance of AGNs for the overall understanding of galaxy formation.
In the currently popular and attractive “unified” model of active galactic nuclei, all AGNs contain the following components: A central black hole fed by an accretion disk, which is surrounded by an optically thick obscuring torus and broad and narrow line regions. The orientation with respect to the line of sight determines whether the object is observed to have broad emission lines, originating from within the hot central hole of the torus, or whether the torus blocks this region from view, leaving only the unobscured narrow line region visible.
Although this picture is capable of explaining a large number of the differences between the various classes of AGN (e.g. Antonucci 1993, Urry & Padovani 1995), it is still a vigorous debate whether other mechanisms contribute to, or even dominate over, the scenario in which orientation and a putative torus play such a major role. It has even been argued that in a subset of AGNs, the main power-source is not the black-hole but supernova explosions produced within a central starburst region. It is not clear, however, if all AGNs have starburst regions, whether all starburst galaxies contain AGNs nor what the causal relation is between these two phenomena.
An important issues in understanding AGN unification are therefore whether dust tori exist and whether the physics/geometry of such tori can be constrained well enough for many of the differences between AGNs to be understood.
A number of radiative transfer models for obscuring tori models have been proposed (e.g. Krolik and Begelman 1988; Pier and Krolik 1992; Efstathiou and Rowin-Robinson 1995; Granato et al. 1997; Manske et al. 1998; Wolf and Henning 1999). Within these models the radiative transfer through a torus with a given geometry, optical depth and dust grain composition is calculated. The model subsequently gives the emerging IR spectrum and the morphology as a function of wavelengths.
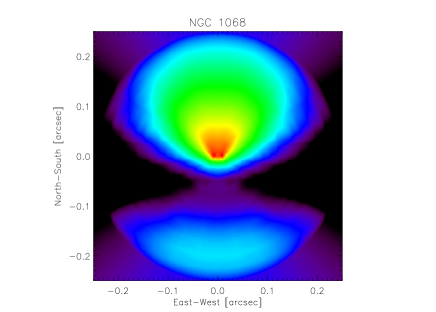
It is very clear that Darwin will be able to map nearby tori in exquisite detail. Recently the famous Seyfert 2 galaxy NGC 1068 was observed at the VLT interferometer using the 10 micron MIDI instrument (see ESO press release 17/03 at http://www.eso.org/outreach/press-rel/pr-2003/pr-17-03.html). This first detection of fringes of an extragalactic object is an important step for optical interferometry. The plan is that during 2003 of the order of visibility points will be measured. This will give important constraints on the general shape of the NGC 1068 torus. However, compared to VLTI, Darwin will be a dramatic step forward. The number of visibilities that will be obtained will be 3 orders of magnitude higher, with a fairly uniform filling of the UV-plane out to 500 meter. This will be very important to map in detail substructure, warps, and dynamics of nearby tori.
An interesting question is to what distance tori of AGN can be mapped. To investigate this, we will use the torus models of Granato et al. 1997. In these models, the inner radii of these tori, , are set by the distance from the central source at which the dust grains sublimate due to the strong nuclear radiation. This radius is larger for more luminous AGN. For the models of Granato et al., pc, where is the luminosity of the central optical UV emitter in units of ergs s-1. As a scale size of the torus D we will use 300 . In Figure 5, the diameter D and the 10 micron luminosity (which are directly coupled) are given as a function of for angular scales of 1, 0.1 and 0.01 arcsec. The dotted lines correspond to the 10 micron luminosities as a function of for 10 micron flux densities of 5 and 50 Jy.

A relatively weak AGN such as NGC 1068 has a 10 micron luminosity of the order of erg s-1 Hz-1 and its modelled torus size is 60 pc. Up to redshifts of such weak AGN are brighter than the nominal sensitivity for a one hour imaging observation (see Section 2.) of Jy. Also the nominal resolution at 10 micron of 20 mas is very adequate for imaging the tori at these redshifts. Brighter AGN can basically be mapped up to redshift of (if they exist).
This shows that Darwin can not only study the physics of dusty tori in our local universe, but also at large redshifts. This will give the unique opportunity to investigate how the properties of tori change with redshift and when and how these tori and their associated massive black-holes are built up at an epoch when galaxies are forming.
6 Galaxy formation and Evolution
With the advent of 10-m telescopes, it is now possible to define and study large samples of very distant galaxies. This work has been pioneered by Steidel and coworkers. Using the “Lyman break technique”, they have defined a sample containing of order a 1000 galaxies between (e.g. Steidel et al. 1999). Other techniques to obtain samples of very distant galaxies are to carry out deep imaging using narrow band filters to find Ly and H emitting galaxies (e.g. Venemans et al. 2002; Kurk 2003) or preselect on very red colours (Franx et al. 2003). Also direct spectroscopic follow-up of SCUBA galaxies (e.g. Chapman et al. 2003), radio galaxies (e.g. de Breuck et al. 2001) and X-ray emitters (e.g. Rosati et al. 2002) can yield significant samples of objects.
This amazing observational progress of the last 10 years has been accompanied by a large body of work to build reliable and robust models of galaxy formation. The goal is to model the evolution of galaxies with, as the main input, the physical conditions as they existed in the very early universe. For a thorough account we refer to a few of the excellent articles and reviews that have been written (see for example: Rees and Ostriker 1997; White and Rees 1978; White and Frenk 1991; Cole 1991; Lacey and Silk 1991; Kauffmann et al. 1993; Lacey et al. 1993; Cole et al. 1994; Kauffman et al. 1994; Somerville et al. 2001; Moustakas and Sommerville 2002; Bell et al. 2003)

Virtually all of the current models assume that the dynamics of the large scale mass distribution in the early universe is driven by the gravity exerted by some form of dark matter. At early times the density fluctuations within this medium are modelled by a described distribution whose functional form depends on the physics in the early universe, the nature of the dark matter and a suitable choice of cosmological parameters. The evolution of the dark matter distribution can be studied analytically or with the help of N-body simulations. A second step is to include the baryonic gas and to follow its hydrodynamic evolution. Gas dynamics, shocks and radiative heating and cooling all need to be part of the simulation to obtain a realistic multi-phase medium. The outcome of this kind of simulation is that a significant fraction of the gas cools and settles at the centers of dark matter halos. It is from that gas that the stars that will make up future galaxies will form. Often it is then simply assumed that the rate at which the gas at the center of these halos forms stars is proportional to the total amount of gas present and inversely proportional to the dynamical timescale within the dark matter halo. The rate with which these proto-galaxies forms stars is limited due to both supernovae and stellar winds which blow gas out of the centers of these halos. The merging of galaxies greatly enhances the combined star formation rate of both galaxies, possibly to a rate at which a very large fraction of the gas is transformed into stars within a few dynamical timescales. Finally, the combination of the inferred star formation rate, an assumed initial mass function and the spectral evolution of individual stars will then give the evolution of the integrated spectra of an individual galaxy. With this kind of modelling gross properties of the general galaxy population can be calculated. These properties include the luminosity function of galaxies, the redshift distribution, the relative numbers of ellipticals and spirals, faint galaxy counts, the history of star formation. Also more detailed properties like the size distribution, and the Tully-Fisher relation can be predicted with a fair accuracy.
What role can Darwin in this area? Maybe it is important to realise that even 10 years from now the issue of how galaxies form will still be one of the most important topics within the field of astronomy. Or to quote Rees (1998), who states that in 10 years from now, “we will probably still be unable to compute crucial things like the star formation efficiency, feedback from supernovae. etc – processes that current models for galactic evolution are forced to parametrise in a rather ad hoc way”.
An essential constraint on these galaxy formation models will be the spatial structure of very distant galaxies at micron restframe, the location of the peak of the spectral energy distribution of nearby galaxies. For galaxies, this region is redshifted into the spectral window within which Darwin will be observing.
A crucial question is whether there are sufficient number of distant galaxies on the sky with appropriate angular sizes for Darwin to observe. To investigate this we will use results from the Faint InfraRed Extragalactic Survey (FIRES, Franx et al. 2000), which is a very deep infrared survey centered on the Hubble Deep Field South using the ISAAC instrument mounted on the VLT (Moorwood 1997). With integration times of more than 33 hours for each of the infrared bands , and , limiting AB magnitudes of 26.0, 24.9, and 24.5 respectivily are reached (Labbé et al. 2003). A major advantage of observing this field is that multicolour HST photometry is available.
Using the multi color data, we estimate the distance of the objects using the photometric redshift technique. This technique uses a fit to the observed SED with a linear combination of galaxy templates. The procedure is described in detail in Rudnick et al. 2001. and 2003. An example of fits that are obtained is given in Fig. 6. The galaxies shown are a mixture of red J-K galaxies and Lyman Break galaxies all at a photometric redshift of . For further details, we refer to Labbé et al. 2003.
For these high redshifts, the reddest observed colour, -band, samples only the rest-frame -band. To sample the SED in the restframe -band observations at the Darwin wavelength range are essential. This is important so that a complete census of the stellar population in these distant galaxies can be obtained, not biased due to dust obscuration or short bursts of massive star formation. To estimate the observed 10 micron flux densities, we used the fits to the HST and FIRES photometry. In Fig. 7 we show the results from a sample with and . The -band selection was chosen such the the photometric redshifts are fairly reliable (see Labbé et al. 2003 for details). The lower limit to the photometric redshift was chosen so that, at an observed wavelength of 10 micron, the SED is still dominated by stellar light and not by a hot dust component. From Fig 7, we conclude that, for the brighter objects, it is possible to obtain good images with signal to noise ratios of 50 within integration times of 25 - 50 hours (see Section 2.).

The second important issue is related to the angular size scales of these FIRES objects. In Fig. 8, we plot the effective radius of the objects in FIRES sample versus redshift. The overall trend is that the angular sizes tend to decrease with redshift. Careful modelling of the various selection effects involved shows that the physical sizes of luminous galaxies () at are 3 times smaller than that of equally luminous galaxies today (Trujillo et al. 2003). The size distribution shows that twice the median effective radius is similar to the resolution (FWHM) of the JWST or in other words, JWST will hardly resolve these distant galaxies. It is clear that for a good study of the morphology of especially the older stellar population, Darwin will be very important.

In Röttgering et al. 2000 we have used the models of Devriendt and Guiderdoni (2000) to discuss Darwin’s ability to detect and study distant galaxies. It was appropriate to use these models since they include the extinction and emission of dust and as such the models correctly fit the ISO 15 m source counts. Although a detailed comparison between these models and the FIRES data just presented is in progress, the predicted redshift and angular size distributions also lead to the conclusion that the flux densities and angular sizes are well in the range of Darwin’s capabilities.
7 Conclusion
The scientific potential of the Darwin mission for general astrophysical imaging is tremendous. With the present performance of Jy sensitivity and tens of mas angular resolution, it will allow for detailed studies addressing a number of crucial questions related to the formation and evolution of planets, stars, AGN and galaxies.
Acknowledgments
I would like to acknowledge the pleasant discussions and important input from a number of colleagues including Bruno Guiderdoni, Ewine van Dishoeck, Malcolm Fridlund, Emanuele Daddi, GianLuigi Granato, Marijn Franx, Bjorn Heijligers, Klaus Meisenheimer, Rudolf Le Poole and Jan Willem den Herder.
References
- Antonucci (1993) Antonucci R., 1993, ARA&A, 31, 473
- Beichman et al. (1999) Beichman C.A., Woolf N.J., Lindensmith C.A. (eds.), 1999, Terrestrial Planet Finder, Origin of Stars, Planets and Life, Jet Propulsion Laboratory
- Bell et al. (2003) Bell E.F., Baugh C.M., Cole S., Frenk C.S., Lacey C.G., Mar. 2003, ArXiv Astrophysics e-prints
- Bontemps et al. (2001) Bontemps S., André P., Kaas A.A., et al., Jun. 2001, A&A, 372, 173
- Chapman et al. (2003) Chapman S.C., Blain A.W., Ivison R.J., Smail I.R., Apr. 2003, Nature, 422, 695
- Cole (1991) Cole S., Jan. 1991, ApJ, 367, 45
- Cole et al. (1994) Cole S., Aragon-Salamanca A., Frenk C.S., Navarro J.F., Zepf S.E., Dec. 1994, MNRAS, 271, 781
- D’Alessio et al. (2001) D’Alessio P., Calvet N., Hartmann L., May 2001, ApJ, 553, 321
- D’Arcio et al. (2003) D’Arcio L., den Herder J., Le Poole R.S., Röttgering H.J.A., Feb. 2003, In: Interferometry in Space. Edited by Shao, Michael. Proceedings of the SPIE, Volume 4852, pp. 184-195 (2003)., 184–195
- De Breuck et al. (2000) De Breuck C., Röttgering H., Miley G., van Breugel W., Best P., Oct. 2000, A&A, 362, 519
- Devriendt & Guiderdoni (2000) Devriendt J.E.G., Guiderdoni B., Nov. 2000, A&A, 363, 851
- Efstathiou & Rowan-Robinson (1995) Efstathiou A., Rowan-Robinson M., Apr. 1995, MNRAS, 273, 649
- Franx et al. (2000) Franx M., Moorwood A., Rix H., et al., 2000, The Messenger, 99, 20
- Franx et al. (2003) Franx M., Labbé I., Rudnick G., et al., Apr. 2003, ApJ, 587, L79
- Fridlund et al. (2000) Fridlund M., et al. M., 2000, Darwin, the Infrared Space Interferometer, Concepts and Feasibility Study Report, ESA report ESA-SCI, 2000, 12
- Granato et al. (1997) Granato G., Danese L., Franceschini A., Sep. 1997, ApJ, 486, 147
- Kauffmann et al. (1993) Kauffmann G., White S.D.M., Guiderdoni B., Sep. 1993, MNRAS, 264, 201
- Kauffmann et al. (1994) Kauffmann G., Guiderdoni B., White S.D.M., Apr. 1994, MNRAS, 267, 981
- Krolik & Begelman (1988) Krolik J.H., Begelman M.C., Jun. 1988, ApJ, 329, 702
- Kurk (2003) Kurk J., 2003, The Cluster Environment and Gaseous Halos of Distant Radio Galaxies, Ph.D. thesis, , Univ. Leiden, (2003)
- Labbé et al. (2003) Labbé I., Franx M., Rudnick G., et al., Mar. 2003, AJ, 125, 1107
- Lacey & Silk (1991) Lacey C., Silk J., Nov. 1991, ApJ, 381, 14
- Lacey et al. (1993) Lacey C., Guiderdoni B., Rocca-Volmerange B., Silk J., Jan. 1993, ApJ, 402, 15
- Leger et al. (1996) Leger A., Mariotti J.M., Mennesson B., et al., Oct. 1996, Icarus, 123, 249
- Manske et al. (1998) Manske V., Henning T., Men’shchikov A.B., Mar. 1998, A&A, 331, 52
- Monnier & Millan-Gabet (2002) Monnier J.D., Millan-Gabet R., Nov. 2002, ApJ, 579, 694
- Moorwood (1997) Moorwood A.F., Mar. 1997, In: Proc. SPIE Vol. 2871, p. 1146-1151, Optical Telescopes of Today and Tomorrow, Arne L. Ardeberg; Ed., 1146–1151
- Moustakas & Somerville (2002) Moustakas L.A., Somerville R.S., Sep. 2002, ApJ, 577, 1
- Nakajima & Matsuhara (2001) Nakajima T., Matsuhara H., Feb. 2001, Appl. Opt., 40, 514
- Persi et al. (2000) Persi P., Marenzi A.R., Olofsson G., et al., May 2000, A&A, 357, 219
- Pier & Krolik (1992) Pier E.A., Krolik J.H., Dec. 1992, ApJ, 401, 99
- Rees (1998) Rees M.J., 1998, Introductory talk at ngst conference, liege, june 1998
- Rees & Ostriker (1977) Rees M.J., Ostriker J.P., Jun. 1977, MNRAS, 179, 541
- Rosati et al. (2002) Rosati P., Tozzi P., Giacconi R., et al., Feb. 2002, ApJ, 566, 667
- Röttgering et al. (2000) Röttgering H., Granato G., Guiderdoni B., Rudnick G., 2000, In: Lena P.J., Quirrenbach A. (eds.) Proceedings of the SPIE conference Interferometry in Optical Astronomy, Vol. 4006, 742
- Rudnick et al. (2001) Rudnick G., Franx M., Rix H., et al., Nov. 2001, AJ, 122, 2205
- Rudnick et al. (2003) Rudnick G., Rix H., Franx M., et al., Jul. 2003, ArXiv Astrophysics e-prints
- Shu et al. (1987) Shu F.H., Adams F.C., Lizano S., 1987, ARA&A, 25, 23
- Somerville et al. (2001) Somerville R.S., Primack J.R., Faber S.M., Jan. 2001, MNRAS, 320, 504
- Steidel et al. (1999) Steidel C.C., Adelberger K.L., Giavalisco M., Dickinson M., Pettini M., Jul. 1999, ApJ, 519, 1
- Trujillo et al. (2003) Trujillo I., Rudnick G., Rix H., et al., Jul. 2003, ArXiv Astrophysics e-prints
- Urry & Padovani (1995) Urry C.M., Padovani P., Sep. 1995, PASP, 107, 803
- van Dishoeck (2000) van Dishoeck E.F., 2000, In: ASP Conf. Ser. 207: Next Generation Space Telescope Science and Technology, 85
- Venemans et al. (2002) Venemans B.P., Kurk J.D., Miley G.K., et al., Apr. 2002, ApJ, 569, L11
- White & Frenk (1991) White S.D.M., Frenk C.S., Sep. 1991, ApJ, 379, 52
- White & Rees (1978) White S.D.M., Rees M.J., May 1978, MNRAS, 183, 341
- Wolf & Henning (1999) Wolf S., Henning T., Jan. 1999, A&A, 341, 675