Gamma-Ray Line Observations with RHESSI
Abstract
The Reuven Ramaty High Energy Solar Spectroscopic Imager (RHESSI) has been observing gamma-ray lines from the Sun and the Galaxy since its launch in February 2002. Here I summarize the status of RHESSI observations of solar lines (nuclear de-excitation, neutron capture, and positron annihilation), the lines of 26Al and 60Fe from the inner Galaxy, and the search for positron annihilation in novae.
keywords:
gamma rays; spectroscopy; nucleosynthesis; RHESSI1 Introduction
The Reuven Ramaty High Energy Solar Spectroscopic Imager (RHESSI), which was launched on February 5, 2002, is part of NASA’s Small Explorer series of satellites (Lin et al., 2002). RHESSI was designed to perform imaging and spectroscopy of solar flares in the hard x-ray and gamma-ray range, with both spatial and spectral resolution far superior to previous missions. It uses Rotating Modulation Collimators (RMCs) for solar imaging down to 2.3”(Hurford et al., 2002). Its nine coaxial germanium detectors cover the range from 3 keV to 17 MeV with extremely good energy resolution ( around 400 from 1–2 MeV) (Smith et al., 2002). The detectors are in the rear of the spacecraft; the spacecraft bus is wrapped around the central tube that contains the optical axis. Each detector is segmented into a thin front segment, which records the copious hard x-ray photons from a solar flare, and a thick rear segment built to observe solar gamma-rays at higher energies that penetrate the front segment.
Only RHESSI’s coarsest grids are thick enough to effectively modulate gamma rays above 1 MeV. Imaging is therefore limited to 35” at the 2.223 MeV line from neutron capture in solar flares, and to 3’ for the 4 and 6 MeV lines from carbon and oxygen de-excitation. Solar spectroscopy can be performed across the entire energy range of the detectors, subject to the limitations of photon statistics at gamma-ray energies.
Because these detectors have no shielding, and because the spacecraft is very light, the RHESSI detectors can also see emission at gamma-ray energies from any direction in the sky. For photons on the order of 1 MeV or higher, in fact, the instrument’s effective area (about 29 cm2 at 1809 keV) has little dependence on the direction of incidence, with the exception of a 30% depression at near-solar angles due to the effects of the grids, absorption in the front segments, and opacity of parts of the spacecraft bus. Since RHESSI is in low-Earth orbit, the spectrum of emission from any given point in space can be derived by using the Earth as an occulter, subtracting blocked from unblocked data to determine background, if the source in question is the dominant source in the sky at the wavelength (and during the time period) under consideration.
2 Solar Flare Observations
Observations of gamma-ray lines due to nuclear interactions in flares can help discriminate among models of ion acceleration. The data and the models meet in the intermediate terrain of the energy spectra, composition, location, and directivity of the accelerated ions: the gamma rays can be used to deduce these distributions and the models make varied predictions.
Much has been learned from these lines using scintillation detectors with moderate energy resolution, notably the Gamma-Ray Spectrometer on the Solar Maximum Mission (Share & Murphy, 1997, e.g.). With the advent of RHESSI, gamma rays in flares have been imaged with a spatial resolution comparable to the size of the emitting regions, and their spectra have been observed with high energy resolution for the first time (a feat that has now also been performed by INTEGRAL (Gros et al., 2004)).
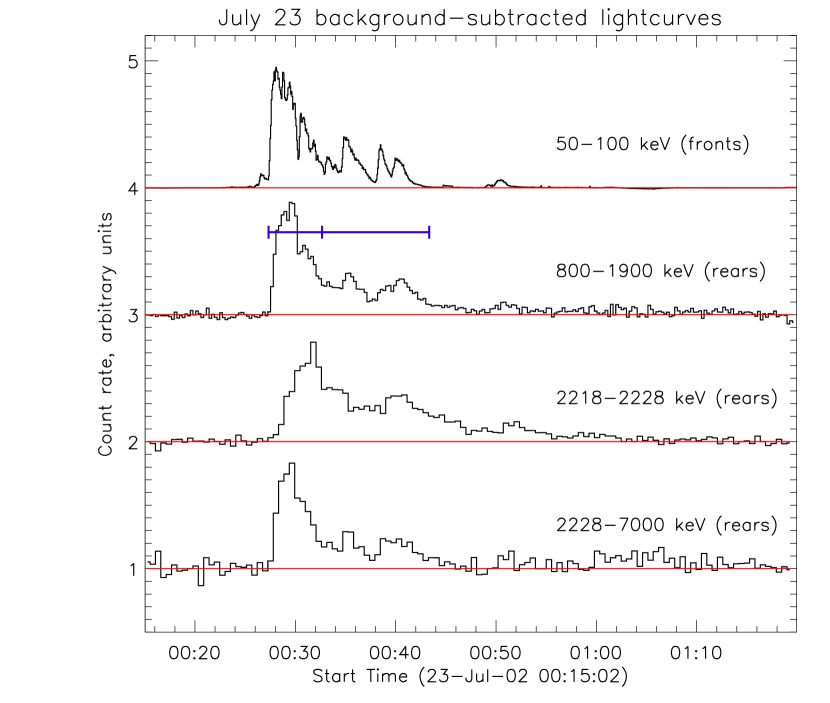
A special volume of the The Astrophysical Journal Letters presented a wide range of RHESSI results on the X4.8-class flare of 23 July, 2002, a copious emitter of gamma rays. Figure 1 shows the lightcurve of the flare in several energy bands. Figure 2 shows an overview of the spectrum across RHESSI’s range of coverage. The results reported in that volume are summarized in Lin et al. (2003), and include:
-
•
The discovery (Hurford et al., 2003) that the 2.223 MeV neutron-capture line in this flare, a good tracer of the interactions of accelerated ions, was centered at a position significantly offset from the distribution of hard x-rays from electron bremsstrahlung. The spatial separation between accelerated ions and electrons in this flare puts strong constraints on acceleration models.
-
•
The unexpectedly large width (8.1 1.1) keV of the positron-annihilation line (Share et al., 2003a). Two possible local conditions could prevail to give a line this broad: a very high-temperature yet dense and extended plasma of (4–7)K, or a similarly extensive plasma at a temperature restricted to a very narrow range around 6000 K. Neither environment is expected to be typical of flaring atmospheres, but little is known about their true conditions.
-
•
Significant redshifts and broadening found in the nuclear de-excitation lines of C, O, Ne, Mg, Si, and Fe (Smith et al., 2003a). These Doppler effects are due to gamma emission while the nucleus is still recoiling from a collision, and have been observed before (Share & Murphy, 1997), but not with high energy resolution. The redshifts were unexpectedly high for a flare on the solar limb, suggesting either a magnetic loop tilted toward the observer or an extreme beaming of the ions toward the solar surface (but see below).
-
•
A very broad shape for the lines from interactions of accelerated particles with ambient 4He (Share et al., 2003b). These lines (from 7Be at 429 keV and 7Li at 478 keV) combine to make a single broad peak of characteristic shape, indicating that the angular distribution of the accelerated particles was not beamed.
-
•
A study, using an advanced model of ion propagation in magnetic loops, of the time delay of the neutron capture line compared to prompt nuclear emissions (Murphy et al., 2003). The conclusion was that pitch-angle scattering of the ions must be taking place in the coronal part of the loop.
Work currently in progress includes a study (Shih et al., 2004) of variability of line ratios between the two halves of this flare (marked in Figure 1), and extensive studies of the gamma-ray emission in the large X-class flares of October/November 2003.

3 Galactic Nucleosynthesis
3.1 26Al

The radioactive lines from 26Al and 60Fe were extracted for the inner Galaxy, a region defined as covering 30∘ in Galactic longitude and 5∘ in Galactic latitude. When none of this region was occulted by the Earth, each minute of data was summed into the total ”source” spectrum, and when all of it was occulted, the spectrum was used to create a database of background spectra. Similar background subtraction techniques have been used for observations with the Solar Maximum Mission Gamma-Ray Spectrometer (SMM/GRS) (Harris et al., 1990; Harris, Share, & Leising, 1994) and the Burst And Transient Source Experiment on the Compton Gamma-Ray Observatory (Smith et al., 1996a, b).
Although the fluxes thus derived have virtually no dependence on the distribution of the isotopes within the inner Galaxy box, the distribution outside will affect the recorded flux in a complicated way, depending on whether it resides in parts of the sky more often appearing in source or background spectra. This issue is being studied in detail by Wunderer et al. (2004).
I reported the 26Al flux for the first nine months of the RHESSI mission to be ph cm-2 s-1 (Smith, 2003, 2004), comparable to the value found by the GRIS balloon (Naya et al., 1996) but significantly higher than the sum of the COMPTEL map in this range of Galactic longitude (Diehl et al., 1995). I have recently discovered a significant error in the calculation of the instrumental effective area, however. The correct effective area, taking a weighted average over all the angles of incidence during the different pointing periods used, should have been 29.3 cm2 rather than the 20.5 cm2 quoted earlier. The initial result should then have been ph cm-2 s-1, in much better agreement with the results from COMPTEL and other instruments. The results below and in the future will use the correct instrumental response. With minor improvements to the data selection and background selection algorithms since Smith (2003), I now find ph cm-2 s-1 for the same data set; the change other than that due to the instrument effective area is negligible.
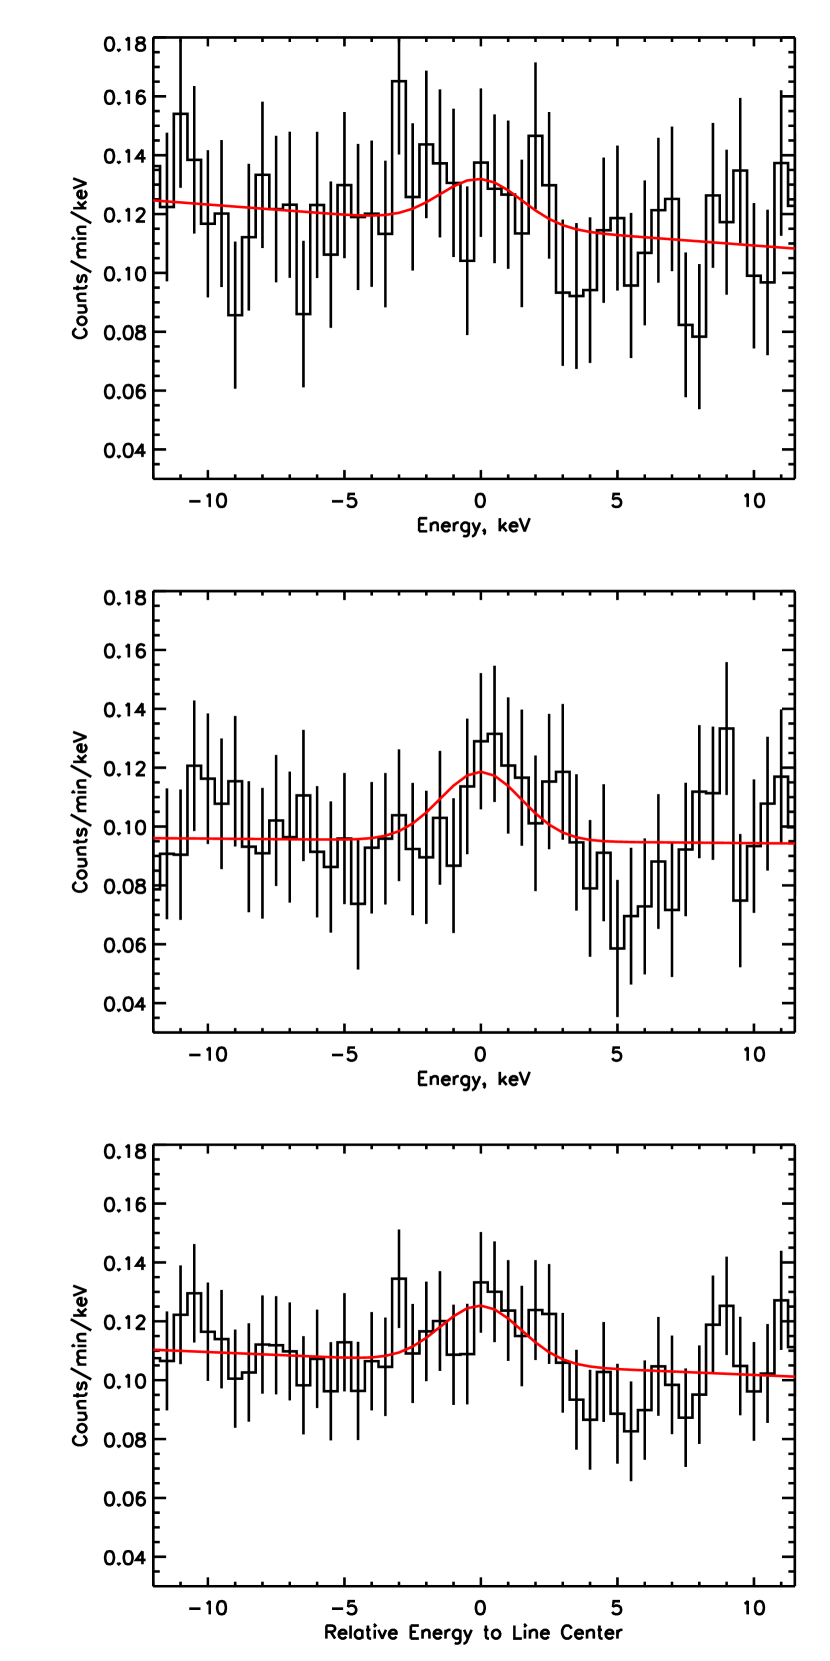
The later data set (Figure 3, middle panel) gives a flux of only ph cm-2 s-1 when fit, as the first data set was, with a simple Gaussian. It is clear, however, from the shape of the line, that there is a significant tailing of the line shape due to radiation damage in the detectors as the mission progresses. This tailing is more obvious and more quantifiable in the background lines, which can be accumulated with extremely small error bars over long time intervals. By studying these lines, particularly the line of 40K (which will have a constant flux throughout the mission since it is a natural radioactivity), we can determine the effect that radiation damage has on the measured flux for a Gaussian fit. This correction, based on the data, has also been checked with simulations (these simulations were made before the start of the mission and have accurately predicted the degree of radiation damage versus time). The corrected flux for the later data set is ph cm-2 s-1, where the second error listed is a generous margin for systematic errors in the radiation-damage correction. The corrected value is compatible within statistical errors with the measurement from the first year.
The summed data set for the entire mission to date gives ph cm-2 s-1 uncorrected, and ph cm-2 s-1 corrected for radiation damage. The effective area for the full data set is slightly lower (28.6 cm2), since it includes a December/January period when the Galactic Center is near the Sun. Now that the effective area has been corrected, the RHESSI data no longer support the tentative conclusion (Naya et al., 1998), based on the GRIS balloon data, that there might be a low-surface-brightness, highly diffuse component of the 1809 keV line not visible to imaging instruments like COMPTEL. Rather, they are now consistent with the results from COMPTEL and SMM/GRS Harris et al. (1990), another wide-field instrument like GRIS and RHESSI.
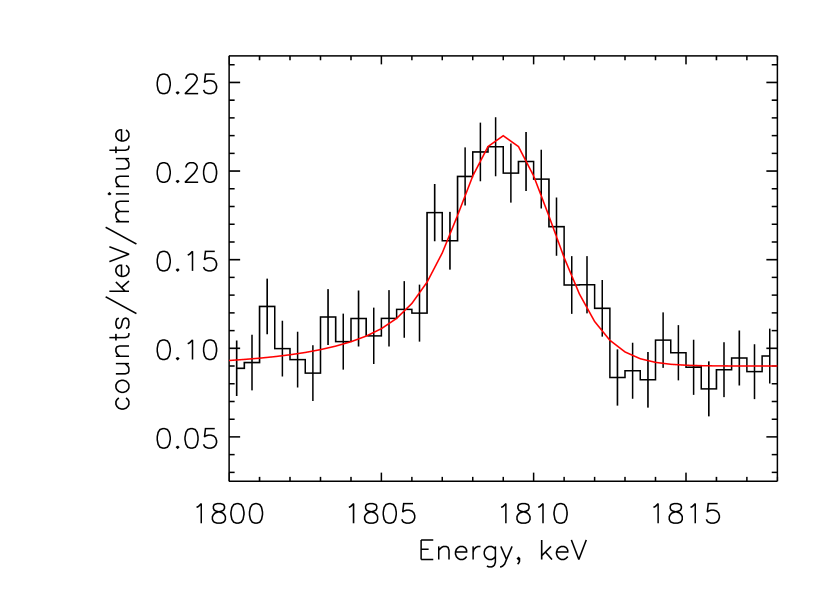
The GRIS result also included a measurement of the intrinsic line width (i.e. with instrumental broadening removed) that was surprisingly broad (5.4 (+1.4, -1.3) keV) (Naya et al., 1996), which was difficult to understand theoretically, since supernova ejecta come to rest in the interstellar medium on a timescale much shorter than the halflife of 26Al. The RHESSI result for the intrinsic width in the first nine months of the mission was 2.03 (+0.78, -1.21) keV, in clear disagreement with GRIS and consistent with the 1 keV width expected from Galactic rotation (Kretschmer et al., 2003). Including the data through 2003 November, I find 0.9 (+1.1, -0.9) keV. Figure 4 shows the line shape (also shown in the bottom panel of Figure 3, with the instrumental line shape superimposed. The instrumental shape, which has a full width at half maximum of 4.5 keV and a significant low-energy tail, was derived from background lines at nearby energies.
3.2 60Fe
The radioactivity of Galactic 60Co, the daughter of 60Fe, which is expected to be produced in core-collapse supernovae that may also produce much of the Galactic 26Al, has not previously been observed. Lines are expected at 1173 keV and 1332 keV with equal intensity. Models of nucleosynthesis have predicted that the ratio of the 60Fe/26Al lines from the population of Galactic supernovae is on the order of 15% (Timmes et al., 1995), but higher ratios have also been calculated more recently (Rauscher et al., 2002; Limongi & Chieffi, 2003), leading to a renewal of the suggestion that supernovae may not be the dominant source of 26Al (Prantzos, 2004).
An analysis of the first 14 months of RHESSI data (Smith, 2004), which combined the two lines to increase the statistical significance of the result, found a flux per line of ()% of the 1809 keV flux. This analysis was similar to that performed for the 1809 keV line, except that data shortly after passes through the South Atlantic Anomaly (SAA) were removed due to the presence of an SAA-activated line, probably from 60Cu, at 1332 keV. Summing the data through November 2003, using an improved algorithm to better identify SAA-contaminated periods, and using corrected instrumental effective areas at both energies, the ratio is now found to be ()%. Most of the difference is due to the incorporation of new data rather than the changes in the analysis method (the error in effective areas was comparable at both energies). The radiation-damage correction is significantly less important at these energies than at 1809 keV and has not been applied. Figure 5 shows the individual lines and their sum. The 1173 keV line has a significance of only 1.4, with a flux of ph cm-2 s-1, and the 1332 keV line has a flux of ph cm-2 s-1 (2.4), giving an average of ph cm-2 s-1 (2.6). Further data will be added as the mission progresses.
3.3 Positron Annihilation in Novae
Models of classical novae from either CO or ONe white dwarfs predict copious emission in the positron annhilation line at 511 keV from radioactive decay of 13N and 18F, starting at the moment of explosion (Hernanz & José, 2004). This emission occurs long before the nova could be detected in visible light, so an instrument that views a substantial portion of the sky is required to detect this emission. So far, only upper limits have been obtained, from BATSE on CGRO (Hernanz et al., 2000) and TGRS on Wind (Harris et al., 1999, 2000). Both studies obtained upper limits on the annihilation line from 18F, which has a duration on the order of half a day. The 3 upper limits on individual novae averaged ph cm-2 s-1 over 6-hour intervals with TGRS (Harris et al., 1999) and ph cm-2 s-1 over 12-hour intervals with BATSE. Despite the TGRS detector having only a tiny fraction of BATSE’s area, it was able to reach comparable sensitivity due to its high energy resolution, since the high velocity of the nova ejecta would give a blueshift to the material on the near side of the white dwarf, moving the line a few keV away from the bright background line. RHESSI has comparable energy resolution and nearly an order of magnitude more detector volume than TGRS, but its background level is about a factor of two higher due to the proximity of the Earth. Thus we expect RHESSI to have between a factor of 2 and 2.5 better sensitivity for this measurement than TGRS and BATSE.
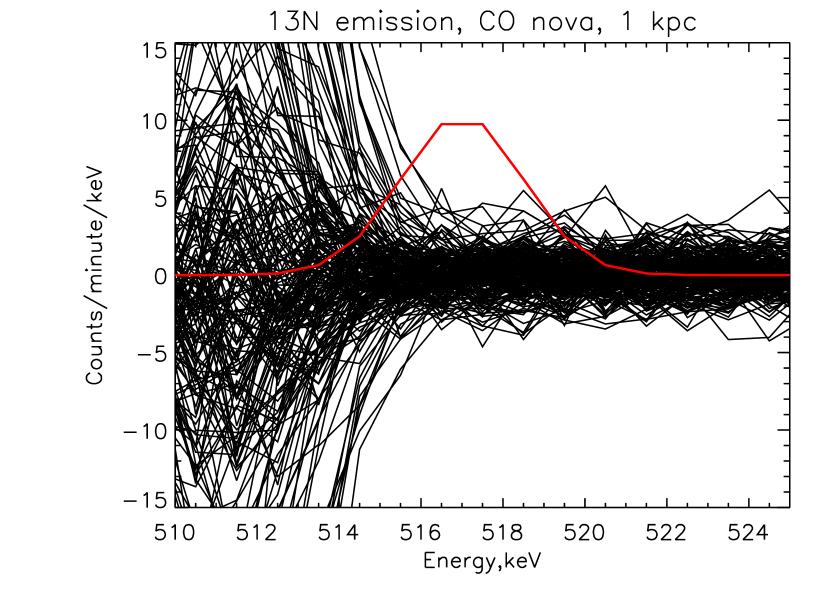
Since those limits were published, better laboratory data and modeling have resulted in new predictions that the line from 18F will be considerably lower than previously thought, putting it beyond the sensitivity of RHESSI and requiring either a very serendipitous detection by INTEGRAL/SPI in its field of view, or else the launch of a future, highly sensitive mission with full-sky or nearly full-sky coverage such as NASA’s planned Black Hole Finder Probe and Advanced Compton Telescope (ACT). These newer estimates (Hernanz & José, 2004; Kudryashov et al., 2000) also predict, however, that the line from 13N, lasting only for the first couple of hours of the explosion, could be much brighter, particularly for CO novae, and could therefore present a good target for RHESSI; it is also expected, by virtue of appearing earlier, to have a higher redshift.
Although there has not been any particularly close nova since RHESSI’s launch, the month of September 2002 provided two distant novae in the direction of Sagittarius (Liller et al., 2002; Haseda et al., 2002). Figure 6 shows RHESSI spectra in two hour accumulations from September 1–24, a period that almost certainly contains the outbursts from both novae. Background has been subtracted by using data 15 orbits (almost exactly one day) ahead and behind the interval of interest. This provides good subtraction to a level of a few percent, but the Figure shows that even this results in very large residuals at the unshifted annihilation line. Superimposed on the data in Figure 6 is RHESSI’s response to a blueshifted annihilation line at a flux level of 0.01 photons cm-2s-1, equivalent to some of the brighter predictions (Hernanz & José, 2004; Kudryashov et al., 2000) for a distance of 1 kpc; this is intended more to give a notion of what could be observed from a closer event than to represent an expected signal from these particular novae.
4 Future Work
All of the studies described here are ongoing. We are currently studying the lines from the flares of October/November 2003 and making plans for other solar studies, including a search for steady ion acceleration by studying the quiet Sun for low-level line emission and a search for radioactive 56Co in the aftermath of large flares (Ramaty & Mandzhavidze, 2000). The study of the 26Al line is bringing us together with INTEGRAL/SPI to combine the information at different spatial scales (Wunderer et al., 2004), and the 60Fe result is simply awaiting the gradual accumulation of further data. We will survey the entire sky for flashes of annihilation radiation (from classical novae or any other source), as has been done with other instruments (Harris et al., 2000; Smith et al., 1996a; Cheng et al., 1998). Finally, we will use the same technique that was used for the Galactic center lines to see if we can obtain a high-resolution measurment of the 1157 keV line from 44Ti in the Cas A supernova remnant.
Acknowledgments
This work is supported by NASA contract NAS5-98033.
References
- Cheng et al. (1998) Cheng, L. et al. (1998), ApJ, 503, 809
- Diehl et al. (1995) Diehl, R. et al. (1995), A&A, 298, 445
- Gros et al. (2004) Gros, M. et al. (2004), this volume
- Harris et al. (1990) Harris, M. J. et al. (1990), ApJ, 362, 135
- Harris, Share, & Leising (1994) Harris, M. J., Share, G. H., & Leising, M. D. (1994), ApJ, 433, 87
- Harris et al. (1999) Harris, M. J. et al. (1999), ApJ, 522, 424
- Harris et al. (2000) Harris, M. J. et al. (2000), ApJ, 542, 1057
- Haseda et al. (2002) Haseda, K. et al. (2002), IAUC 7975
- Hernanz et al. (2000) Hernanz, M. J. et al. (2000), Proceedings of the 5th Compton Symposium, AIP Conf. Proc. 510, 82
- Hernanz & José (2004) Hernanz, M. J. & José, J. (2004), New Ast. Rev., 48, 35
- Hurford et al. (2002) Hurford, G. J. et al. (2002), Solar Physics, 210, 61
- Hurford et al. (2003) Hurford, G. J. et al. (2003), ApJL, 595, L77
- Kretschmer et al. (2003) Kretschmer, K., Diehl, R., & Hartmann, D. H. (2003), A&A, 412, L47
- Kudryashov et al. (2000) Kudryashov, A. D., Chugaĭ, N. N., & Tutukov, A. V. (2000), Ast. Rep. 44, 170
- Liller et al. (2002) Liller, W. et al. (2002), IAUC 7971
- Limongi & Chieffi (2003) Limongi, M. & Chieffi, A. (2003), ApJ, 592, 404
- Lin et al. (2002) Lin, R. P. et al. (2002), Solar Physics, 210, 3
- Lin et al. (2003) Lin, R. P. et al. (2003), ApJL, 595, L69
- Murphy et al. (2003) Murphy, R. J. et al. (2003), ApJL, 595, L93
- Naya et al. (1996) Naya, J. E. et al. (1996), Nature, 384, 44
- Naya et al. (1998) Naya, J. E. et al. (1998), ApJL, 499, L169
- Prantzos (2004) Prantzos, N. (2004), astro-ph/0402198, accepted in A&A
- Ramaty & Mandzhavidze (2000) Ramaty, R. & Mandzhavidze, N. (2000), Highly Energetic Physical Processes and Mechanisms for Emission from Astrophysical Plasmas, Proc. IAU Symp. #195, 123
- Rauscher et al. (2002) Rauscher, T. et al. (2002), ApJ, 576, 323
- Share et al. (2003a) Share, G. H. et al. (2003), ApJL, 595, L85
- Share et al. (2003b) Share, G. H. et al. (2003), ApJL, 595, L89
- Share & Murphy (1997) Share, G. H. & Murphy, R. J. 1997, ApJ, 485, 409
- Shih et al. (2004) Shih, A. Y. et al. (2004), in preparation
- Smith et al. (1996a) Smith, D. M., et al. (1996a), ApJ, 471, 783
- Smith et al. (1996b) Smith, D. M., et al. (1996b), A&AS, 120, 361
- Smith et al. (2002) Smith, D. M. et al. (2002), Solar Physics, 210, 33
- Smith et al. (2003a) Smith, D. M. et al. (2003), ApJL 595, L81
- Smith (2003) Smith, D. M. (2003), ApJL, 589, L55
- Smith (2004) Smith, D. M. (2004), New Ast. Rev., 48, 89
- Timmes et al. (1995) Timmes, F. X., et al. (1995), ApJ, 449, 204
- Wunderer et al. (2004) Wunderer, C. et al. (2004), this volume