11email: giacomo@merlot.astr.ua.edu 22institutetext: Osservatorio Astronomico di Bologna, INAF, Via Ranzani 1, 40127 Bologna, Italy
22email: giovanna.stirpe@bo.astro.it 33institutetext: Osservatorio Astronomico di Padova, INAF, Vicolo dell’ Osservatorio 5, 35122 Padova, Italy
33email: marziani@pd.astro.it; zamanov@pd.astro.it; calvani@pd.astro.it 44institutetext: Astrophysics Research Institute, Liverpool John Moores University, Twelve Quays House, Egerton Wharf, Birkenhead CH41 1LD, United Kingdom
44email: rz@astro.livjm.ac.uk 55institutetext: Osservatorio Astronomico di Brera, INAF, Via Brera 28, 20121 Milano, Italy
55email: braito@brera.mi.astro.it
VLT/ISAAC Spectra of the H Region in Intermediate Redshift Quasars††thanks: Based on observations collected at the European Southern Observatory, Chile. Proposal ref.: ESO 68.B–0364(A)
We present high S/N spectra of the H region in 17 intermediate redshift ( z ) quasars. The spectra represent first results of our campaign to test the redshift/luminosity robustness of the so-called Eigenvector 1 (E1) parameter space as developed for low redshift AGN in Sulentic et al. (2000b ). The new quasars span the luminosity range M while most of our low redshift sample (n=215) involve sources in the range M. The high redshift sources show E1 parameter values and domain occupation that are similar to our low redshift sample supporting earlier findings that E1 parameters are uncorrelated with source luminosity. Elementary accretion theory can account for a systematic increase of the minimum observed H profile width with source luminosity. Narrow line Seyfert 1 sources with M show FWHM(H) as much as 2000 km s-1 broader than those with M. A possible change in the higher redshift/luminosity sources involves systematically weaker [OIII]4959,5007 narrow line emission.
Key Words.:
Line: profiles – Galaxies: quasars – Quasars: emission lines1 Introduction
There is as yet no convincing evidence for strong spectral evolution in quasars especially as far as low-ionization emission lines (LIL) are concerned. Recent UV FeII observations suggests, for example, that FeII emission remains strong up to z 6.4 (Barth et al. barth (2003); Freudling et al. freudling (2003)). The lack of spectral evolution may not present difficulties for quasar modeling per se but it may have serious cosmological implications (e.g. Hamann & Ferland hamann (1999); Matteucci & Recchi matteucci (2001)). In the modelling context see Zamanov & Marziani (ZM02 (2002)) for a demonstration of self-similar properties in widely different accreting systems.
We have been searching for a parameter space to serve the role of the stellar H-R Diagram in discriminating quasar spectral phenomenology and evolutionary states. Our so-called Eigenvector 1 (E1) parameter space (Sulentic et al. 2000b , hereafter S00b) shows promise in this context (see e.g. Marziani et al. M01 (2001); Sulentic et al. S02 (2002); Marziani et al. 2003a ). The optical E1 parameters involve broad line measures of the full width at half-maximum (FWHM) of the broad component of H (H) and the equivalent width ratio H/FeII, where FeII is measured from the 4570 blend. These are supplemented by measures of higher ionization CIV1549 line shift and the soft X-ray photon index making E1 a 4D parameter space. The distribution of sources in the E1 optical plane is consistent with a principal band or “main sequence” of source occupation. The shape of that principal sequence motivated an alternative suggestion that two AGN populations exist with an arbitrary separation at FWHM H=4000 km s-1. Population A sources generally show radio-quietness, strong optical FeII emission, a soft X-ray excess and a systematic CIV blueshift. Narrow line Seyfert 1 sources (NLSy1) represent an extreme of Population A which contains 65% of all radio-quiet (RQ) sources (Marziani et al. 2003a ). Population B sources generally show weaker FeII emission and no soft X-ray excess or CIV blueshift. The latter population contains most radio-loud (RL) sources, and about 25% of the RQ sources. RL sources found in Population A are located there because of a preferred orientation to our line of sight (e.g. core-dominated radio emission; Sulentic et al. S03 (2003)). These properties have emerged from a growing sample (N215; Marziani et al. 2003b , hereafter M03b) of low redshift (mostly z0.8) AGN. Results so-far give us cautious optimism that source orientation can be decoupled from physics using E1 space (Marziani et al. M01 (2001); Sulentic et al. S03 (2003)).
Our definition of E1 began with the low redshift part of the PG quasar sample (Boroson & Green BG92 (1992)) and our optical E1 parameters emerged in their principal component analysis of the correlation matrix for the PG sample. Interestingly enough, source luminosity emerged in their second eigenvector implying that the E1 correlations are source luminosity independent at least at low z. We continue to find no evidence for correlations involving optical luminosity in E1 space. Radio luminosity is correlated but only in the sense that radio-loud AGN show significantly restricted domain space occupation (e.g. Population B). At the same time, sources with radio/optical flux ratio (RQ) show no preferred domain space occupation in E1.
Naturally we would like to test the robustness of the E1 space using samples of sources with higher mean redshift and luminosity. This involves tests using samples of quasars with z and optical spectroscopy CIV and/or IR measures of the H region. Recent Sloan Digital Sky Survey (SDSS) results for a large intermediate/high redshift sample (Richards et al. richards (2002)) show CIV trends very similar to our low redshift (S00b) E1 results (i.e. 65–75% of sources with Population A CIV properties). IR spectra of the H region, up to this point in time (e.g. Espey et al. espey (1989); Murayama et al. murayama (1998); Oya et al. oya (1998); McIntosh et al. Mc99 (1999), hereafter Mc99; but see Dietrich et al. dietrich (2002)) have suffered from low resolution and S/N making comparisons with our E1 sample impossible. We have begun a campaign to obtain high S/N IR spectra of the region of the H+optical FeII4570 blend in intermediate redshift quasars. We present results from the reduction and analysis of ESO VLT1/ISAAC spectra for our first year sample of 17 sources. We show that the quality of these data is comparable to our low-redshift database (M03b). We are able to measure the H and Feiiopt E1 parameters using the same techniques described in M03b (Sect. 2). We present an analysis of the luminosity and redshift trends using the new intermediate redshift IR and older low redshift optical data (Sect. 4.2). We also interpret the new line measures in the context of the E1 parameter space (Sect. 5.1).
2 Observations, Data Reduction, and Measurements
Table 1 presents a summary of the observations and basic source properties, with footnotes giving detailed descriptions of each column. Data were collected using VLT1/ISAAC operated in service mode between 2001 November and 2002 February. All spectra were obtained with a slit width of 0.6 arcsec. Each spectrum corresponds to the wavelength range of an IR window (sZ, Z, J, H) and covers the region of redshifted H and Feii4570 (or Feii5130 blend). Two matching spectra in adjacent bands were obtained in five cases, to improve the coverage of the H spectral region.
Reductions were performed using standard IRAF routines. Sequences of frames with a given Detector Integration Time (DIT, see Table 1) were obtained with the source at different positions (e.g. A, B, C…) along the slit. All frames at a specific slit position were averaged and the average of observations at all other positions was subtracted from it. The resulting differences were divided by the appropriate flat field frames provided by the ESO pipeline reduction. Any residual background was then eliminated by fitting and subtracting a low-order polynomial function to each spatial line of the frame. Spectra were extracted using the IRAF program apall. Cosmic ray hits were eliminated by interpolation, comparing the affected spectrum with the other spectra of the same source. For each position along the slit a corresponding Xenon/Argon arc spectrum was extracted from the calibration frame, using the same extraction parameters. The wavelength calibration was well modeled by 3rd order Chebyshev polynomial fits to the positions of 15–30 lines, with rms residuals of 0.3 Å in the Z band, 0.4 Å in sZ, 0.6 Å in J, and 0.9 Å in sH. Once matched with the corresponding arc calibrations, the individual spectra of each source were rebinned to a common wavelength scale. They were then averaged with weights proportional to the total integration time of each spectrum.
The spectra of the atmospheric standard stars were extracted and wavelength-calibrated in the same way. All clearly identifiable stellar features (H and HeI absorption lines) were eliminated from the stellar spectra by spline interpolation of the surrounding continuum intervals. Each target spectrum was then divided by its corresponding standard star spectrum in order to correct for the atmospheric absorption features. This was achieved with the IRAF routine telluric, which allows one to optimize the correction with slight adjustments in shift and scaling of the standard spectrum. The shape of the continuum of the standard star was eliminated from the spectrum of each target by multiplying the latter with an artificial black-body continuum corresponding to the temperature of the star, determined on the basis of its tabulated spectral type. Finally, the correct flux calibration of each spectrum was achieved by scaling it according to the magnitude of the standard star and to the ratio of the respective DITs. Because the seeing almost always exceeded the width of the slit, significant light loss occurred, and therefore the absolute flux scale of the spectra is not to be considered as accurate. However, in this high-wavelength range we consider the light losses to be independent of wavelength, and they should therefore not affect the relative calibration of the spectra.
Redshift measures are usually based on [Oiii]5007 but the narrow component of H (H) was also used whenever possible. Redshift uncertainty is usually km s-1, including estimated uncertainty of the wavelength calibration. These measures can be regarded as the most accurate available, with the caveat that some (Population A) sources with narrowest FWHM H sometimes show a significant [Oiii]4959,5007 blueshift (Zamanov et al. Z02 (2002); Marziani et al.2003a ). The S/N ratio has been estimated by: (1) locating a spectral region that is flat and free of strong lines and (2) dividing two times the rms scatter by the average signal in that region. Examination of the spectra will reveal the limited regions available for S/N and continuum estimation. S/N values are comparable to our low-redshift M03b data. The IR spectra presented in Figs. 1 and 2 are, on average, indistinguishable from the data in the M03b atlas. Spectral resolution is FWHM = 9 Å in the Z band ( Å), 11 Å in the sZ band ( Å), 12 Å in the J band ( Å), and 16 Å in the H band ( Å). In all bands this is equivalent to FWHM 300 km s-1 which is similar to the resolution of the M03b data.
Measurements were carried out with exactly the same technique employed by M03b. The de-redshifted spectra were continuum- and then Feiiopt-subtracted. The spectral width of the IR windows made continuum modeling and subtraction uncertain in many cases. The lowest regions in the adopted FeII fits shown in the spectra of Figure 2 allow one to infer the adopted continuum level. Feiiopt subtraction was achieved employing a template based upon spectra of I~Zw~1, scaled and broadened by fixed factors in a plausible range chosen by eye. The best Feii4570 template was chosen as the one yielding the minimum residual in a matrix of 1010 scaling and broadening factors. An interesting result comes from the broadening factor of the Feiiopt template: an estimate of the intrinsic width of the individual Feiiopt lines. All measures have an accuracy (for a given S/N) similar to those in M03b. The H was isolated after subtracting the narrow component of H (self-consistent guidelines are provided in M03b). Both [Oiii]4959,5007 and Heii4686 were also measured whenever possible.
3 Sample Considerations
We adopted the Hamburg-ESO (HE) quasar surveys (Wisotzki et al. wisotzki (2000)) for tests of E1 validity and robustness. The color-selected PG sample (Boroson & Green BG92 (1992)) is thought to be biased towards selecting what we call extreme Population A sources i.e. NLSy1s (FWHM(H) km s-1). We are in the process of observing both low and intermediate redshift subsamples of grism-selected HE quasars in order to evaluate effects of selection bias on mean E1 parameter values and E1 domain space occupation. The low redshift sample will compare E1 properties of HE grism- vs. PG color-selected quasars. The intermediate redshift sample will explore possible E1 changes with redshift/luminosity. If anything, the HE samples should be biased towards broader/stronger lined (Population B) quasars. The PG sample finds 20/87 23% NLSy1s while the (also color-selected) SDSS (Williams et al. williams (2002)) suggests that 15% of all low-redshift AGN are NLSy1. Our low redshift M03b sample includes 150 RQ and 65 RL sources. NLSy1, which are very rarely RL, account for 11% and 16%, respectively, of the total and RQ parts of our sample.
RL sources are over-represented (30%) in our sample because that part of our low-redshift sample has been surveyed more completely to our adopted magnitude limit . We find 85% RQ and 10% RL in the Population A domain while 37% RQ and 75% RL are found in the Population B domain. Only 7% of the sample fall off of the Population A-B “main sequence” and are designated “outliers”. RL sources are defined as those with /, plus any sources near and below that limit showing double-lobed (FRII) radio morphology ( ; Sulentic et al. S03 (2003)). All true core-dominated RL sources are assumed to be radio flux-boosted FRII’s and should show values of . The condition yields 4 RL sources in our VLT/ISAAC sample with two additional radio-intermediate sources with . This implies an excess of RL sources in the intermediate-redshift sample; however it is premature to draw such conclusions. The small size of our new sample suggests that sources are best compared in terms of the so-called E1 Populations A and B. They are represented by 6 and 11 sources respectively.
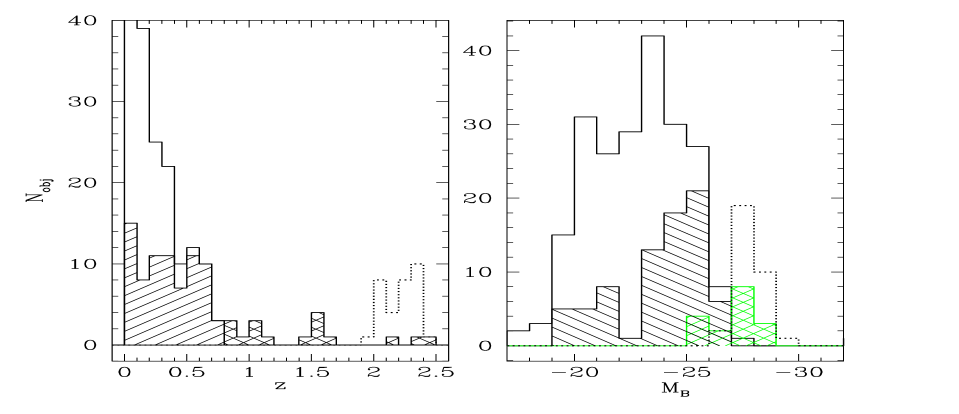
Our comparisons with the low--defined E1, and search for luminosity effects, make use of the M03b dataset that includes 215 sources with a “core” of 85 sources from the PG survey (Boroson & Green BG92 (1992)). In Marziani et al. (2003a ) we increased our low-redshift sample by adding the soft-X-ray selected sources from Grupe et al. grupe (1999). All defining properties of E1 space have remained stable as our sample has grown from 70 to low-redshift sources. Strong luminosity effects were ruled out but luminosity dependence was not studied in detail. No claim of completeness can be made for the majority RQ part of the M03b sample (30%), however V/Vmax tests suggest that the RL part is about 80% complete to ; . However incompleteness is not a major impediment to a proper correlation analysis with if we have uniform sampling across the entire absolute magnitude range. Figure 3 shows the (Véron-Cetty & Véron veron (2000)) and redshift distributions for the M03b and VLT samples. We also include the much lower S/N high- observations from Mc99. The range is reasonably well sampled. It is important to stress that, if RQ and RL sources are considered separately, most RQ fall in the range , while RL are on average more luminous, . We are observing the brightest sources in the HE survey which means that we are sampling an range similar to Mc99 but with sources distributed over a wider range of redshift.
4 Results
Wavelength- and flux-calibrated spectra of the 17 HE quasars are shown in Figure 1 and Figure 2. Figures show de-redshifted spectra both before and after continuum and Feiiopt subtraction. The right-hand panels of Fig. 2 show the “cleaned” H profile following H, [Oiii]4959,5007 and Heii4686 subtraction. Rest-frame equivalent widths are given in Figure 2 for H, Feii4570, H and [Oiii]4959,5007, along with the FWHM estimates for individual terms of the Feii4570 emission. FWHM and other H profile measures are provided in Table 3 along with 2 uncertainties. Line parameters such as asymmetry index, kurtosis and line centroid at various fractional intensities are the same as defined in Marziani et al. M96 (1996) (hereafter M96) and M03b. Asymmetry index is defined as:
where and are the radial velocities measured on the blue and red sides of H at 1/4 fractional intensity. The asymmetry index thus defined is independent of assumptions about the rest frame. In general, we define a centroid radial velocity as
which we list in Table 3 for and 3. In the definition of A.I., we use as a proxy for the peak radial velocity .
The optical Eigenvector 1 parameters (= W(Feii4570)/W(H) and FWHM(H); S00b) can be computed from the data in Tables 2 and 3. Figure 4 shows the location of the low and intermediate-redshift quasars in the optical plane of E1. The VLT/ISAAC sources show no significant difference in E1 domain space occupation. In contrast Mc99 data suggests a rather different picture with most sources located in an “outlier” region that is scarcely populated by low-redshift AGN: FWHM(H) km s-1. No low-redshift sources are observed with the additional condition , where of the Mc99 sources are found. We suggest that the latter data sample is critically affected by poor S/N (§5.2).
Some general trends seen in the low-redshift data continue to be found: 1) RL sources favor Population B and show lower average values, 2) FWHM H and values do not differ significantly between Population B RL and RQ sources, 3) moving towards Population A we find the same systematic increase in average (from 0.37 to 0.54), 4) Population A sources favor the upper envelope of the low redshift distribution which may be pointing to a correlation between FWHM(H) and luminosity (see 5.2.1) and 5) Civ1549 measures show expected E1 trends as discussed in the next section.
4.1 CIV1549 Trends for the VLT Quasars
CIV profile shift was adopted as one of the E1 parameters rather than EW CIV because its interpretation is less ambiguous. Population A sources in the low-redshift sample show a systematic CIV blueshift while Population B sources do not. Population A sources also show a lower mean EW than Population B AGN (S00b). Optical ground-based Civ1549 spectra exist for three of the HE sources and they are discussed individually. In addition HE discovery spectra (courtesy of L. Wisotzki) for sources with include Civ1549. Table 4 summarizes the E1 CIV shift parameter for VLT sources with available data. Profile shift was measured relative to rest frame measures derived from [Oiii]4959,5007
HE 0005$-$2355:
We call this a Population B RL source. Espey et al. (espey (1989)) report consistent with the general absence of large Civ1549 blueshifts in Population B sources (we obtain ; Espey et al. espey (1989) report for H with FWHM(H) km s-1). The more recent HE measure gives but with CIV at the noisy blue edge of the spectrum.
HE 0122$-$3759:
Population A RQ source. Comparison of Civ1549 redshifts (2.173: Carswell et al. carswell (1982); 2.178: Espey et al. espey (1989)) with our [Oiii]4959,5007 value (2.200) suggest a large blueshift. Espey et al. (espey (1989)) derive from H and from Mgii2800. An HE spectrum (CIV ) confirms the large blueshift km s-1 with an amplitude seen only in extreme Population A (i.e. NLSy1) sources. The highest amplitude blueshifts at high and low redshift fall in the range km/s (S00b; Richards et al. richards (2002)).
HE 0205$-$3756:
Population A RQ source. A published
Civ1549 measure yields (Ulrich ulrich (1989)). This implies a
large blueshift km s-1 relative to our rest frame
measure (2.412 in Wilkes wilkes86 (1986)). The low measured W(Civ1549)
(Ulrich ulrich (1989)) is also consistent with a Population A source
(S00b). Taken at face value, EW and profile shape
for H appear characteristic of Population B. However the
H red shelf may be a spurious feature caused by
residuals from the very strong sky lines. Either this object
is affected by bad data or it may herald a change towards
more “population ambiguous” quasars at high redshift/luminosity
that must be monitored as our sample increases.
In summary we confirm that Civ1549 blueshifts first observed by Gaskell (gaskell (1982)) may be increasingly common in intermediate redshift quasars. All certain blueshifts in the VLT HE sample are found in Population A sources as predicted from E1, while all Population B shifts are marginal (see Table 4).
4.2 Luminosity Trends
Studies of the E1 parameter space have thus far been constrained to sources with and mostly . The redshift constraint reflects the loss of the H spectral region to optical observation at 1.0. The magnitude constraint reflects our S/N and resolution requirements convolved with telescopes readily available to us. Lower-quality data cannot provide accurate E1 parameter measures or reveal E1 domain occupation clearly. The analogy would be to try to define the H-R diagram for a star cluster using magnitudes and colors with respective uncertainties of 1.0 and 0.4. This issue would be irrelevant if all quasars were alike but source occupation in the E1 domain (in analogy to stars in the H-R domain) is not random and the difference between so-called Population A and B quasars is found in virtually all AGN properties (see also Sulentic et al. S02 (2002)). Within our sample constraints, optical luminosity is uncorrelated with E1 properties at low redshift (S00b; M03b).
Beyond tests of the robustness of E1 space, extension of our sample to higher redshift/luminosity can address many questions. Do quasars maintain the same emission line properties over the full range of redshift/luminosity? Can we constrain any form of evolution? In particular, can we identify any difference in optical Feiiopt emission? Is the evolution of quasar spectral parameters consistent with the expectations of broadening by virial motions? We will address these questions, as far as currently possible, one parameter at a time. Table 5 provides a synopsis of our luminosity correlation analysis. We report the generalized Spearman rank correlation coefficient computed for the general case of censored data (Isobe et al. isobe (1986)). M03b data yield only meaningful upper limits for Feii4570 and for several tens of sources. Of course, whenever upper limits are not considered the correlation coefficient reduces to the usual Spearman . We also considered the PG quasar sample independently as well as the VLT/ISAAC data and, with a single exception (see Sect. 4.2.1), found behavior in agreement with those of the other samples (albeit the PG RL sub-sample () is too small to give reliable correlation coefficients). No credible evidence for a luminosity correlation was found.
4.2.1 E1 Broad Line Parameters
FWHM(H):
Figure 5a shows the M03b+VLT source distributions in the FWHM(H) vs. plane. Early, as well as recent, works (e.g., Joly et al. joly (1985); Corbett et al. corbett (2003)) suggested at most a weak correlation between FWHM(H) and source luminosity. A weak tendency for FWHM(H) to increase with was also suspected in the M03b data. The weakness of the “correlation” is quantified by the Spearman correlation coefficients () for the M03b+VLT/ISAAC sample. Any weak trend in this plot disappears completely if we correct for a correlation induced because RL sources in our sample tend to have higher mean luminosity and FWHM(H) than RQ sources. The most significant feature of the plot involves an apparent systematic increase in the smallest observed FWHM with increasing . FWHM(H) increases from 1000 to 3000 km -1 between and . Very broad H profiles are observed at all luminosities although sources with FWHM(H) km/s appear to be quite rare and possibly disjoint with respect to the bulk of the sample. This sparseness is likely physically motivated because sources with large FWHM(H) and W(H) really exist and are not the product of observational errors. Such sources are sometimes double-peaked (Eracleous & Halpern eracleous (2003), and references therein) and are also somewhat unstable systems that may be radiating at very low L/M in the E1 context and may therefore be intrinsically short-lived (Sulentic et al. S95 (1995); Marziani et al. M01 (2001)).
:
The second E1 optical parameter shows no convincing evidence (Fig. 5b) for a correlation if RQ and RL sources are considered separately (RL are weaker Feiiopt emitters than RQ sources, which accounts for the somewhat larger correlation coefficient when no RQ-RL distinction is made). The situation is however more complicated because many W(Feii4570) measurements are actually upper limits. We therefore considered two cases: 1) we used the best fit Feii4570 estimates from M03b + Table 2 and 2) we used minimum values of Feii4570 detectability (which depend on FWHM and S/N) to derive Feii4570 upper limits. We then performed a censored data analysis computing Kendall’s , in addition to Spearman , as an estimator of the correlation. Similar results are found in the two cases ( values are not reported).
4.2.2 W(H) and the H Profile
Claims that W(H) decreases with luminosity have been rather unconvincing due to small sample sizes and large intrinsic scatter (Sulentic et al. 2000a , and references therein (no); Mc99 (no); Wilkes et al. wilkes99 (1999) (yes); Croom et al. croom (2002) (no)). In the M03b+VLT samples W(H) shows no significant correlation with even if RQ and RL subsamples are combined (in contrast to and FWHM(H)). It is however intriguing that W(H) measured for VLT sources are all Å (Fig. 5c).
Table 3 reports line profile measures for 16/17 VLT sources. HE 0353$-$3919 is excluded because H falls in the gap between the sZ and Z bands allowing only a rough estimate of FWHM(H) km s-1. We considered the luminosity dependence of AI, c(1/4), and c(3/4) which are the most robust parameters (least affected by errors; M96). No significant correlation was found.
4.2.3 Feiiopt Emission Properties
Figure 5d shows no evidence for a correlation between and W(Feii4570). The absence of a W(Feii4570) trend is less significant because of the larger uncertainty associated with these measures. In modeling and subtracting Feiiopt emission we found no source that significantly deviated from the scaled and broadened I~Zw~1 template. This template is remarkably successful for modeling even sources with strong and narrow Feiiopt emission such as HE 2305$-$5315 and HE 0122$-$3759. It also works well for sources with obviously broader lines (e.g. HE 0248$-$3628). We found no convincing examples of unusual Feiiopt emission (i.e. multiplet ratios different from I~Zw~1).
FWHM(H) and FWHM(Feii4570) are strongly correlated as shown in Figure 7. This is consistent with the hypothesis that profiles of individual Feii4570 lines are very similar to H. A weighted least-squares fit yields a slope of (1 uncertainty). The large uncertainty reflects the relative insensitivity of the template fits to the adopted line width.
4.2.4 Narrow Lines
The VLT sample shows a large number of sources with weak [Oiii]4959,5007 emission. Figure 5e shows the best fit for all sources (M03+VLT/ISAAC) using a robust fitting method. While this fit tells us little or nothing, we do see an interesting difference between the M03b and VLT samples. The M03b sample shows a large range in W([Oiii]4959,5007) at all luminosities. Most of the VLT measures cluster at very low values. The values are low even relative to the M03b sample that contains a significant number of NLSy1 sources. They are as low or lower than measured values for extreme Population A blue outlier sources (Marziani et al. 2003a ). This may be the first hint of a real decrease in the strength of the narrow line region for higher luminosity quasars.
5 Discussion
5.1 The E1 Parameter Space
The so-called E1 parameter space is a reasonable approximation to a (4D) H-R Diagram for AGN (S00b). In this context we mean: 1) discrimination between and unification of the diverse classes of AGN and, possibly, 2) representation of various states of source spectral evolution. If an H-R analogy is in any way useful, it would not be surprising to find that more than two observational parameters are required to define it. We take it as a given that a quasar H-R Diagram is needed because of the striking diversity in the spectral signatures of the broad line regions for different AGN classes (S00b; Sulentic et al. S02 (2002)). It is hoped that the E1 parameter space will both clarify the phenomenology and better focus models for the central geometry and physics. One of the big challenges for E1 is to remove the degeneracy between physics and source orientation to our line of sight (Sulentic et al. S03 (2003)). Right now, in analogy to mass (M) as the physical driver of the stellar main sequence, evidence suggests that the Eddington ratio ( Ṁ) is the principal physical driver in E1 (Marziani et al. M01 (2001); M03b; Boroson B02 (2002)). As an equivalent to the stellar main sequence we find an “L-shaped” distribution of points in the optical parameter plane of E1 (FWHM(H) vs. ; Fig. 4). The present tentative results suggest that the L-shaped distribution is preserved up to . We have earlier suggested that the extreme Population A sources with the narrowest Balmer profiles, strongest FeII emission, CIV blueshift and soft X-ray excess are the high accretion end of the E1 sequence (S00b). We also suggested that these extreme objects may represent the quasar “seed” population (see also Mathur mathur (2000)). In this context we expect the fraction of such extreme sources to increase with redshift. Both the SDSS CIV (Richards et al. richards (2002)) and initial VLT samples are consistent with this idea (i.e. high frequency of CIV blueshifts at high redshifts and weak narrow line regions at intermediate redshifts, respectively). Overall however the VLT sample follows closely the low-redshift E1 results.
5.2 The Need for High S/N and Resolution
The Mc99 data pose an apparent challenge to our claims about E1 robustness at higher redshifts. Unfortunately, the Mc99 data have very low S/N. Even if the spectral resolution ( km s-1) is modestly reasonable, the S/N is in general (see their §2 and Table 1). It is very risky to measure Feiiopt emission in data with such low S/N and limited spectral coverage. M03b estimated the minimum detectable W(Feii4570) as a function of FWHM(H) for several S/N values. For S/N we find the approximate relation: W(Feii4570)FWHM(H), where the rest frame W(Feii4570) is in Å, and FWHM(H) is expressed in km s-1. W(Feii4570)Å for FWHM(H) km s-1, which explains why we have so many upper limits among the Population B sources. Most values reported by Mc99 should be changed to upper limits. We simulated Mc99 data with S/N (sources Q0049007, Q0153257, Q1011091, Q1309056) with line widths and W(Feii4570) (always Å) as given in that paper. We then set the uncertainty to the upper limit W(Feii4570)min needed for a detection (i.e. upper limit is equal to the 3 uncertainty) based on the errors in W(H) and FWHM(H) reported by Mc99. Even if Feiiopt is detected, the limited spectral coverage makes results very sensitive to the somewhat arbitrary continuum placement (e.g., Q1011$+$091). Some results are obviously arbitrary (e.g. Q0049$+$007 and Q0226$-$104) and there is no convincing evidence that lines are very broad or that Feii4570 should have W(Feii4570) 70 Å. Another doubtful case involves Q1209–056 although, again, the limited spectral coverage makes Feiiopt fitting an extrapolation for the blue and red blends. If upper limits and revised uncertainties are considered, the E1 quasar distribution in Fig. 4 can be significantly displaced toward . The same concerns apply to Yuan & Wills (yuan (2003)), where both FWHM H and values are likely overestimated for many sources. Taken at face value the Mc99 quasars would imply very large black hole masses (M M⊙) since they likely radiate at very low Eddington ratio (–) (Zamanov & Marziani ZM02 (2002)). Such large masses may not be frequent even among high-redshift quasars (McLure & Dunlop mclure (2004)).
5.3 A Luminosity/Mass Dependent Minimum FWHM(H)?
Two of our VLT Population A sources (HE 0122$-$3759 and HE 2305$-$5315) show (0.9 and 0.8) and no W([Oiii]4959,5007) detections. CIV data exists only for the former where an extreme CIV blueshift is measured. We call such sources extreme Population A or NLSy1 sources based on these criteria. The sources show FWHM(H) (3600 and 3200 km s-1 respectively) which significantly exceeds the nominal FWHM(H) km s-1 limit for NLSy1 sources. Such broader-lined and strong Population A sources are also found in our low-redshift sample. The smallest FWHM(H) km s-1 found among our 6 VLT Population A sources is larger than the FWHM of more than half of the Population A sources in our low-redshift sample. This suggests a possible lower limit to this parameter that is rising with source luminosity. HE 01223759 at , interpreted as an NLSy1, would be the most luminous yet observed. No X-ray detections are reported for these two sources.
In order to ascertain whether there is a luminosity effect, one can consider the well-defined lower boundary in the FWHM(H) vs. diagram (Figs. 5a and 6). This boundary can be interpreted as a luminosity effect. Such a trend is indeed expected if: 1) H broadening is dominated by virial motions and 2) the emissivity-weighted distance of the BLR from the central BH depends on luminosity (Kaspi et al. kaspi (2000)). The exact value of is very sensitive to: a) the poor sampling in some luminosity ranges, b) the presence of several outliers and c) the cosmology (Marziani et al. 2003a ). Refitting Kaspi’s data for km s-1 Mpc-1 and , we obtain:
where we have assumed that the bolometric luminosity at 5100 Å. The value of is slightly different from the value given by Kaspi et al. (kaspi (2000)).
The virial relationship implies:
where the factor 1/2 comes from the use of FWHM(H) (FWHM) and the factor takes into account that we measure a radially projected velocity. Substituting with and transforming into convenient units, we obtain:
where luminosity is in L⊙ and the L/M ratio is in units of times the solar value (L/L corresponds to ).
We add here the assumption that low-redshift NLSy1 with the narrowest lines radiate very close to the Eddington ratio. If we assume we obtain FWHM(H) km s-1 for . The same relationship written for as a function of becomes:
Considering the typical instrumental width of our data the actual FWHM(H)min would be km s-1. FWHM(H)min is similar to the lowest FWHM(H) found in the M03b sample. It is even closer to the lowest known FWHM(H) for NLSy1s (PHL~1092 and IRAS 13224$-$3809; Marziani et al. M01 (2001)). If we consider the luminosity dependence of FWHM(H)min, we see that the expected trend for reproduces fairly well the FWHM(H) lower boundary as a function of , especially if we consider only RQ sources (see Fig. 6). A less pronounced trend is expected for , especially at high luminosity. This result is helpful for interpreting the following three issues:
Correlation of FWHM(H) with luminosity:
A significant correlation between FWHM and luminosity may depend on: 1) sample selection and 2) intrinsic dispersion of FWHM values in a narrow range. It will also be affected by the fact that the profile of H is now known to be composed of at least three independent components; narrow, broad and very broad (Sulentic et al. S02 (2002)). Population A sources appear to be dominated by the “classical” broad component. Population B can be significantly affected by the unshifted narrow and redshifted very broad components. In many sources these two components can cancel any bias on the measured FWHM H. In others they do not and resultant FWHM measures cannot be safely compared with the above or Population A sources. Given the low S/N of most quasar spectra, the very broad component will often be modelled with the continuum. FWHM measures for such sources will often be serious underestimates unless the narrow component is explicitly subtracted. This leads to a prediction that RL sources (mostly Population B) will be systematically measured with FWHM (and consequently, MBH) too low in low S/N spectra.
One must consider that any expected FWHM-luminosity dependence will be very weak. This means that it is reasonable to expect an increase FWHM(H km s-1 over an increase of , with FWHM(H)min changing from 1000 km s-1 to 2000 km s-1. In a narrow range, the intrinsic spread of FWHM(H) measures ranges from 1000–10000 km s-1. This will tend to make any intrinsic correlation very weak. Larger samples at higher luminosity are needed to test these predictions. Corbett et al. (corbett (2003)), analyzing a very large sample from the 2dF and 6dF redshift surveys, find a weak increase of H line width with luminosity, with a slope –0.2 ( vs. ), very close to the one expected from our calculation. However the average resolution, S/N and lack of FeII subtraction in this analysis warrant caution in accepting this result as support for our prediction. Higher luminosity/redshift spectra in this sample will show systematically lower S/N. If FeII-strong Population A sources really dominate at high redshift then most sources will have FWHM overestimated due in part to FeII blending with H. Comparable (and reasonably high) S/N data are needed for sources at all redshifts and luminosities in order to make a proper luminosity correlation test.
RQ and RL differences:
The FWHM(H) difference between RQ and RL sources is not simply a luminosity effect: if redshift and magnitude distributions are matched, RQ and RL still show systematic differences (M03b; Sulentic et al. S03 (2003)). This can also be seen restricting attention to higher luminosities ( ) where most RL are located: in this range FWHM(H) FWHM(H)RQ (a Kolmogorov-Smirnov test indicates probability that the FWHM values are drawn from the same distribution).
Boundaries: Populations A-B and NLSy1s:
If we accept a low-redshift boundary between Population A and B sources at FWHM(H) km s-1, then it may increase as a function of luminosity following a curve parallel to that for FWHM(H)min. If this correction is applied, the frequency of Population A (10) and Population B (7) sources among the 17 VLT/ISAAC sources is consistent with the low-redshift sample (Population A should be –% of all sources; Marziani et al. 2003a ).
6 Summary and Conclusion
We present 17 VLT/ISAAC spectra of intermediate redshift quasars with resolution and S/N comparable to our M03b sample of ground-based spectra for low-redshift AGN. Quasar spectra in the range do not yet show appreciable E1 parameter differences from quasars with . No significant luminosity correlations with line parameters are found again in agreement with previous E1 inferences. The two most interesting effects found in this preliminary comparison involve: 1) a tendency for the minimum FWHM H to increase from km s-1 at to km s-1 at and 2) most of our VLT sources show W([Oiii]4959,5007) values equal to or less than those found for the low-redshift sample. The former effect can be accounted for by accretion theory while the latter may indicate a weakening of the narrow line region in higher redshift quasars. A comparison with the largest sample of previously published IR data (Mc99) indicates that high S/N and spectral resolution are required to obtain meaningful results. Further VLT/ISAAC observations will provide a unique window on the E1 parameter space at high luminosity and redshift.
Acknowledgements.
We thank Lutz Wisotzki for providing us with the HE optical spectra.| Object name | Linec | Datef | Bandg | DITh | N | Airmassj | S/Nk | ||||
|---|---|---|---|---|---|---|---|---|---|---|---|
| (1) | (2) | (3) | (4) | (5) | (6) | (7) | (8) | (9) | (10) | (11) | (12) |
| HE0003$-$5026 | 17.07 | 1.0772(4) | 1 | 26.7 | 2.19 | 2001-12-23 | Z | 180 | 12 | 1.42-1.59 | 20 |
| sZ | 180 | 12 | 1.27-1.38 | ||||||||
| HE0005$-$2355 | 16.94 | 1.4120(3) | 2 | 27.6 | 2.56 | 2001-11-22 | J | 120 | 24 | 1.01-1.07 | 15 |
| HE0048$-$2804 | 17.25 | 0.8467(3) | 1 | 26.0 | … | 2001-12-17 | Z | 150 | 16 | 1.04-1.11 | 7 |
| HE0122$-$3759 | 16.94 | 2.2004(4) | 2 | 28.9 | … | 2001-12-28 | SH | 180 | 12 | 1.05-1.09 | 15 |
| HE0205$-$3756 | 17.17 | 2.4367(5) | 2 | 29.0 | … | 2002-12-16 | SH | 180 | 12 | 1.05-1.09 | 35 |
| HE0248$-$3628 | 16.58 | 1.5362(4) | 2 | 28.2 | 0.84 | 2001-12-28 | J | 180 | 12 | 1.03-1.05 | 30 |
| HE0331$-$4112 | 16.24 | 1.1153(4) | 1,2 | 27.6 | … | 2001-12-23 | Z | 180 | 12 | 1.25-1.39 | 30 |
| sZ | 180 | 8 | 1.41-1.54 | 15 | |||||||
| HE0349$-$5249 | 16.13 | 1.5384(4) | 2 | 28.7 | … | 2002-02-26 | J | 120 | 20 | 1.26-1.38 | 30 |
| HE0353$-$3919 | 16.14 | 1.0065(35) | 3 | 27.5 | 1.49 | 2002-02-26 | Z | 180 | 12 | 1.41-1.62 | 30 |
| sZ | 180 | 12 | 1.70-2.05 | 15 | |||||||
| HE0454$-$4620 | 17.23 | 0.8528(3) | 1 | 25.9 | 3.37 | 2002-12-16 | Z | 150 | 18 | 1.25-1.40 | 5 |
| HE2202$-$2557 | 16.71 | 1.5347(3) | 2 | 28.1 | 1.80 | 2001-10-05 | J | 120 | 12 | 1.06-1.03 | 20 |
| HE2259$-$5524 | 17.09 | 0.8549(4) | 2 | 26.1 | … | 2001-10-05 | Z | 180 | 18 | 1.20-1.16 | 10 |
| HE2305$-$5315 | 16.33 | 1.0733(4) | 2 | 27.5 | … | 2001-11-24 | Z | 120 | 12 | 1.21-1.25 | 35 |
| sZ | 180 | 8 | 1.17-1.20 | 10 | |||||||
| HE2340$-$4443 | 17.07 | 0.9216(3) | 1,2 | 26.3 | … | 2001-11-25 | Z | 180 | 20 | 1.07-1.13 | 20–5 |
| HE2349$-$3800 | 17.46 | 1.6040(4) | 2,4 | 27.4 | 1.93 | 2001-11-25 | J | 180 | 12 | 1.10-1.17 | 35–15 |
| HE2352$-$4010 | 16.05 | 1.5799(4) | 2 | 28.8 | … | 2001-10-05 | J | 180 | 12 | 1.04-1.03 | 60–35 |
| HE2355$-$4621 | 17.13 | 2.3825(3) | 1,2 | 28.9 | … | 2001-11-24 | SH | 180 | 24 | 1.13-1.29 | 20 |
-
a
Apparent B magnitude.
-
b
Redshift, with uncertainty in parenthesis.
-
c
Lines used for redshift calculations: 1: [Oiii]5007, 2: H, 3: Feii4570, 4: H.
-
d
Absolute B magnitude, computed for =75 km s-1Mpc-1, =0, and -correction spectral index =0.6. Note that values are not those reported in the Verón-Cetty & Véron (veron (2000)) catalogue, but have been computed from the apparent B magnitude provided in the HE survey tables.
-
e
Decimal logarithm of the specific flux ratio at 6cm and 4400 Å (effective wavelength of the B band)
-
f
Date refers to time at start of exposure.
-
g
Photometric band.
-
h
Detector Integration Time (DIT) of ISAAC, in seconds.
-
i
Number of exposures with single exposure time equal to DIT.
-
j
Airmass at start and end of exposure.
-
k
S/N at continuum level. Where two values are reported they are for the blue and red side of H respectively. The S/N value is with N estimated at a confidence level i.e., 2rms.
| Object name | W(H)a | W(Feii4570)b | FWHM(Feii4570)c | W(H)d | W([Oiii])d | W([Oiii]5007)d | |
|---|---|---|---|---|---|---|---|
| (1) | (2) | (3) | (4) | (5) | (6) | (7) | |
| HE0003$-$5026 | 81 9 | 25 10 | 5300 3100 | 0.50.3 | 0.980.4 | 6.2 0.7 | |
| HE0005$-$2355 | 74 7 | 11 7 | 7300 4800 | 4.00.6 | 11.91.2 | 42.64 | |
| HE0048$-$2804 | 10210 | 40 15 | 10000 2300 | 1.80.9 | 6.51 | 21.62.2 | |
| HE0122$-$3759 | 41 4 | 37 5 | 2100 1600 | 0 | 01 | 3.0 1 | |
| HE0205$-$3756 | 82 10 | 34 5 | 3600 1800 | 0.80.8 | 0.40.3 | 2.0 1.5 | |
| HE0248$-$3628 | 47 5 | 20 3 | 4500 2300 | 1.10.4 | …e | 3.7 1 | |
| HE0331$-$4112 | 72 8 | 38 7 | 3800 2300 | 0.50.5 | 2.10.5 | 4.7 0.5 | |
| HE0349$-$5249 | 82 9 | 28 3 | 2800 1600 | 0.40.4 | 01 | 1.3 0.6 | |
| HE0353$-$3919 | 70 20 | 40 20 | 4800 2600 | 0 | 0 | 0 | |
| HE0454$-$4620 | 53 6 | 10 10 | … | 0 | 13.72 | 36.44 | |
| HE2202$-$2557 | 45 5 | 20 3 | 5500 2600 | 1.250.4 | 31 | 8.7 0.9 | |
| HE2259$-$5524 | 92 10 | 68 15 | 2700 1600 | 0 | 0 | 0 | |
| HE2305$-$5315 | 48 5 | 40 15 | 1800 1300 | 0 | 0 | 0 | |
| HE2340$-$4443 | 78 8 | 13 3 | 4800 2600 | 2.40.8 | 6.6 0.7 | 15 1.5 | |
| HE2349$-$3800 | 60 6 | 24 4 | 3800 2100 | 2.10.7 | 1.0 0.2 | 8.9 0.9 | |
| HE2352$-$4010 | 51 5 | 21 3 | 1300 1300 | 0 | 0 | 2.0 1.0 | |
| HE2355$-$4621 | 88 9 | 12 2 | 6300 2800 | 2.40.8 | 3.750.5 | 17.12 |
-
a
Rest frame equivalent width of H in Å confidence level uncertainty.
-
b
Rest frame equivalent width of the Feii4570 blend in Å confidence level uncertainty.
-
c
FWHM of lines in the Feii4570 blend and uncertainty at 2, in km s-1. See text for details.
-
d
Rest frame equivalent width of H, [Oiii]4959, and [Oiii]5007 in Å, with uncertainty at 2.
-
e
[Oiii]4959 not visible. [Oiii]5007 is instead well visible.
| Source | FWZIa | FWHMa | A.I.c | Kurt.d | c(1/4) | c(1/2)a | c(3/4)a | c(0.9)a | ||||||||
|---|---|---|---|---|---|---|---|---|---|---|---|---|---|---|---|---|
| (1) | (2) | (3) | (4) | (5) | (6) | (7) | (8) | (9) | (10) | (11) | (12) | (13) | (14) | (15) | (16) | (17) |
| HE0003$-$5026 | 20500 | 400 | 5400 | 400 | 0.02 | 0.10 | 0.32 | 0.05 | 1300 | 900 | 250 | 410 | 520 | 270 | 520 | 180 |
| HE0005$-$2355 | 20100 | 3100 | 5900 | 600 | 0.27 | 0.06 | 0.28 | 0.03 | 3000 | 800 | 1180 | 620 | 410 | 320 | 20 | 190 |
| HE0048$-$2804 | 19700 | 3400 | 7500 | 400 | 0.04 | 0.10 | 0.44 | 0.06 | 300 | 1100 | 590 | 390 | 820 | 420 | 90 | 360 |
| HE0122$-$3759 | 12100 | 2800 | 3400 | 300 | 0.08 | 0.06 | 0.33 | 0.04 | 500 | 300 | 100 | 300 | 30 | 170 | 20 | 110 |
| HE0205$-$3756 | 22200 | 1800 | 5100 | 500 | 0.34 | 0.08 | 0.22 | 0.04 | 2600 | 1200 | 310 | 480 | 680 | 170 | 510 | 130 |
| HE0248$-$3628 | 21200 | 1200 | 4200 | 300 | 0.12 | 0.16 | 0.30 | 0.08 | 800 | 1200 | 330 | 340 | 20 | 230 | 30 | 140 |
| HE0331$-$4112 | 17700 | 1300 | 5500 | 300 | 0.00 | 0.11 | 0.39 | 0.07 | 1600 | 1000 | 990 | 310 | 840 | 280 | 820 | 210 |
| HE0349$-$5249 | 24700 | 2300 | 5100 | 600 | 0.46 | 0.08 | 0.20 | 0.04 | 7800 | 1900 | 1110 | 610 | 670 | 260 | 520 | 170 |
| HE0454$-$4620 | 7700 | 300 | 3400 | 200 | 0.20 | 0.08 | 0.43 | 0.05 | 1500 | 300 | 1120 | 250 | … | 150 | 160 | 110 |
| HE2202$-$2557 | 22600 | 1700 | 7000 | 500 | 0.16 | 0.10 | 0.34 | 0.06 | 1800 | 1300 | 930 | 490 | 280 | 360 | 80 | 270 |
| HE2259$-$5524 | 9700 | 1000 | 2900 | 200 | 0.17 | 0.10 | 0.31 | 0.06 | 800 | 500 | 90 | 180 | 70 | 130 | 20 | 80 |
| HE2305$-$5315 | 15000 | 4900 | 3300 | 500 | 0.17 | 0.09 | 0.20 | 0.04 | 1100 | 700 | 390 | 510 | 110 | 180 | 20 | 80 |
| HE2340$-$4443 | 13700 | 300 | 4200 | 300 | 0.05 | 0.09 | 0.35 | 0.06 | 600 | 700 | 220 | 290 | 180 | 220 | 110 | 150 |
| HE2349$-$3800 | 20600 | 800 | 5200 | 500 | 0.34 | 0.09 | 0.34 | 0.06 | 2300 | 1000 | 930 | 470 | 200 | 180 | 410 | 130 |
| HE2352$-$4010 | 14700 | 2400 | 3200 | 300 | 0.07 | 0.08 | 0.29 | 0.05 | 400 | 500 | 310 | 280 | 90 | 180 | 10 | 100 |
| HE2355$-$4621 | 22000 | 2300 | 6900 | 500 | 0.26 | 0.08 | 0.35 | 0.05 | 2900 | 1000 | 1320 | 460 | 390 | 440 | 20 | 230 |
| Sourcea | Pop.b | (HE) | Shiftc | Notes |
|---|---|---|---|---|
| [km s-1] | ||||
| HE 0005$-$2355 | B | 1.405 | 900 | |
| HE 0122$-$3759 | A | 2.164 | 3400 | |
| HE 0205$-$3756 | A | 2.404 | 3000 | H profile of Pop. B; borderline |
| HE 0248$-$3628 | A | 1.516 | 2400 | |
| HE 2202$-$2557 | B | 1.5295 | 600 | |
| HE 2352$-$4010 | A | 1.540 | 4600 | very low W(Civ1549), extreme Pop. A |
| HE 2355$-$4621 | B | 2.380 | 200 | excellent spectrum; |
| could be (Civ1549BC) (Civ1549NC) |
-
a
Of the other sources with , the spectrum of HE 0349$-$5249 is not available to us. The spectrum of HE 2349$-$3800 is too noisy even for rough shift measurements.
-
b
Classification done according to the luminosity-dependent relationship FWHM() km s-1.
-
c
Shift measured as , where is as reported in Table 1, and (Civ1549) refers to a measurement of the upper half of the profile by Gaussian fitting. No attempt was made to deconvolve Civ1549BC and Civ1549NC.
| Parametersa | Sampleb | Spearman’s | |||
|---|---|---|---|---|---|
| All | RQd | RLd | |||
| (1) | (2) | (3) | (4) | (5) | |
| FWHM | M03 | 0.159 (0.020) | 0.066 (0.418) | 0.092 (0.463) | |
| FWHM | M03+VLT/ISAAC | 0.165 (0.012) | 0.105 (0.183) | 0.087 (0.475) | |
| FWHM | PG+VLT/ISAAC | 0.330 (0.001) | 0.261 (0.016) | 0.155 (0.561) | |
| UL | M03 | 0.222 (0.001) | 0.087 (0.290) | 0.159 (0.202) | |
| UL | M03+VLT/ISAAC | 0.160 (0.015) | 0.038 (0.623) | 0.079 (0.515) | |
| UL | PG+VLT/ISAAC | 0.069 (0.489) | 0.011 (0.922) | 0.017 (0.951) | |
| W(H) | M03 | 0.073 (0.288) | 0.136 (0.096) | 0.088 (0.481) | |
| W(H) | M03+VLT/ISAAC | 0.056 (0.734) | 0.088 (0.2695) | 0.029 (0.810) | |
| W(H) | PG+VLT/ISAAC | 0.169 (0.090) | 0.090 (0.4015) | 0.689 (0.010) | |
| W(Feii4570) UL | M03 | 0.199 (0.004) | 0.019 (0.8184) | 0.156 (0.213) | |
| W(Feii4570) UL | M03+VLT/ISAAC | 0.184 (0.005) | 0.001 (0.990) | 0.174 (0.157) | |
| W(Feii4570) | PG+VLT/ISAAC | 0.130 (0.191) | 0.021 (0.847) | 0.439 (0.100) | |
| W([Oiii]5007) | M03 | 0.300 () | 0.464 () | 0.317 (0.012) | |
| W([Oiii]5007) | M03+VLT/ISAAC | 0.375 () | 0.541 () | 0.319 (0.009) | |
| W([Oiii]5007) | PG+VLT/ISAAC | 0.332 (0.001) | 0.423 (0.0001) | 0.300 (0.261) | |
-
a
Correlated against (; km s-1 Mpc-1).
-
b
M03: 215 objects in Marziani et al. (2003a ); VLT/ISAAC: 17 observations of this paper.
-
c
Computed with the assumption that Feii4570 upper limits (UL) are censored data. If no UL are present, is equal to the Spearman’s rank correlation coefficient . In parenthesis, we report the probability that a correlation is not present.
-
d
M03: 65 RL, 150 RQ; M03+VLT/ISAAC: 69 RL, 162 RQ; PG+VLT/ISAAC: 102 (85 PG) sources; 87 RQ and 15 RL.
References
- (1) Barth, A. J., Martini, P., Nelson, C. H., & Ho, L. C. 2003, ApJ, 594, L95
- (2) Boroson, T.A. 2002, ApJ, 565, 78
- (3) Boroson, T.A., & Green, R.F. 1992, ApJS, 80, 109
- (4) Carswell, R. F., Whelan, J. A. J., Smith, M. G., Boksenberg, A., & Tytler, D. 1982, MNRAS, 198, 91
- (5) Corbett, E. A., Croom, S.M., Boyle, B.J., et al. 2003, MNRAS, 343, 705
- (6) Croom, S. M., Rhook, K., Corbett, E.A., et al. 2002, MNRAS, 337, 275
- (7) Dietrich, M., Appenzeller, I., Vestergaard, M., & Wagner, S. J. 2002, ApJ, 564, 581
- (8) Eracleous, M., & Halpern, J. P. 2003, ApJ, 599, 886
- (9) Espey, B. R., Carswell, R. F., Bailey, J. A., Smith, M. G., & Ward, M. J. 1989, ApJ, 342, 666
- (10) Freudling, W., Corbin, M. R., & Korista, K. T. 2003, ApJ, 587, L67
- (11) Gaskell, C.M. 1982, ApJ, 263, 79
- (12) Grupe, D., Beuermann, K., Mannheim, K., & Thomas, H.-C. 1999, A&A, 350, 805
- (13) Hamann, F., & Ferland, G. 1999, ARA&A, 37, 487
- (14) Isobe, T., Feigelson, E. D., & Nelson, P. I. 1986, ApJ, 306, 490
- (15) Joly, M., Collin-Souffrin, S., Masnou, J. L., & Nottale, L. 1985, A&A, 152, 282
- (16) Kaspi, S., Smith, P.S., Netzer, H., et al. 2000, ApJ, 533, 631
- (17) Marziani, P., Sulentic, J. W., Dultzin-Hacyan, D., Calvani, M., & Moles, M. 1996, ApJS, 104, 37 (M96)
- (18) Marziani, P., Sulentic, J. W., Zwitter, T., Dultzin-Hacyan, D., & Calvani, M. 2001, ApJ, 558, 553
- (19) Marziani, P., Zamanov, R. K., Sulentic, J. W., & Calvani, M. 2003a, MNRAS, 345, 1133
- (20) Marziani, P., Sulentic, J.W., Zamanov, R., et al. 2003b, ApJS, 145, 199 (M03b)
- (21) Mathur, S. 2000, MNRAS, 314, L17
- (22) Matteucci, F., & Recchi, S. 2001, ApJ, 558, 351
- (23) McIntosh, D. H., Rix, H.-W., Rieke, M. J., & Foltz, C. B. 1999, ApJ, 517, L73 (Mc99)
- (24) McLure, R. J., & Dunlop, J. S. 2004, MNRAS, in press [arXiv:astro-ph/0310267]
- (25) Murayama, T., Taniguchi, Y., Evans, A. S., et al. 1998, AJ, 115, 2237
- (26) Oya, S., Iwamuro, F., Tsukamoto, H., & Maihara, T. 1998, PASJ, 50, 163
- (27) Richards, G. T., Vanden Berk, D. E., Reichard, T. A., et al. 2002, AJ, 124, 1
- (28) Sulentic, J. W., Marziani, P., Zwitter, T., & Calvani, M. 1995, ApJ, 438, L1
- (29) Sulentic, J.W., Marziani, P., & Dultzin-Hacyan, D. 2000a, ARA&A, 38, 521
- (30) Sulentic, J. W., Zwitter, T., Marziani, P., & Dultzin-Hacyan, D. 2000b, ApJ, 536, L5 (S00b)
- (31) Sulentic, J. W., Marziani, P., Zamanov, R., et al. 2002, ApJ, 566, L71
- (32) Sulentic, J. W., Zamfir, S., Marziani, P., et al. 2003, ApJ, 597, L17
- (33) Véron-Cetty, M.-P., & Véron, P. 2000, A Catalogue of Quasars and Active Nuclei (Garching: ESO)
- (34) Ulrich, M.-H. 1989, A&A, 220, 71
- (35) Wilkes, B. J. 1986, MNRAS, 218, 331
- (36) Wilkes, B. J., Kuraszkiewicz, J., Green, P. J., Mathur, S., & McDowell, J. C. 1999, ApJ, 513, 76
- (37) Williams, R. J., Pogge, R. W., & Mathur, S. 2002, AJ, 124, 3042
- (38) Wisotzki, L. et al. 2000, A&A, 358, 77
- (39) Yuan, M., & Wills, B. 2003, ApJ, 593, 11
- (40) Zamanov, R., & Marziani, P. 2002, ApJL, 571, L77
- (41) Zamanov R., Marziani P., Sulentic J.W., et al. 2002, ApJ, 576, 9