The Large Local Hole in the Galaxy Distribution: The 2MASS Galaxy Angular Power Spectrum
Abstract
We present new evidence for a large deficiency in the local galaxy distribution situated in the 4000 deg2 APM survey area. We use models guided by the 2dF Galaxy Redshift Survey (2dFGRS) as a probe of the underlying large-scale structure. We first check the usefulness of this technique by comparing the 2dFGRS model prediction with the -band and -band number counts extracted from the 2MASS and 2dFGRS parent catalogues over the 2dFGRS Northern and Southern declination strips, before turning to a comparison with the APM counts. We find that the APM counts in both the and -bands indicate a deficiency in the local galaxy distribution of 30 per cent to 0.1 over the entire APM survey area. We examine the implied significance of such a large local hole, considering several possible forms for the real-space correlation function. We find that such a deficiency in the APM survey area indicates an excess of power at large scales over what is expected from the correlation function observed in the 2dFGRS correlation function or predicted from CDM Hubble Volume mock catalogues. In order to check further the clustering at large scales in the 2MASS data, we have calculated the angular power spectrum for 2MASS galaxies. Although in the linear regime (), CDM models can give a good fit to the 2MASS angular power spectrum, over a wider range () the power spectrum from Hubble Volume mock catalogues suggests that scale-dependent bias may be needed for CDM to fit. However, the modest increase in large-scale power observed in the 2MASS angular power spectrum is still not enough to explain the local hole. If the APM survey area really is 25 per cent deficient in galaxies out to , explanations for the disagreement with observed galaxy clustering statistics include the possibilities that the galaxy clustering is non-Gaussian on large scales or that the 2MASS volume is still too small to represent a ‘fair sample’ of the Universe. Extending the 2dFGRS redshift survey over the whole APM area would resolve many of the remaining questions about the existence and interpretation of this local hole.
Dept. of Physics, Univ. of Durham, South Road, Durham DH1 3LE, UK
1. Introduction
Since the publication of the APM survey (Maddox et al. 1990) the deficit of galaxies in the resulting number counts has remained a troublesome issue (e.g. Metcalfe et al. 1995); is this deficiency (50 per cent at B=16) due to real features in the galaxy distribution, galaxy evolution or errors in the photometry? If the observed deficit were exclusively due to an underdensity in the galaxy distribution over 4000 deg2 in the Southern Galactic Cap (SGC), it would be unexpectedly large for our present understanding of large-scale structure. However, invoking strong galaxy evolution at low redshifts is also problematic as it requires the presence of a high-redshift tail in the which is not apparent.
Evidence for the presence of a large zero-point error in the APM photometry has recently been provided by Busswell et al. (2004), who find an offset of 0.31 magnitudes with respect to CCD -band photometry for 725 matched galaxies over 297 deg2 below =17.15. Together with a small correction to the fainter 17 APM photometry by Metcalfe et al. (1995), the APM counts are now more reasonable with only a 25 per cent deficit at =16.
Recently, large redshift surveys have also begun to elucidate a possible cause of the low APM counts. The 2dF Galaxy Redshift Survey (2dFGRS; Colless et al. 2003), the Las Campanas Redshift Survey (LCRS; Shectman et al. 1996), the ESO Slice Project (ESP; Vettolani et al. 1997) and the Durham-UKST redshift survey (D-UKST; Ratcliffe et al. 1998) are all situated within the APM survey area and persistently indicate large deficiencies in the local galaxy distribution. In particular, the 2dFGRS Southern strip indicates the presence of a 30 per cent deficiency in the local galaxy distribution to 0.1.
In order to determine the effect of this observed structure on the number counts, Frith et al. (2003) compared optical counts on the 2dFGRS strips along with the corresponding -band counts extracted from the 2 Micron All Sky Survey (2MASS; Jarrett et al. 2000) second incremental release catalogue, to models guided by the 2dFGRS . They found good agreement between the optical and -band counts and the expected trends defined by the 2dFGRS , indicating that the number counts in the 2dFGRS fields are a direct consquence of real features in the galaxy distribution and that low redshift luminosity evolution does not play a significant role. However, due to incompleteness in the 2MASS second incremental release, a comparison between the APM survey area number counts and the corresponding -band counts could not be made.
Here, we aim to corroborate the agreement found between the number counts and the 2dFGRS models over the 2dFGRS strips and also probe the galaxy distribution over the entire APM survey area using the newly completed 2dFGRS and 2MASS data. To investigate the cosmological relevance of the implied under-density, we calculate the significance of such a feature in the galaxy distribution assuming certain forms for the two-point correlation function. Finally, we calculate the 2MASS galaxy angular power spectrum to determine whether the presence of power at large scales might explain the deficiency. This analysis is more fully explained in the forthcoming paper Frith et al. (2004).
2. Probing the Local Galaxy Distribution

In order to corroborate the agreement between the number counts over the 2dFGRS strips and models guided by the 2dFGRS (Frith et al. 2003), we have determined the number counts in the -band from the 2dFGRS parent catalogue and the -band from 2MASS full release data. These are shown in Figs. 1 and 2 for an approximately equivalent magnitude range for the 400 deg2 2dFGRS Northern declination field and 600 deg2 2dFGRS Southern field respectively, together with models incorporating the corresponding 2dFGRS . These models are formed through varying the luminosity function parameter *, such that the luminosity function normalisation varies as a function of redshift to match the observed 2dFGRS . These models are described in more detail by Frith et al. (2003).
The counts are in good agreement with these models and confirm the earlier work of Frith et al. (2003) suggesting that features in the bright number counts are exclusively due to real structures in the local galaxy distribution. The fact that the deficit in the counts can be explained purely by features in the and that this agreement is present to the same extent in different passbands suggests that deficiencies in bright magnitude galaxy counts are unlikely to be caused by strong luminosity evolution at low redshifts.
Having verified the usefulness of number counts as a probe of the local galaxy distribution, we now wish to examine the counts over the much larger APM survey area in order to determine to what extent the observed deficiency in the optical APM counts may be due to a real underdensity, and whether the deficit in the optical counts is complemented by a similar deficit in the 2MASS -band counts.


In Fig. 3 we show the optical and -band counts for the 4000 deg2 APM survey area. In the optical count plots we show both the Metcalfe et al. (1995) corrected APM survey area counts and also the new counts incorporating the 0.31 magnitude zeropoint correction to the 17.15 APM photometry determined by Busswell et al. (2004). We also include the models incorporating the 2dFGRS Southern as in Fig. 2. Surprisingly, the -band and the corrected -band counts are in reasonable agreement with these models. This suggests that the form of the galaxy distribution observed in the 2dFGRS Southern field (including a 30 per cent deficiency to =0.1) may extend over the entire APM field of 4000 deg2, implying a deficiency of 30 per cent over 1.2107 Mpc3. This is supported by other redshift surveys over the APM field including the LCRS, D-UKST and ESP which indicate similar deficiencies over smaller solid angles.
3. The Significance of the APM Under-Density
In order to investigate the cosmological relevance of this under-density, we now wish to determine the significance of such a feature using assumed forms of the two point correlation function. We use the 3-dimensional analogue of equation 36.6 in Peebles (1980):
| (1) |
where is the value of the two-point correlation function between two volume elements and . is the entire volume of the survey, is the mean galaxy density such that is the expected number of galaxies in the survey volume. In the first instance, we take a power law form for the correlation function () to a limiting distance , beyond which the clustering is assumed to be insignificantly small.
For the APM underdensity, we assume a deficiency in the galaxy distribution of 25 per cent to Mpc (=0.1) over 4000 deg2. We use both the 2dFGRS (Hawkins et al. 2003, =-1.67) and CDM (from the Hubble Volume mock catalogue, Carlton Baugh - priv. comm.) real-space correlation functions. The corresponding significance estimates are shown in Table 1.
| (Mpc ) | significance | |
|---|---|---|
| 2dFGRS | 40 | 6.0 |
| 2dFGRS | 300 | 2.8 |
| CDM | 300 | 4.6 |
Since the real-space correlation function is poorly constrained beyond 40Mpc, we take the form of the 2dFGRS correlation function beyond this scale to two extremes; firstly, that there is no structure (=40Mpc ), and secondly that the power law form continues effectively to infinity (=300Mpc ). The Hubble Volume mock catalogue real-space correlation function has a break at 40Mpc, beyond which the slope is much steeper. Only in the extreme case where the power law extends to 300Mpc does the APM deficiency start to be explained by the correlation function. This indicates that the local hole can only be explained if the large-scale correlation of galaxies is significantly more extended than detected by the 2dFGRS or predicted by the CDM model.
We can also gain a handle on the significance of the under-density more directly by using the 2-dimensional equivalent of equation 1 which employs the 2-point angular correlation function. We take the 12.5 deficiency in the 2MASS -band number counts over the APM survey area of 25 per cent and the best fit angular correlation function for 12.5 Hubble Volume mocks (a two power law fit with a break at 10∘, Frith et al. 2004). This magnitude limit is chosen to match the peak in the selection function to the redshift range of interest. The implied significance with this two power law form for the angular correlation function (and no cut) is 5.0.
4. The 2MASS Galaxy Angular Power Spectrum
The under-density in the APM survey area described in section 2 may imply the presence of excess power at large scales over that seen in the 2dFGRS or the CDM Hubble Volume. In order to try and probe the form of the clustering at extremely large scales we compute the angular power spectrum of 2MASS galaxies. The angular power spectrum is useful in determining the form of galaxy fluctuations at extremely large scales. The 2MASS survey is particularly useful for applying this technique as it covers almost the entire sky and so has a well-behaved window function.
We compute the angular power spectrum for 13.5 (corrected for extinction), 20∘ 2MASS galaxies using a spherical harmonic expansion of the number density:
| (2) |
(Peebles 1973; Scharf et al. 1992) The coefficients of this expansion, , are estimated over the observed solid angle :
| (3) |
where = is the observed number of galaxies per steradian. The angular power is then determined as the ratio of the observed signal to the expected Poisson fluctuation, :
| (4) |
such that =1 corresponds to a random distribution for all-sky coverage.
In order to compare the empirical power spectrum to some cosmological prediction, we take the transfer function fitting formulae of Eisenstein & Hu (1998) which are essentially perfect in the linear regime ( 30). We take a linear biasing scheme such that =. The three dimensional power spectrum is then collapsed to two dimensions using a Bessel function transform, and the 2MASS selection function is imposed upon it (Scharf et al. 1992).
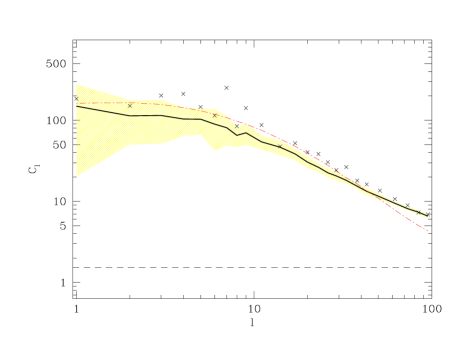
In Fig. 4 we show the angular power spectrum for 518,576 , 20∘ 2MASS galaxies. Also shown are the mean and 1 spread from 27 mock 2MASS catalogues constructed from the CDM Hubble Volume mock catalogue, and the corresponding linear model for the input Hubble Volume mock catalogue parameters. In each case, we take a bias of =1.0. We compute the angular power spectrum to =100 only, since beyond this the angular scales involved become dominated by uncertain forms to the bias.
The 2MASS angular power spectrum is in reasonable agreement with the unbiased mock angular power spectra although the 2MASS angular power spectrum slope is steeper, implying some discrepancy with the Hubble Volume mock in the unbiased case. Therefore it seems that either the Hubble Volume mock angular power spectrum does not agree with the 2MASS angular power spectrum or there exists a scale-dependent bias. With the introduction of scale-independent bias this discrepancy may clearly shift to smaller scales where there is good agreement in the unbiased case; clearly, the issue of bias is critical in determining the level of disagreement between the Hubble Volume mock catalogue and 2MASS. If we take a bias of (Maller et al. 2003), the disagreement at large scales (30) is at the 3 level. The model linear prediction is in good agreement with the mock 2MASS power spectra below 30 although the model slope is shallower than the mean mock power spectrum; beyond this scale non-linear effects begin to dominate.
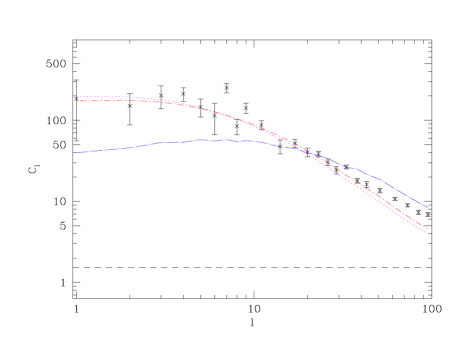
We wish to probe to what extent the 2MASS angular power spectrum discriminates between different cosmologies, and whether it is in disagreement with CDM. In Fig. 4 we show the 2MASS angular power spectrum as before with errorbars taken from the 1 spread of the 27 mock 2MASS power spectra; in doing this we assume that the form of the clustering in the Hubble Volume mocks is realistic at the scales of interest. Along with this we show a CDM linear prediction using the best-fit WMAP-2dFGRS parameters, the Hubble Volume input parameter prediction as before, and an SCDM prediction. To these models we apply a linear bias of =1.1 (Maller et al. 2003; Frith et al. 2004).
Using this bias prescription, the CDM linear predictions derived from the WMAP-2dFGRS best-fit and the Hubble Volume mock input parameters are in excellent agreement with the 2MASS angular power spectrum to 40. The SCDM prediction gives a very poor fit to the 2MASS angular power spectrum, indicating that this analysis may provide useful constraints on the cosmology; this is examined by Frith et al. (2004).
While there appears to be an excess of power in the 2MASS galaxy angular power spectrum compared with the CDM Hubble Volume mocks at large scales, it is not enough to account for the local hole described in sections 2 and 3: We use a Bessel function transform to convert the angular power spectrum to the 2-point angular correlation function; the result is in good agreement with the 2MASS correlation function determined by Maller et al. (2003), and so the implied significance of the local hole described in sections 2 and 3 remains high. Therefore, somewhat paradoxically, the local hole in the 2MASS data in the APM survey area does not seem to be explained by the angular power spectrum or 2-point correlation functions from the same 2MASS data; possible explanations are discussed below.
5. Summary
In order to investigate the number count deficiency in the SGC detected by the APM survey, we have used models guided by the 2dFGRS as predictions of the -band and -band number counts. First, we wanted to verify the usefulness of this technique as a probe of the underlying large-scale structure and so compared the 2dFGRS models to the corresponding number counts extracted from the 2dFGRS parent catalogue and the 2MASS full release catalogue for the 2dFGRS fields. In both passbands and both the Northern and Southern declination fields, the predicted counts agree very well with the observed counts.
Using this technique, we then probed the galaxy distribution over the much larger APM field of 4000 deg2. The 2MASS counts and the APM counts (corrected for a zero-point offset of 0.31 magnitudes found with respect to recent -band CCD photometry (Busswell et al. 2004)) are in good agreement, and suprisingly, agree well with the 2dFGRS Southern model. This suggests that a similar deficiency to the 2dFGRS Southern distribution exists over the entire APM field; that would be a 30 per cent deficiency to 0.1 over 4000 deg2.
This deficiency, while less extreme than the galaxy distribution implied by the original APM counts, poses a significant problem for our present understanding of clustering and possibly a CDM cosmology. We calculate the significance of such an underdensity, considering several possible forms for the real-space correlation function. In all cases the APM deficiency as described above represents a 3 fluctuation. In particular we found that the APM deficiency represents a 4.6 fluctuation using the CDM Hubble Volume mock correlation function.
The deficiency in the APM survey area therefore suggests an excess of power which is incompatible with the 2dFGRS or Hubble Volume mock =1 CDM angular correlation functions; only an extension of the small scale 2dFGRS =-1.67 power law correlation function would explain the hole. In order to investigate this discrepancy and probe the galaxy clustering at extremely large scales, we finally determined the angular power spectrum of 2MASS , galaxies and also 27 mock 2MASS catalogues constructed from the CDM Hubble Volume mock catalogue. There is a discrepancy between the two in the range , in that the Hubble Volume power spectrum slope is significantly flatter. Inclusion of linear bias will therefore not improve this agreement. However, we find that the increased power at large scales is still not large enough to explain the deficiency in the APM survey area. In the more restricted range of , where the effect of non-linear clustering and any scale dependent bias may be assumed to be less, CDM models can give a good fit to the 2MASS power spectrum and the constraints on the cosmological parameters from fitting these data are explored by Frith et al. (2004).
In conclusion, the issue of the large local hole has yet to be resolved. The new data from the 2dFGRS and 2MASS catalogues along with the large -band CCD survey of Busswell et al. (2004) indicates that the low APM counts may be due partly to a zero-point error in the bright APM photometry and partly to a large deficiency in the galaxy distribution stretching to =0.1. The angular power spectrum of the 2MASS galaxies, although steeper than the Hubble Volume CDM mock catalogue, still has too shallow a slope to explain the hole. This may not be too surprising since the depth of 2MASS is comparable to the previous 17 surveys in the APM survey area which only sampled the deficient volume with . So it is still possible that even the entire 2MASS volume may still not represent a fair sample of the Universe. Another possible explanation is that the clustering is non-Gaussian on the scales of 150-300Mpc. Although this seems unlikely, there have recently been tentative reports of non-Gaussianity detected on even larger scales in the WMAP CMB data (e.g. Eriksen et al. 2004). The final possibility is that the agreement between the and -band counts predicted on the basis of 2dFGRS models and the data is coincidental and this has caused us to overestimate the angular size of the deficiency in the APM survey area. A new galaxy redshift survey over the whole 4000deg2 APM survey area would help resolve this question.
References
- Bennett et al. (2003) Bennett, C.L. et al. 2003, ApJS, 148, 1
- Busswell et al. (2004) Busswell, G.S., Shanks, T., Outram, P.J., Frith, W.J., Metcalfe, N. & Fong, R. 2004, accepted by MNRAS, astro-ph/0302330
- Colless et al. (2003) Colless, S. et al. 2003, astro-ph/0306581
- Eisenstein & Hu (1998) Eisenstein, D.J. & Hu, W. 1998, ApJ, 496, 605
- Eriksen et al. (2004) Eriksen, H.K., Novikov, D.I., Lilje, P.B., Banday, A.J. & Gorski, K.M. 2004, astro-ph/0401276
- Frith et al. (2003) Frith, W.J., Busswell, G.S., Fong, R., Metcalfe, N. & Shanks, T. 2003, MNRAS, 345, 1049
- Frith et al. (2004) Frith, W.J., Shanks, T. & Outram, P.J. 2004, in preparation
- Hawkins et al. (2003) Hawkins, E. et al. 2003, MNRAS, 346, 78
- Jarrett et al. (2000) Jarrett, T.H., Chester, T., Cutri, R., Schneider, S., Skrutskie, M. & Huchra, J.P. 2000, AJ, 119, 2498
- Maller et al. (2003) Maller, A.H., McIntosh, D.H., Katz, N. & Weinberg, M. 2003, astro-ph/0304005
- Maddox et al. (1990) Maddox, S.J., Sutherland, W.J., Efstathiou, G. & Loveday, J. 1990, MNRAS, 243, 692
- Metcalfe et al. (1995) Metcalfe, N., Fong, R. & Shanks, T. 1995, MNRAS, 274, 769
- Peebles (1973) Peebles, P.J.E.. 1973, ApJ, 185, 413
- Peebles (1980) Peebles, P.J.E. 1993, Principles of Physical Cosmology, Princeton University Press
- Ratcliffe et al. (1998) Ratcliffe, A. et al. 1998, MNRAS, 300, 417
- Scharf et al. (1992) Scharf, C., Hoffman, Y., Lahav, O. & Lynden-Bell, D. 1992, MNRAS, 256, 229
- Shectman et al. (1996) Shectman, S.A., Landy, S.D., Oemler, A., Tucker, D.L., Lin, H., Kirshner, R.P. & Schechter, P.L. 1996, ApJ, 470, 172
- Vettolani et al. (1997) Vettolani, G. et al. 1997, A&A, 325, 954