A Measurement of the UHECR Spectrum with the HiRes FADC Detector
Abstract
We have measured the energy spectrum of ultra-high energy cosmic rays (UHECR) with the HiRes FADC detector (HiRes-2) in monocular mode. A detailed Monte Carlo simulation of the detector response to air showers has been used to calculate the energy dependent acceptance of the air fluorescence detector. The measured spectrum complements the measurement by the HiRes-1 detector down to lower energies. Systematic effects of the assumed input spectrum and composition on the aperture are presented, as well as systematics due to the atmosphere.
1 Introduction: Mono vs. Stereo
The two air fluorescence detectors of the HiRes experiment provide stereoscopic observation of extensive air showers (EAS), initiated in the atmosphere by ultra-high energy cosmic rays. The stereo view leads to an improved resolution in the reconstructed arrival direction and energy of the primary cosmic ray particle due to better constraints on the location of the shower axis. However, even if observation with both ”eyes” is the preferred method, there are good reasons for the analysis of monocular data. Since the HiRes-1 detector began operation two years before HiRes-2, the HiRes-1 dataset provides larger statistics than the stereo data. This is especially significant in the measurement of the cosmic ray energy spectrum at energies around the GZK flux suppression.
The HiRes-2 monocular dataset, which will be presented here, offers a different advantage: It contains well reconstructed events at energies lower than HiRes-1 mono and stereo events. The HiRes-2 detector uses FADC electronics to record signals at a frequency of 10 MHz, which leads to a better time resolution than is achieved with the sample-and-hold electronics of the HiRes-1 detector. Furthermore, the two rings of mirrors of HiRes-2 provide twice the coverage in elevation angle that is achieved with the single ring of mirrors of the HiRes-1 detector. Events recorded with HiRes-2 can be reliably reconstructed down to energies of about . This is also about a decade lower in energy than the lower limit for stereo events, which is constrained by the separation between the two detectors: Events with the lowest observable energy lie half-way between the two detectors and have thus a distance of about from each detector, which sets a lower limit to their observable energies.
The HiRes-2 measurement of the UHECR spectrum is intended to complement the HiRes-1 measurement at lower energies, where the features of the ”second knee” and the ”ankle” provide recognizable signatures of the cosmic ray spectrum, which can be used to compare the HiRes measurements to other experiments.
2 Monte Carlo Simulation
The calculation of the cosmic ray energy spectrum from the measured event distribution is a problem of unfolding the true spectrum of cosmic rays at their arrival in the earth’s atmosphere from the distorsions of the detector response, i.e. the acceptance of the detector and its limited resolution.
The purpose of the Monte Carlo (MC) simulation in the HiRes experiment is to give an accurate description of the geometry and energy dependent acceptance of the detector and of its resolution. The simulation consists basically of two parts: an air shower generator and a detector response MC. In the first part of the simulation, large sets of air showers are generated with several discrete energies and with different primary particles, using CORSIKA [1] and QGSJet [2]. Their profiles are saved in a library of air showers. From this library, the individual profiles can be read into the detector response MC and used to simulate EAS at different geometries. Energies in the detector response MC are chosen from a given continuous input spectrum. Profiles from library showers generated at a nearby, discrete energy are scaled to the chosen energy.
The detector response simulation includes: generation of fluorescence and Čerenkov light at the shower, propagation of light through the atmosphere, ray tracing of photons through the optical path of the detector, PMT response to the signal, simulation of noise, electronics and trigger simulation. Events accepted by the trigger are written out in the same format as the data.
Two databases have been generated and are read by the detector response MC in order to allow event simulation under the exact data taking conditions. A trigger database contains information on the livetime of the detector, dead mirrors and variable trigger settings. An atmospheric database provides hourly measurements of the aerosol content of the atmosphere. An average atmosphere has been used in this analysis to allow a direct comparison with the HiRes-1 measurement.
3 Event Reconstruction and Analysis
As the air shower develops in the atmosphere, its image sweeps across the photomultiplier tube clusters, causing a track of triggered phototubes. The first step in the reconstruction of an event is the determination of the shower-detector plane from a fit to this track. The geometry of the shower axis within this plane and the distance of the shower from the detector are found in the HiRes-2 monocular reconstruction with a fit of the times of triggered phototubes versus their angle along the shower track. Once the location and geometry of the shower axis have been determined, the charged particle profile of the air shower is reconstructed from the distribution of recorded FADC counts in triggered phototubes. Absolute calibration of the photomultiplier tubes with a calibrated light source and measurements of the aerosol density of the atmosphere with steerable lasers ensure the accurate calculation of the shower profile from the FADC signals. Using the atmosphere as a calorimeter, we can calculate the total deposited energy of the shower from the charged particle profile after subtraction of Čerenkov light. Adding about for ”missing energy”, which is deposited into the ground in muons and neutrinos or lost in nuclear excitations, yields the total energy of the primary cosmic ray particle.
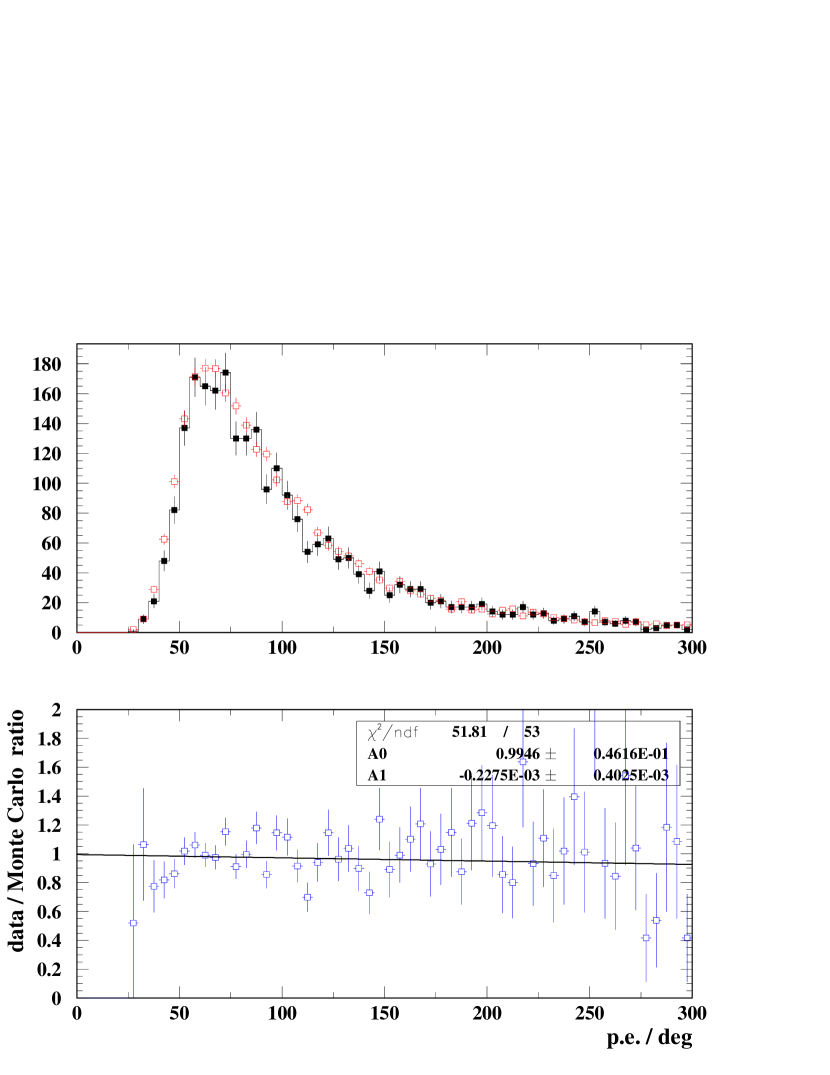
The same quality cuts and the same reconstruction procedure are applied to both data and simulated events, which allows us to directly compare all the details of our MC simulation against the actual experiment. An extensive set of data-MC comparison plots—including e.g. the distance of air showers, their angular distributions, number of triggered mirrors and phototubes, reconstructed profiles and energies, etc.—tests how well our MC simulates the actual detector. An example for the overall very good agreement between data and MC is shown in Figure 1: The distributions of photoelectrons per degree of track are measures of the amount of light that is seen in the data and generated in the MC. The simulation closely follows the data distribution. More details on the HiRes-2 analysis can be found in [3].
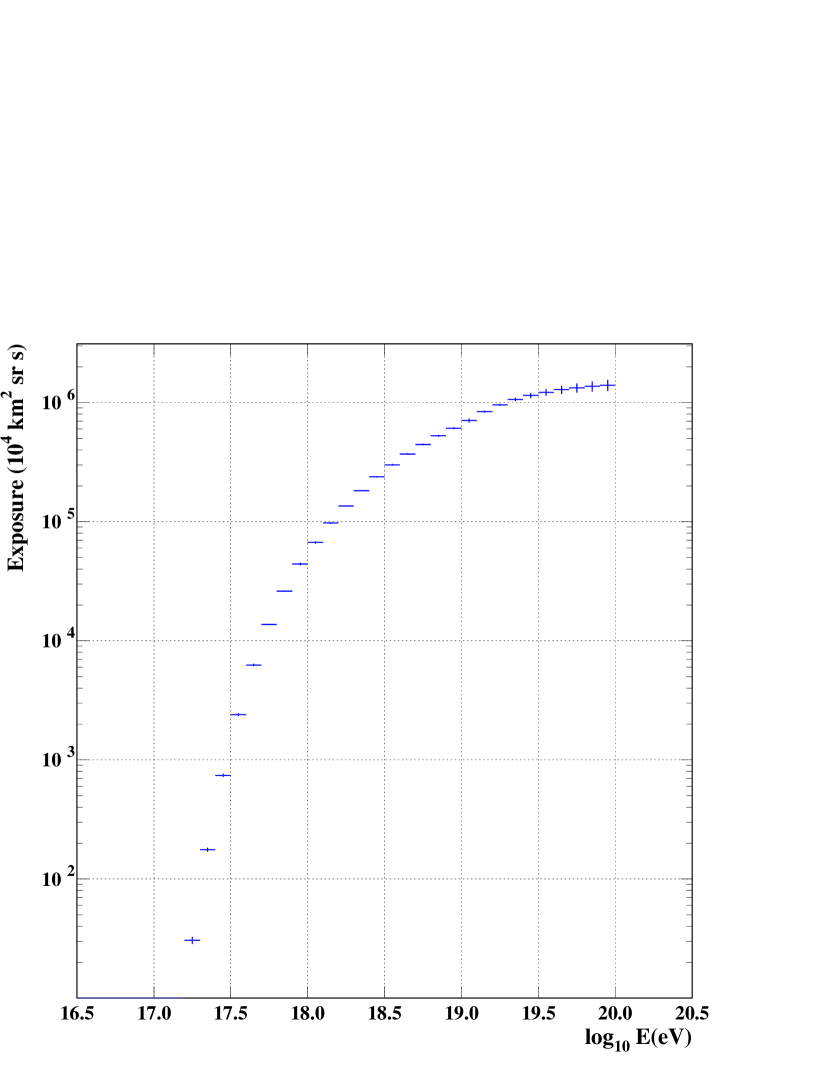
With our MC simulation proven to be realistic, we can calculate the acceptance of the HiRes-2 detector, which is given by the ratio of fully reconstructed events () over all generated events () in each energy bin. Multiplying the acceptance by the geometrical aperture and the livetime of the detector (about 531 hours of analyzed data) yields the exposure of the detector. We fit the simulated exposure to an appropriately chosen function in order to smooth out statistical fluctuations. The result is shown in Figure 2.
The differential flux in each energy bin can now be calculated as:
where is the number of data events in the energy bin and is the binwidth.
4 The HiRes-2 Spectrum
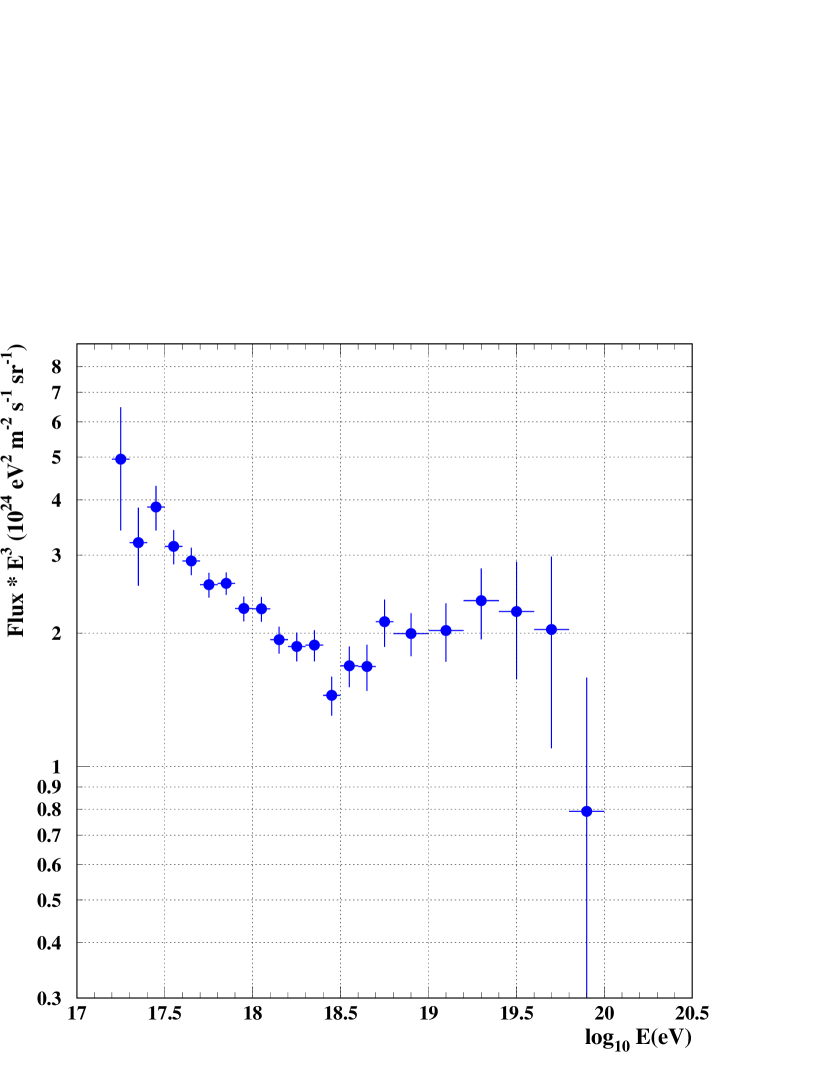
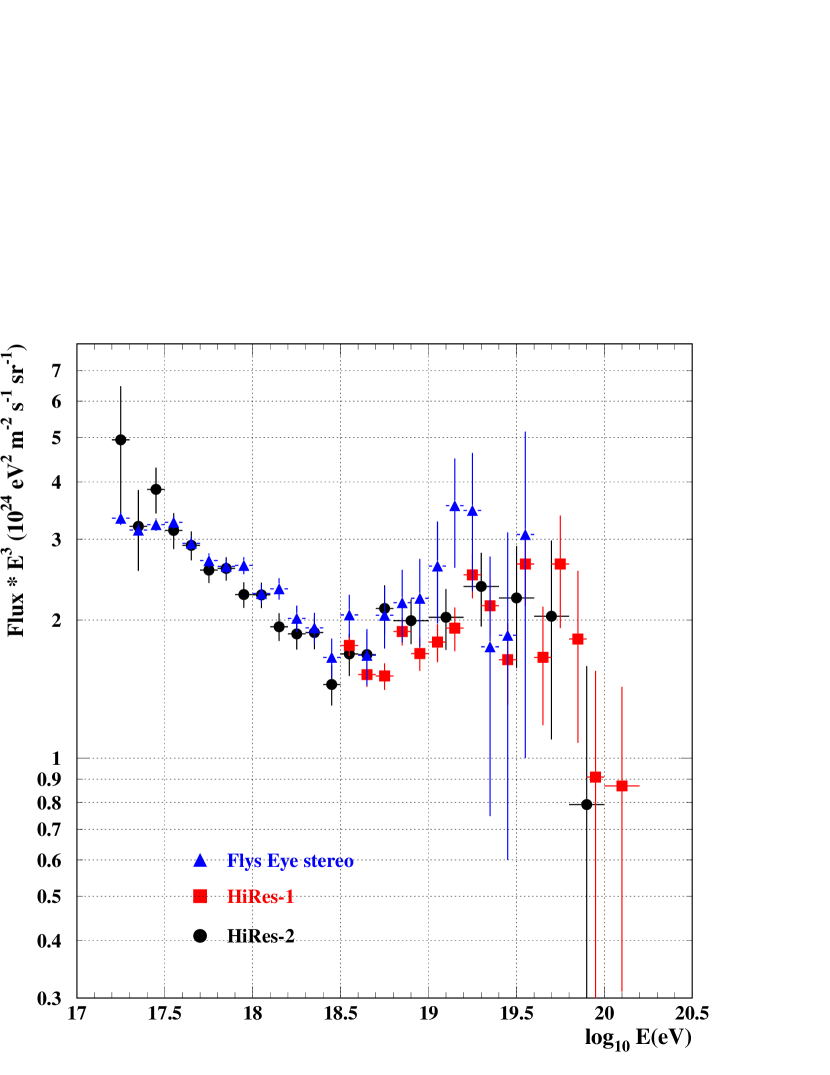
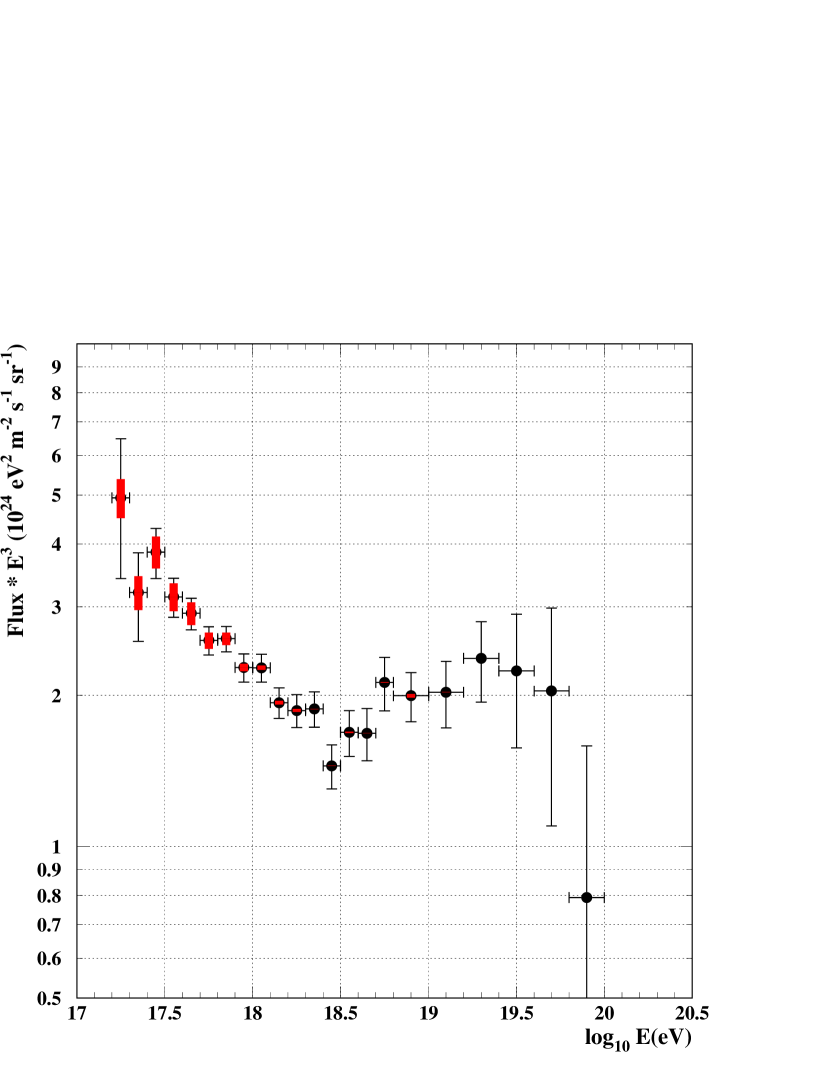
The energy spectrum measured by the HiRes-2 detector on clear, moonless nights from December 1999 to September 2001 ( events) is shown in Figure 3. We observe the ”ankle” at about . Our updated measurement is consistent with the GZK flux suppression, but statistics at the high energy end are low. Figure 4 shows the spectra measured by HiRes-1, HiRes-2 and the Fly’s Eye stereo experiment superimposed. The two monocular HiRes spectra agree with each other and with our predecessor experiment. There is a slight difference in the slopes of the HiRes and Fly’s Eye spectra above the ”ankle”, which is most likely due to a different atmospheric model used in the Fly’s Eye experiment. The low energy end of the HiRes-2 spectrum is consistent with the Fly’s Eye spectrum. However, due to low statistics, HiRes cannot claim detection of the ”second knee”, seen by Fly’s Eye at .
5 Studies of Systematics
The main systematic uncertainties in the HiRes monocular spectra have been reported in [4]: Uncertainties in the absolute phototube calibration, fluorescence yield, ”missing energy” correction and atmospheric calibration add up to a total uncertainty in the flux of . Here, we want to discuss a potential impact on the calculated acceptance from our assumptions about the MC input energy spectrum and input composition, and the assumption of an average atmosphere in our simulation and analysis.
5.1 Input Spectrum
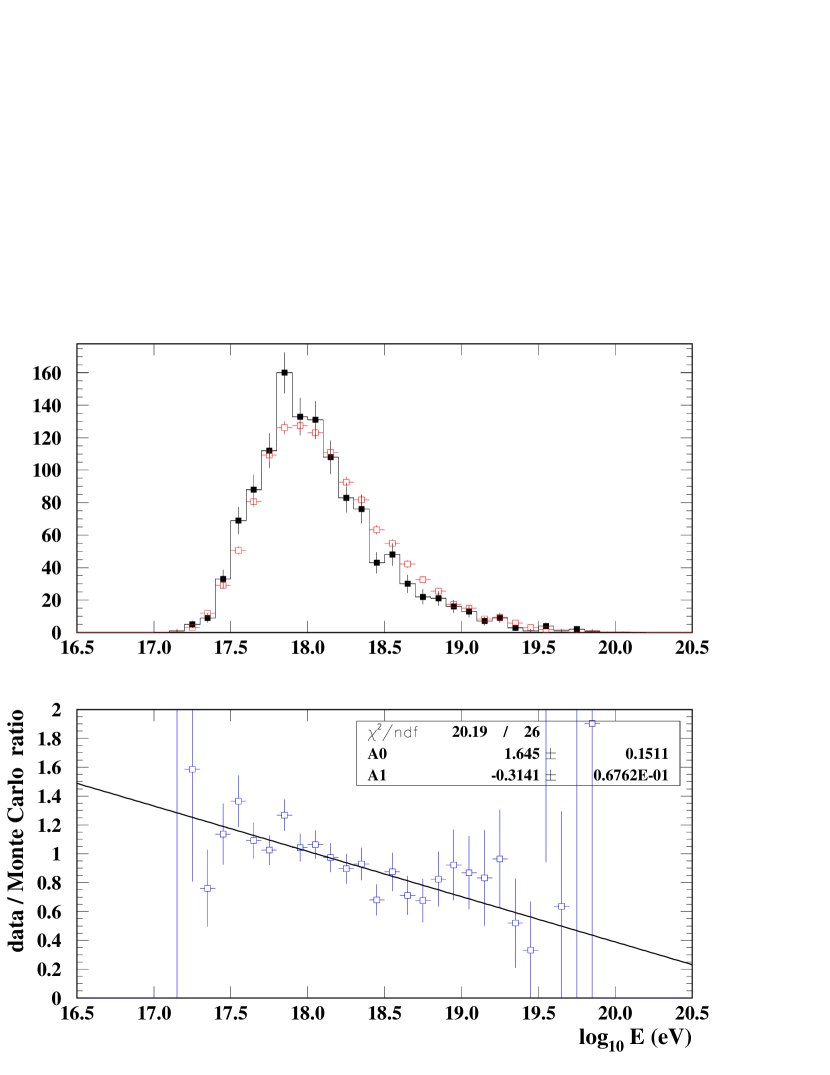
Using MC simulations to determine the acceptance of the detector could potentially introduce a bias into the analysis due to a wrong model used in the MC. This potential bias can be estimated by calculating the acceptance for different model assumptions in the MC [5]. We have varied the shape of the input spectrum, from which MC event energies are chosen. Figure 5 shows a plot comparing the energy distributions of a MC set using a simple power law as input with about half of our analyzed data. The disagreement of the data with this assumption can be seen clearly from the tilted ratio plot.
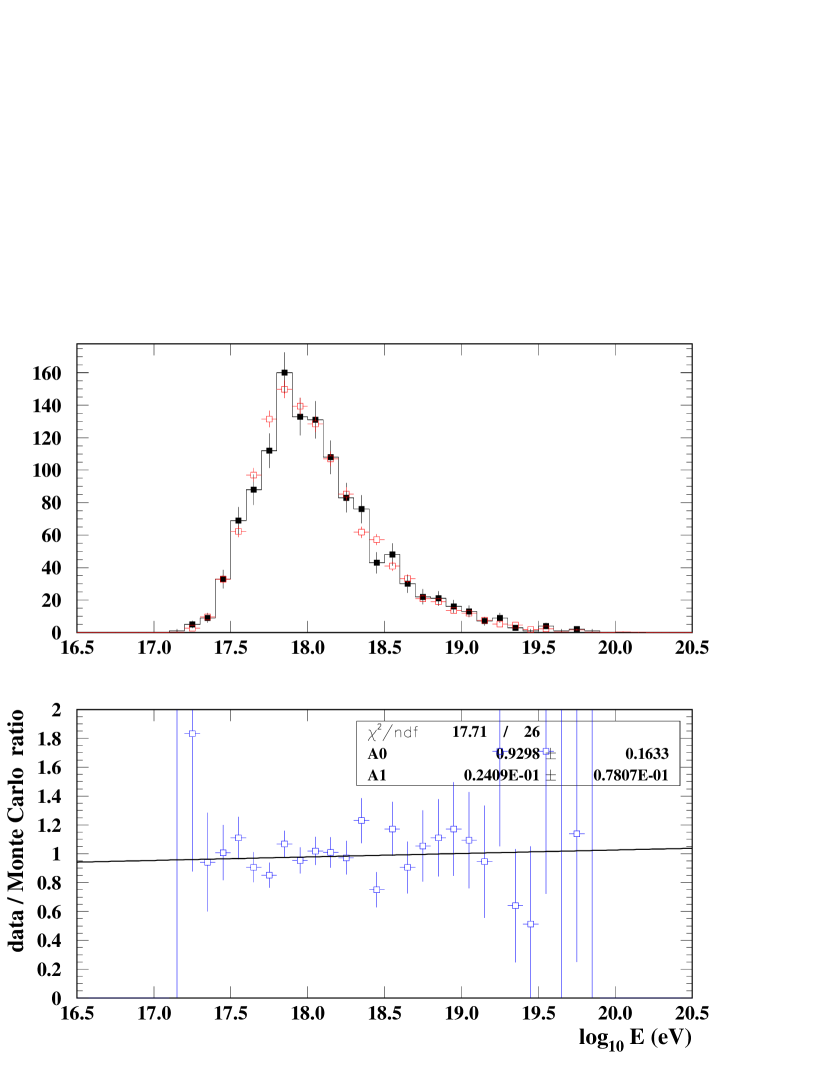
Our regular MC uses an input spectrum whose shape fits the Fly’s Eye stereo spectrum below the ”ankle” and follows a straight line fit to the HiRes-1 data for higher energies. The GZK feature has not been included. A comparison plot for this input spectrum is shown in Figure 6. Here, the agreement is very good.
We have calculated acceptances for both MC sets. The bias we are avoiding by using a realistic input spectrum is of the order of . This bias would translate directly into the measured spectrum, if one assumed a wrong (i.e. ) input spectrum in the MC simulation.
5.2 Input Composition
We determine the fraction of showers initiated by light and heavy, i.e. proton and iron, cosmic rays in the MC from composition measurements by the HiRes/MIA [6] and HiRes stereo [7] experiments.
The uncertainties in the HiRes/MIA measurement that translate into our spectrum calculation add up to . Their sources are the detector calibration, the aerosol component of the atmosphere and the statistical uncertainty of a fit to the HiRes/MIA data. A uncertainty in the fluorescence yield is common to both HiRes and HiRes/MIA and was therefore not included. The difference in the predictions of pure iron and pure proton maximum shower depths () between different hadronic interaction models was not taken into account either, since we are not concerned about the fraction of real proton and iron showers here, but only about the fraction of showers with a certain .
By generating two MC sets with pure proton and pure iron showers, we can calculate the effect a change in the proton fraction would have on the acceptance. The uncertainty in the final spectrum from such a variation is shown in Figure 7. At the low energy end of the spectrum, the acceptance for iron cosmic rays is lower because iron showers develop higher up in the atmosphere and are more likely to be outside of our elevation coverage than proton showers. This leads to larger uncertainties at lower energies. For energies above , where we use the HiRes stereo composition measurement, no difference was seen in the acceptances for iron and proton showers.
5.3 Atmospheric Database
Our current analysis uses a measurement of the average aerosol content of the atmosphere. We have studied the effect on the energy resolution of using an atmospheric database with hourly entries instead of the average. A MC set has been generated with use of the database to simulate data from September 2000 to March 2001. Our database covers of all nights in this period. The MC set has been reconstructed first with the average and then with the database. A Gaussian fit to the energy resolution has a of for the reconstruction using the database and when using the average.
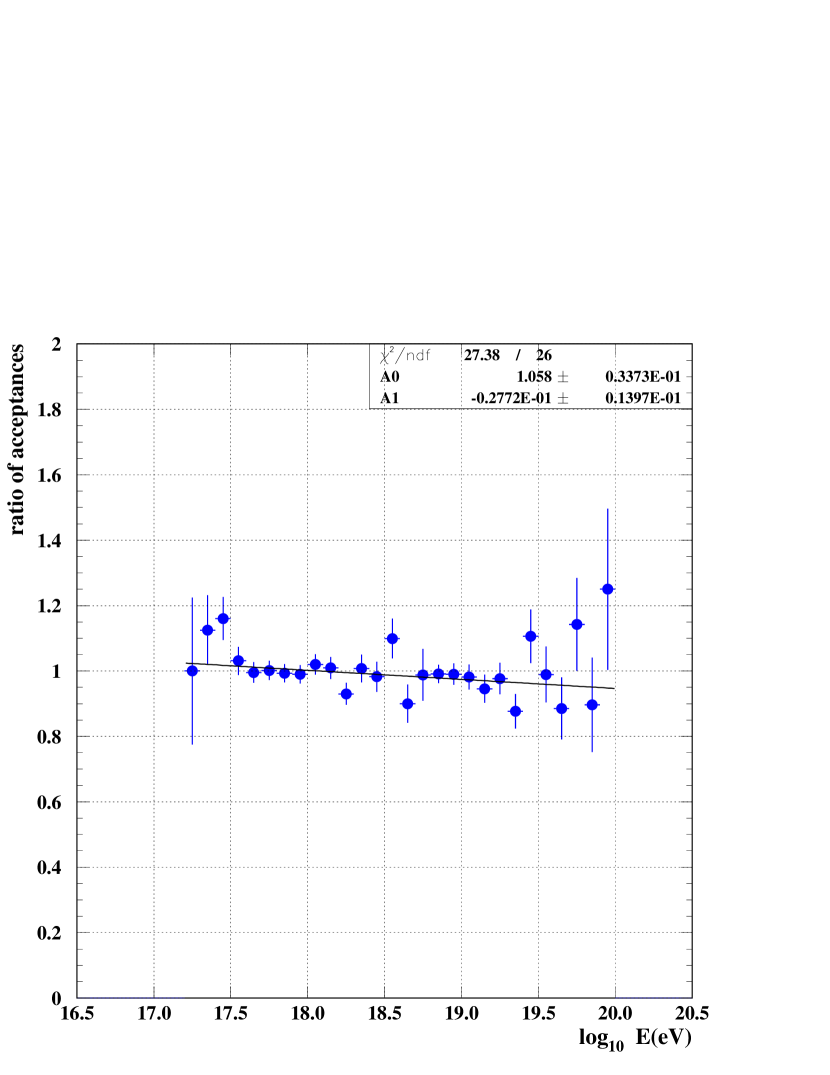
An acceptance has been calculated in both cases. The ratio of acceptances can be seen in Figure 8: The acceptance for the MC set reconstructed with database is in the numerator, the acceptance for the same MC set, but reconstructed with the average, in the denominator. Using the database in the reconstruction does not have a significant impact on the calculated aperture.
Data from September 2000 to March 2001 have been analyzed with the average and with the atmospheric database. We have not found any systematic shift in the reconstructed energies. When we examined the highest energy events (), we found that using the database shifts one event from the bin centered at to the bin centered at . This leads to a reduction of the events above from 7 to 6 in this dataset.
6 Conclusions
-
•
Our measurement of the UHECR spectrum with the HiRes FADC detector in monocular mode is consistent with the GZK flux suppression at and with the Fly’s Eye stereo spectrum. The ”ankle” is observed at an energy of about .
-
•
Detailed Monte Carlo simulation is used to calculate the acceptance of the detector, after being tested with data-MC comparisons.
-
•
We avoid a bias of about in our spectrum by using a realistic assumption about the input energy spectrum in the MC.
-
•
Systematic uncertainties caused by uncertainties of the input composition in the MC do not exceed our statistical errors.
-
•
We have tested the impact of using an atmospheric database with hourly entries rather than an average atmosphere in the reconstruction for about half of our analyzed data. We have not found a significant difference.
References
- [1] D. Heck, J. Knapp, J.N. Capdevielle, G. Schatz and T. Thouw, Report FZKA 6019 (1998), Forschungszentrum Karlsruhe.
- [2] N.N. Kalmykov, S.S. Ostapchenko and A.I. Pavlov, Nucl. Phys. B (Proc. Suppl.) 52B, 17, (1997).
- [3] R.U. Abassi et al., submitted to Astropart. Phys., arXiv: astro-ph/0208301
- [4] R.U. Abassi et al., Phys. Rev. Lett. 92, (2004) 151101., arXiv: astro-ph/0208243
- [5] G. Cowen, Statistical Data Analysis, Oxford Science Publ. (1998)
- [6] T. Abu-Zayyad, et al., Phys. Rev. Lett. 84 (2000) 4276.
- [7] G. Archbold and P.V. Sokolsky (for the HiRes Collaboration), Proc. of the 28th Int. Cosmic Ray Conf. (2003) 405.