FLUCTUATIONS OF AND PRIMARY PARTICLE MASS COMPOSITION IN THE RANGE OF ENERGY EV BY YAKUTSK DATA
Abstract
The experimental distributions of obtained with the Yakutsk EAS array at fixed energies of , and eV are analysed. A recent version of the QGSJET model is used as a tool of our analysis. In the framework of this model, the most adequate mass composition of primary particles satisfying the experimental data on is selected.
keywords:
Cosmic Rays; Extensive Air Showers; Mass Composition.Received (24 October 2004)Revised (5 July 2005)
A large body of data on charged particles, muons and Cherenkov radiation of EAS in the energy range eV has been accumulated with the Yakutsk EAS array over a thirty-year period of its exposure. During this period, showers with eV have been registered. After 1993, the number of detectors for the charged particles and EAS Cherenkov light has been increased. The accuracy for determination of arrival direction (zenith and azimuth angles) of EAS and the EAS axis location have been considerably improved. This allowed us to estimate more precisely the EAS characteristics, including , the atmospheric depth at which the shower reaches its maximum.
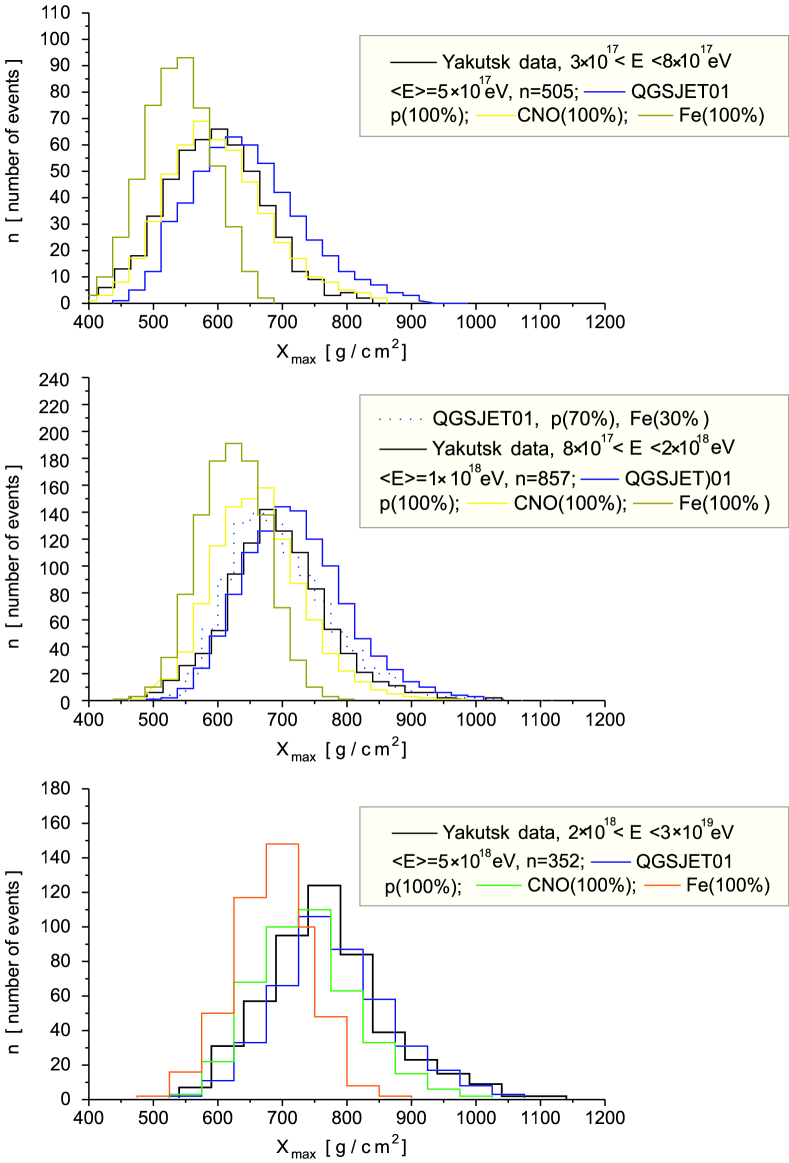
A large number of Cherenkov detectors operating in the individual EAS events as well as the use of a new version of the QGSJET model[1] allowed us to perform quantitative estimations of the mass composition of Primary Cosmic Rays (PCR). For this aim we have compared the experimental data (see Fig. 1) and theoretical predictions obtained with the QGSJET model for different primary nuclei by applying the conventional criterion. The value of is determined according to the equality
| (1) |
in which
| (2) |
In Eqs. (1) and (2), is the experimental number of showers in the interval from to , is the corresponding number of showers calculated under the assumption that the mass number of the nucleus is equal to , and is the probability that the shower with energy is formed by a primary particle with the mass number .
Our analysis involves five standard groups of primary nuclei: p, , M, H and Fe. The main results of the analysis are summarized in Tables 1 and 2.
values () for three average energies and five standard nuclear groups. \toprule (eV) p M H Fe \colrule \botrule
The shape of the experimental distribution at the optimal value of with the confidence level of (see Table 1) does not contradict to the mass compositions listed in Table 2 for the same average energies and nuclear groups.
Mass composition of the PCR for five nuclei components. \toprule (eV) p M H Fe \colrule % % % % % % % % % % % % % % % \botrule
Hence, in the framework of the QGSJET model one can conclude that the mass composition of PCR changes under the energy range switch-over from eV to eV. At eV the primary cosmic radiation is composed of about % of protons and helium nuclei; a fraction of the rest nuclei in the range where there is the second irregularity in the energetic spectrum (so-called “ankle”) does not exceed %. A high content of proton and helium nuclei in PCR within the region of formation of the “ankle” is most likely related with a noticeable contribution of extragalactic cosmic rays into the overall flux of cosmic radiation in the Earth’s vicinity.
Acknowledgements
This work has been financially supported by RFBR, grant #02–02–16380, grant #03–02–17160 and grant INTAS #03–51–5112.
References
- [1] N. N. Kalmykov, S. S. Ostapchenko and A. I. Pavlov, Nucl. Phys. B (Proc. Suppl.) 52B, 17 (1997).