The Galactic centre region
Abstract
We have observed the central 45′ region of the Galaxy at 620 MHz band of the Giant Metrewave Radio Telescope (GMRT) in radio continuum, and measured the polarisation properties of 64 small diameter background extragalactic sources seen through the 6∘6∘, 2∘2∘ region with the Australia Telescope Compact Array (ATCA) and the Very Large Array (VLA). Our 620 MHz observations show that Sgr A* is located behind the HII region Sgr A West. Using the ATCA and the VLA observations, we measured the Faraday rotation measure (RM) of the polarised sources. The measured RMs are mostly positive, and show no reversal of sign across the rotation axis of the Galaxy. This rules out any circularly symmetric model of magnetic field in the region. We estimate the magnetic field strength in the region to be G, which raises doubts against an all pervasive mG field in the central few hundred pc of the Galaxy.
keywords:
Galaxy: centre – Galaxy: nucleus – ISM: magnetic fields – HII regions1 Introduction
Being located two orders of magnitude closer than the nearest large galaxy, the Galactic centre (GC) can be studied with much higher spatial resolution and sensitivity than is possible for other galaxies. Because of this advantage, we can identify unique objects like the Radio-arc consisting of linear parallel filaments (Yusef-Zadeh et al. 1984), or the 2.6 M⊙ black hole most probably associated with the compact radio source Sgr A* (Ghez et al. 1998). These studies have also established a concentration of gas, mostly in the form of molecular clouds characterised by densities 104 molecules cm-3, velocity dispersions 10 km s-1, temperatures 70 K and apparent magnetic fields 1 mG in the region. Most of these quantities are one to two orders of magnitude larger than those found in the disk of our Galaxy. The review by Morris & Serabyn (1996), describes this research. Melia & Falcke (2001) provide the recent advances made in the research on the black hole and the central region (a few pc) of the Galaxy. The three-dimensional source distribution in the GC region is complex, and despite the studies mentioned above, identification of the objects and the physical processes operating in the region are difficult to understand, some of which we discuss below.
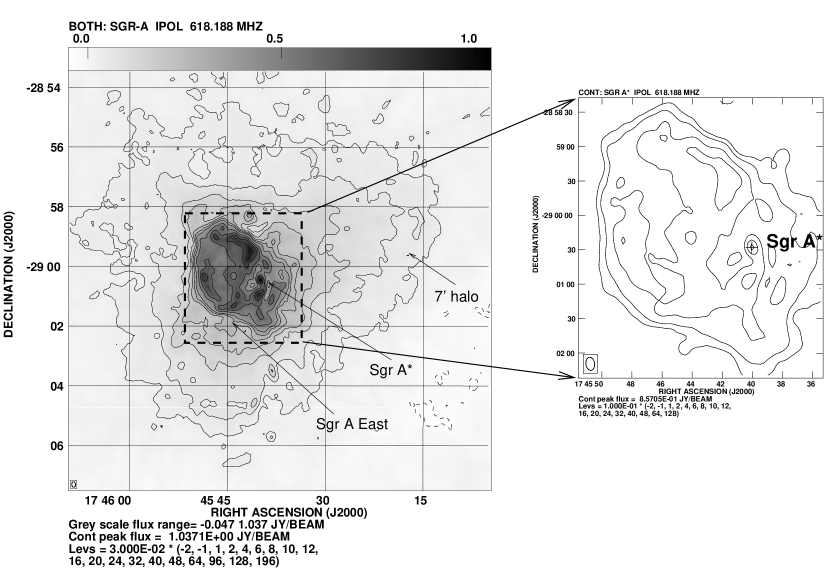
From the high-resolution ( arcsec) observations with the VLA at radio frequencies (Pedlar et al. 1989), the following sources within the central 15′ of the Galaxy have been identified or reconfirmed. (i) At the dynamical centre of the Galaxy is the compact nonthermal radio source known as Sgr A*. (ii) Around Sgr A* is the HII region Sgr A West, whose morphology resembles a face-on spiral galaxy. (iii) Near Sgr A West is Sgr A East, which is believed to be a supernova remnant (SNR). (iv) A 7′ halo, which has been proposed to be a mixture of thermal and non-thermal emission (Pedlar et al. 1989).
Sgr A* (see Melia & Falcke 2001 for a review) was not detected at frequencies below 960 MHz and observations at 408 MHz (Davies et al. 1976) and at 330 MHz (Pedlar et al. 1989) provided upper limits (0.1 Jy at 330 MHz) on its flux density. Sgr A* probably has a low frequency turnover below 1 GHz, but the nature of the turnover has never been examined in detail (Melia & Falcke 2001). Recently, Nord et al. (2004) claim to have detected Sgr A* at 330 MHz. However, their detection at 330 MHz remains provisional (Roy & Rao 2004).
Magnetic fields can be strong enough to have a significant influence on the dynamics and evolution of the sources in the central region of our Galaxy. Magnetic pressure can contribute significantly to the overall pressure balance of the interstellar medium (ISM) and can even influence the scale height of the gas. It can affect the formation and motion of clouds and perhaps mediate in the star formation process (Beck et al. 1996). Therefore, it is important to measure the magnetic field geometry and strength in the central part of the Galaxy. However, other than the central 200 pc region, no systematic study has been made to estimate the magnetic fields in the inner 5 kpc region of the Galaxy (Davidson 1996). The estimates within the central 200 pc region are mainly based on the observations of the non-thermal filaments or NTFs (Gray et al. 1995). However, if the NTFs are manifestations of a peculiar local environment (Shore & Larosa 1999), inferences drawn from these observations can be misleading.
Here we describe (i) the 620 MHz GMRT observations of the GC, which was aimed at studying the low frequency spectrum and the location of Sgr A* with respect to Sgr A West HII region, (ii) ATCA and VLA observations of 65 background sources located in the central 6∘6∘, 2∘2∘ region of the Galaxy to measure Faraday rotation measure (RM), which could yield a model dependent magnetic field in the GC region.
2 Observations and data reduction
2.1 GMRT observations of the GC at 620 MHz
The 620 MHz observations of the GC were carried out with the GMRT with a nominal bandwidth of 16 MHz. Full-synthesis (7 hours) observations were performed. Absolute flux density calibration was performed using 3C48 and 3C286 data. The increase of from the calibrator field to the target source affects the source visibility amplitudes in the default observing mode (i.e. the Automatic Level Control (ALC) in the system is turned on), and this was tackled by (i) multiplication of the target source data with ratio of total power (when ALCs were off) between source and calibrator, or (ii) observations with ALC off and using unnormalised cross-correlation data (see Appendix A).
The data were processed within Astronomical Image Processing System (AIPS) using standard programs. Images of the fields were formed by Fourier inversion and Cleaning (IMAGR). The initial images were improved by phase only self-calibration. To improve the deconvolution of the extended emission, we made the final image using Multi-resolution Clean (Wakker & Schwarz 1988). The GMRT map at 620 MHz (Fig. 1) has a dynamic range of about 150, and is limited by systematics.
2.2 RM observations of the background sources seen towards the GC
A total of 37 sources were observed with the ATCA using their 4.8 GHz and 8.5 GHz bands. The ATCA observations were made using a 6 km array configuration. Each target source was typically observed for a total of 40–50 minutes. Since we used an E-W array configuration, to get a satisfactory uv-coverage each source was observed 10 times almost equally spaced in hour angle. Calibration and editing of the ATCA data were performed using MIRIAD. The calibrated visibilities were imaged using standard AIPS.
We used the VLA in its BnA configuration to observe 27 relatively weak sources in the sample. The default continuum mode, with a single frequency channel of bandwidth 50 MHz in each IF band was used. Observations were centred at frequencies of 4.63, 4.88, 8.33 and 8.68 GHz. Each source was observed for typically 5 minutes at 2 different hour angles. All the data were calibrated and processed using the AIPS package.
3 Results and Discussions
3.1 GMRT observations of the GC at 620 MHz
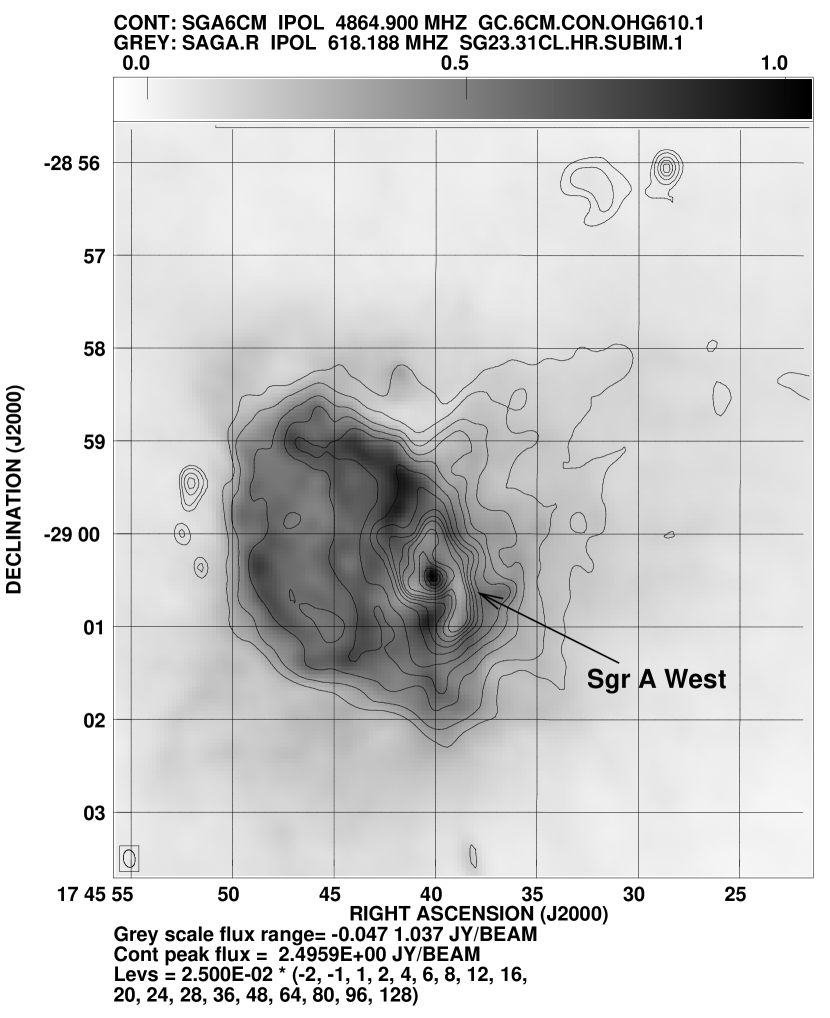
The central 15′ region of the Galaxy at 620 MHz is shown in Fig. 1. The compact source Sgr A*, along with other well known sources like Sgr A East and the 7′ halo are clearly seen. To compare the smaller-scale features near Sgr A West with higher frequency maps, we have overlayed in Fig. 2, the 620 MHz map in gray scale on the 4.8 GHz VLA map in contours convolved to a common resolution. There is almost one to one correspondence between the brighter emission features at 4.8 GHz comprising the Sgr A West region and a drop in the total intensity at 620 MHz (indicated by a white region seen along Sgr A West), indicating that the thermal emission is optically thick near 620 MHz.
3.1.1 Flux density of Sgr A*
While estimating the flux density of Sgr A* at 620 MHz, we reduced the confusion due to the extended emission by imaging only those visibilities having uv distance 7 k. The flux density estimated from the image plane is about 0.5 0.1 Jy. We note that even after applying a lower uv cutoff, there is significant background confusion within a beam of size 7.. This confusion causes an uncertainty of about 0.1 Jy in the estimated flux density.
3.1.2 Low frequency spectral index of the Sgr A*
Although the high radio frequency spectrum of Sgr A* is well established, the spectrum below 1.4 GHz is not well estimated. At 1.4 GHz, the flux density of Sgr A* is about 0.5 Jy and its time averaged spectral index, defined as S, between 1.4 and 8.5 GHz is +0.17 (Melia & Falcke 2001). Davies et al. (1976) found the flux density of Sgr A* at 960 MHz to be a factor of two less than at 1.6 GHz and suggested that it has a low frequency turnover around 1 GHz. This appears to be confirmed from their upper limit of 50 mJy at 408 MHz and the 100 mJy upper limit set by Pedlar et al. (1989) at 330 MHz. However, the present 620 MHz observations along with its tentative 330 MHz detection (Nord et al. 2004) raise questions about earlier measurements. Based on the average flux density of Sgr A* at 1.4 GHz (Zhao et al. 2001) and its known spectrum between 1.4 and 8.5 GHz, we expect a flux density of 0.44 Jy at 620 MHz, which is consistent with our measurements within the error-bars. Therefore, at frequencies of a few GHz to 620 MHz, the observed spectral index of Sgr A* is nearly flat.
Though the advection-dominated accretion flow (ADAF) model of emission from Sgr A* fails to explain the observed low frequency emission, ADAF along with self-absorbed synchrotron emission either from a relativistic jet, or from a small relativistic fraction of electrons embedded in the accretion flow (Yuan et al. 2003) could explain the observed spectrum of Sgr A* from X-ray ranges to low radio frequencies of about 620 MHz.
3.2 Location of Sgr A*
At 620 MHz, Sgr A West shows evidence for free-free self-absorption. In Roy & Rao (2004), we have shown the optical depth of Sgr A West HII region near Sgr A* to be 2.50.5. If Sgr A* was located behind Sgr A West, then its flux density would have been attenuated by a factor of 10 due to thermal absorption by Sgr A West. However, the spectral index of Sgr A* between 620 MHz and 1.4 GHz is roughly the same as between 1.4 GHz and 8.5 GHz showing no effect of free-free absorption by Sgr A West. This indicates that Sgr A* is located in front of Sgr A West. It is possible to invoke alternate scenarios like holes in Sgr A West along the line of sight to Sgr A*, but these appear to be unlikely (see Roy & Rao 2004 for details).
3.3 Magnetic field in the GC: RM observations of the background sources
Based on the ATCA data, 24 sources were found to have at least one polarised component. The FWHM sizes of the beams in the ATCA 4.8 GHz images are 6, and the typical rms noise is 0.23 mJy/beam in Stokes I and about 0.15 mJy/beam in Stokes Q and U. Of the sources observed using the VLA, 21 have at least one polarised component. The VLA images have a beam of FWHM size 2 and the rms noise is typically 75 Jy/beam. A map of one of the sources is presented in Fig. 3.


3.3.1 Features in the RM sky near the GC
The estimated RM towards 45 sources are plotted in Fig. 5. In the plot, the positive RMs have been indicated by cross () and the negative RMs by a circle (), where the size of the symbols increases linearly with the RM. The region appears to be dominated by positive RM. The median value of the RMs is estimated to be 46787 rad m-2.
To detect small-scale fluctuations in the RM, we have plotted the RM structure function in Fig. 4. As can be seen from the plots, the RM structure function tends to zero as the separation of the polarised components tends to zero. Since intrinsic RMs of different sources are independent of their angular separations, our result supports an interstellar origin (plasma turbulence) of the RM towards the GC. The structure function tends to saturate for components separated by more than 0.∘3. From the plot, the coherence scale (where the structure function attains half of its maximum value) of the Faraday screen is estimated to be about 0.∘2 (30 pc at a distance of 8.5 kpc).

3.3.2 Geometry of the magnetic field along the Galactic plane
Our observations show a large-scale positive bias in RM towards the GC, with a mean RM of 525129 rad m-2 towards the sources with positive Galactic longitude, and 389103 rad m-2 towards the sources with negative Galactic longitude. The absence of any reversal of sign of the RM (4 result) across the rotation axis of the Galaxy (=0∘), indicates that the magnetic field across the rotation axis of our Galaxy is not circularly symmetric. Two models, the axisymmetric and the bisymmetric spiral model of the magnetic fields are generally invoked to explain the field geometry in galaxies (Beck et al. 1996). It is thought that current loop generated by rotation of the matter around the centre (dynamo model) gives rise to the axisymmetric spiral configuration of the magnetic field. However, if the magnetic fields at the present time are the result of concentration of a primordial magnetic field due to collapse of matter while the Galaxy was formed, then it gives rise to the bisymmetric spiral configuration of the magnetic field in galaxies. In our Galaxy, the magnetic field configuration has been suspected to be bisymmetric (Simard-Normandin & Kronberg 1980), in which case, the field does not undergo a reversal of sign across the centre. Our observations support the bisymmetric spiral configuration in the inner parts of our Galaxy.
3.3.3 Estimation of the magnetic field from the RM
In order to estimate the line of sight (los) component of the magnetic fields from the RM, we need a model of the electron density in the region. Based on the Very Long Baseline Array (VLBA) observations of the scattering diameter of extragalactic sources (Bower et al. 2001), we consider an electron density of 0.4 cm-3 in the region, which is twice the value predicted by the Taylor & Cordes (1993) model for the inner Galaxy. If the central 2 kpc is considered responsible for the Faraday rotation, then the los averaged magnetic field is estimated to be 0.7 G (Roy, Rao & Subrahmanyan 2004).
To compute the random component of the magnetic field, we note that the typical scale size of the Faraday screen as estimated in 3.3.1 is 30 pc. Hence, there will be about 70 cells of irregularities within the central 2 kpc of the Galaxy. Assuming that the RM contributions from the individual cells along the los are random about the mean, the cell contributions would have an rms RM value of 83 rad m-2. If the rms electron density within such a cell is 0.4 cm-3, the estimated magnetic field is about 9 G, which is more than an order of magnitude higher than its los average value. This small field raises doubts about an all-pervasive mG field in the central few hundred pc of the Galaxy (Yusef-Zadeh & Morris 1987). The large-scale picture suggested by our observations is that the magnetic field even a few degrees away from the GC is oriented nearly perpendicular to the los pointing towards us on both sides of the GC.
Acknowledgements
GMRT is run by the National Centre for Radio Astrophysics of the Tata Institute of Fundamental Research. The Australia Telescope is funded by the Commonwealth of Australia for operation as a National Facility managed by CSIRO. The National Radio Astronomy Observatory is a facility of the National Science Foundation operated under cooperative agreement by Associated Universities, Inc.
References
Beck, R., Brandenburg, A., Moss, D., Shukurov, A., Sokoloff, D. 1996, ARA&A, 34, 155
Bower, G. C., Backer, D. C., Sramek, R. A. 2001, ApJ, 558, 127
Davidson, J. A. 1996, in ASP Conf. Ser. 97: Polarimetry of the Interstellar Medium, 504
Davies, R. D., Walsh, D., Booth, R. S. 1976, MNRAS, 177, 319
Ghez, A. M., Klein, B. L., Morris, M., Becklin, E. E. 1998, ApJ, 509, 678
Gray, A. D., Nicholls, J., Ekers, R. D., Cram, L. E. 1995, ApJ, 448, 164+
Melia, F., Falcke, H. 2001, ARA&A, 39, 309
Morris, M., Serabyn, E. 1996, ARA&A, 34, 645
Nord, M. E., Lazio, T. J. W., Kassim, N. E., Goss, W. M., Duric, N. 2004, ApJL, 601, L51
Pedlar, A., Anantharamaiah, K. R., Ekers, R. D., et al. 1989, ApJ, 342, 769
Roy, S., Rao, A. P. 2004, MNRAS, 349, L25
Roy S., Rao A.P., Subrahmanyan R. 2004, submitted to MNRAS
Shore, S. N., Larosa, T. N. 1999, ApJ, 521, 587
Simard-Normandin, M., Kronberg, P. P. 1980, ApJ, 242, 74
Taylor, J. H., Cordes, J. M. 1993, ApJ, 411, 674
Wakker, B. P., Schwarz, U. J. 1988, A&A, 200, 312
Yuan, F., Quataert, E., Narayan, R. 2003, ApJ, 598, 301
Yusef-Zadeh, F. 1989, in IAU Symp. 136: The Center of the Galaxy, eds M. Morris, Dordrecht:Kluwere, 243
Yusef-Zadeh, F., Morris, M., 1987, AJ, 94, 1178
Yusef-Zadeh, F., Morris, M., Chance, D. 1984, Nature, 310, 557
Zhao, J., Bower, G. C., Goss, W. M. 2001, ApJL, 547, L29
4 Appendices
4.1 Appendix A: Keeping the visibility amplitudes constant when the system temperature () changes
To perform GMRT observations such that variations have minimal effect on the observed visibilities, the following procedures can be adopted.
The Automatic Level Control (ALC) is a negative feedback device that keeps the output power of the antennas at the optimal levels. When changes, the ALC changes the effective amplitude gain of the amplifiers in order to counteract the changes in output power, leading to changes in the visibility amplitudes. Therefore, switching off the ALCs avoids the problem. However, with ALCs off, there can be sufficient output power to saturate the electronics system. Therefore, system Gains need to be adjusted in a way to avoid this problem. This is usually achieved by changing the amplitude gains of all the antennas using attenuators, so that the output power of all the antennas are equal to their default values. Since, is maximum when the sky temperature is maximum, this needs to be performed while observing the strongest source. Keeping visibility amplitudes free from above problem also requires data, where the cross-correlation coefficients between different antenna pairs are not normalised by the total power of the antennas. As shown in the Appendix-B, it also avoids any possible change of bandshape due to change of sky temperature.
4.2 Appendix B: Variation of spectral bandshape in normalised cross correlated data due to change in sky temperature
The shape of the instrumental bandpass (bandpass function) is typically determined by observing a suitably strong calibrator during observations. It is known that is the sum of the Electronics temperature () and the antenna temperature (), and is directly proportional to the antenna efficiency (). Therefore, if is a function of frequency (), then both and are functions of . As normalised visibilities are directly proportional to and inversely proportional to , it implies that the bandpass function is proportional to . Since the bandpass calibration is performed with a calibrator typically away from the Galactic plane, the may be small and neglected in the denominator. However, is substantial while observing any source in the Galactic plane at low radio frequencies (1.4 GHz). As the relationship of the bandpass function with is non-linear, it changes the overall shape of the bandpass function.
For example, consider the antenna efficiency () to fall from 0.6 at the centre of the observing band to 0.4 at the edge of the observing band. Assuming =70 K, and the sky temperature () (near Galactic plane) to be 200 K, the normalised bandpass function at the centre of the band is equal to , and is at the edge of the band. However, while observing a bandpass calibrator away from Galactic plane, the is negligible, ( is assumed to be independent of ) and the bandpass function is proportional to . However, if this bandshape is used to correct the visibilities of the target source, the true visibilities at the edge of the observing band will be overestimated by about 25% compared to the centre of the band.