The HIPASS Catalogue: III - Optical Counterparts & Isolated Dark Galaxies
Abstract
We present the largest catalogue to date of optical counterparts for HI radio-selected galaxies, Hopcat. Of the 4315 HI radio-detected sources from the HI Parkes All Sky Survey (Hipass) catalogue, we find optical counterparts for 3618 (84%) galaxies. Of these, 1798 (42%) have confirmed optical velocities and 848 (20%) are single matches without confirmed velocities. Some galaxy matches are members of galaxy groups. From these multiple galaxy matches, 714 (16%) have confirmed optical velocities and a further 258 (6%) galaxies are without confirmed velocities. For 481 (11%), multiple galaxies are present but no single optical counterpart can be chosen and 216 (5%) have no obvious optical galaxy present. Most of these ‘blank fields’ are in crowded fields along the Galactic plane or have high extinctions.
Isolated ‘Dark galaxy’ candidates are investigated using an extinction cut of 1 mag and the blank fields category. Of the 3692 galaxies with an extinction 1 mag, only 13 are also blank fields. Of these, 12 are eliminated either with follow-up Parkes observations or are in crowded fields. The remaining one has a low surface brightness optical counterpart. Hence, no isolated optically dark galaxies have been found within the limits of the Hipass survey.
keywords:
galaxies: photometry – radio lines: galaxies – methods: data analysis – catalogues – surveys1 Introduction
The blind HI Parkes All Sky Survey (Hipass), on the Parkes Radio Telescope was completed in 2000. This survey covers the whole of the southern sky up to Dec = +2 111A northern extension to +25 has also been observed and the resulting catalogue is in preparation.. The Hipass catalogue, Hicat, represents the largest HI-selected catalogue at this time and is presented in a series of papers, this one being the third. In Paper I, Meyer et al. (2004) describe the selection procedure, global sample properties and the catalogue. In Paper II, Zwaan et al. (2004), describe the completeness and reliability of Hicat. Though the survey and catalogue are developed to be free of optical selection bias, it is nevertheless important for several scientific applications to have accompanying optical data. This paper details the process taken to find the optical counterparts for Hicat sources.
Two of the (many) motivations for the Hipass survey are to investigate low surface brightness (LSB) and dark galaxies. For LSB galaxies, the goal is to provide a large sample sensitive to LSB galaxies previously undetected by optical methods, such as Malin 1 type objects (Bothun et al. 1987). By using an HI radio selected sample, any study of LSB galaxies will have minimal optical bias. It was originally thought that a large population of LSB galaxies would be revealed by HI surveys like Hipass (Disney 1976), but they have not been detected in the recent surveys (e.g. Minchin et al. 2004).
At the limit of low surface brightness are “dark galaxies” with no detected optical emission. It is important to separate true dark galaxies from gas clouds which are directly associated with optical galaxies, often through tidal interactions. For the purposes of this paper we define a dark galaxy as any HI source that contains gas (and dark matter) but no detectable stars, and is sufficiently far away from other galaxies, groups or clusters such that a tidal origin can be excluded. One of the most striking examples of associated HI gas clouds is the Leo ring, a massive cloud of tidally-disrupted gas in the Leo galaxy group (Schneider et al. 1983). More recently, early studies of the HIPASS survey have detected associated gas clouds in the NGC 2442 group (Ryder et al. 2001) and in the Magellanic Cloud-Milky Way system (Kilborn et al. 2000).
There is a range of theoretical opinion about the existence of dark galaxies. Verde et al. (2002) argue that a large fraction of low-mass dark matter halos would form stable gas disks on contraction and thus not exhibit star formation, whereas Taylor & Webster (2005) conclude that HI clouds cannot exist in equilibrium with the local universe without becoming unstable to star formation.
There are few, if any, true dark galaxy detections. Some sources, initially described as dark galaxy detections, have since been identified with optical galaxies such as the protogalaxy HI 1225+01 (re-detected here as HIPASS J1227+01) in the Virgo cluster (Giovanelli & Haynes 1989), later detected in the optical by Salzer et al. (1991). Several authors have placed upper limits on the numbers of dark galaxies in previous HI surveys. Fisher & Tully (1981) found no evidence for dark galaxies in a survey of 153 square degrees and estimated that the total mass of any dark HI clouds () was less than 6 per cent that in normal galaxies. More recently Briggs (1990) showed that the space density of dark galaxies is less than 1 percent that of normal galaxies for masses , and the the Arecibo surveys by Zwaan et al. (1997) also failed to detect any dark galaxies in the range ().
Previous to HIPASS, several blind HI surveys that identify optical counterparts have been carried out, such as the Arecibo HI Sky Survey, AHISS, (Sorar 1994; 66 sources), the Slice Survey (Spitzak & Schneider 1998; 75 sources) and the Arecibo Dual-Beam Survey, ADBS, (Rosenberg & Schneider 2000; 265 sources). However Hicat is much larger, containing 4315 HI radio detected objects and covers the whole southern sky from 300 to 12700 km s.
Newly catalogued galaxies in the Hipass Bright Galaxy Catalogue (BGC, Koribalski et al. 2004), are described in Ryan-Weber et al. (2002). Of the 1000 galaxies, 939 have optical counterparts, 4 are high velocity clouds and 57 were deemed to be obscured by dust or confused with stars having galactic latitudes b. To date all previous Hipass based studies have conclude that there are no dark galaxies or invisible HI clouds not gravitationally bound to any stellar system present. In using our Hicat optical catalogue, Hopcat, which incorporates the complete Hipass catalogue, a more comprehensive search for isolated dark galaxies in the southern sky is carried out.
In Section 2 we describe the method we use to identify the optical counterparts for the Hicat sources, discuss the input data, how the images are analysed and the process taken to calibrate the magnitudes in the B, R & I bands. In Section 3 we introduce the Hipass optical catalogue, Hopcat. Section 4 lists and analyses the results of the matching process, investigates the optical properties and candidate dark galaxies. A summary of our work is given in Section 5.
2 SELECTION OF OPTICAL COUNTERPARTS
The position of each HI source is used to find the matching optical image. Since Hicat covers a velocity range from 300 to 12700 km s, finding an optical counterpart, especially those with small peak flux density and at the limits of the survey, poses a variety of challenges.
In the following sections we describe the preliminary investigations undertaken into finding the best method to optically match the HI radio sources. We detail the image analysis, steps taken to minimize the various problems that arise in matching extended objects and calibrate the resulting magnitudes. We also review what methods and resources are required to cross-check velocities in the matching process and describe the actual matching process in detail.
2.1 Preliminary Investigations
In our preliminary work to identify the best method to find the optical counterparts, we make use of the both the SuperCOSMOS image and data catalogues (Hambly et al. 2001a, b & c). The SuperCOSMOS data catalogue (hereafter SuperCOS data) contains results from image analysis originally optimized for faint star/galaxy classification. This causes problems in the recognition of bright extended objects such as the Hipass galaxies.
When each image from the SuperCOMOS image catalogue (hereafter SuperCOS images) is analysed, ellipses are produced that represent an area around each object above a particular sky intensity for that particular plate. The integrated flux and hence the isophotal magnitude is calculated using these ellipses. However, in the case of the SuperCOS data’s ellipses (hereafter SuperCOS ellipses), multiple ellipses can be produced for a single object, especially for extended ones, that segment the area and result in incorrect magnitudes. A different image analysis approach is needed.
2.2 Optical Image Data
Using the results from the preliminary investigations above, the SuperCOS image is optimal for our purposes. The scanned SuperCOS images have a 10-mm (0.67 arcsec) resolution (Hambly et al. 2001b). Each image is required to cover a 7 arcmin radius centred on the Hicat position to allow for any possible uncertainties in the original coordinates. Using the original positions of the 4315 HI detections from Hicat, 1515 arcmin B, R & I band SuperCOS images, each centred on the Hicat position are obtained. Independent analysis of each image needs to overcome any segmentation and photometry problems we encounter using the SuperCOS ellipses.
The SExtractor image analysis package (Bertin & Arnouts 1996) is used to analyse each SuperCOS image and an SExtractor ellipse catalogue (hereafter SEx ellipses) is produced containing ellipses for each object within the image using the method described in Section 2.1. For the majority of the SuperCOS images, we use SExtractors’ default analysis parameters that are optimised for extended and bright objects and that require an higher contrast to detect an object. However, for some objects, the ellipse also includes foreground stars. Therefore a second set of SExtractor parameters, that are more likely to break up detections into smaller objects and that require a much lower contrast to detect fainter objects, are used. A total of 91 images using the second set of parameters are included for the final SEx ellipses.
The magnitudes included in our catalogue are based on SExtractor’s mag_auto defined as ‘Kron-like elliptical aperture magnitudes’ (Bertin & Arnouts 1996). The magnitude measurements are calculated from the SEx ellipses produced by analysing the band images only and are uncalibrated. Our calibrations of the SExtractor B, R & I magnitudes, using the SuperCOS data’s zero point calibration, are described in Section 2.4.2.
2.3 Optical spectroscopic Data
Accurately matching the HI radio detections with their optical counterparts requires a verification method. Using the velocity measurements from Hicat is one way to cross-check the validity of the optical match. Two available resources for velocity cross-checking are NED 222The NASA/IPAC Extragalactic Database (NED) is operated by the Jet Propulsion Laboratory, California Institute of Technology, under contract with the National Aeronautics and Space Administration. and the 6dF Galaxy Survey (Wakamatsu et al. 2003; 6dFGS; http://www.mso.anu.edu.au/6dFGS/).
NED is an extragalactic database that draws information from catalogues, surveys and the literature. NED is updated every 2-3 months which poses a problem for our work as some Hipass velocities are now included. To ensure that we are not cross-checking Hipass velocities against Hipass and other HI detections, the source of all the NED velocities are checked and only those from optical or high-resolution HI radio observations are included. Since the NED data is taken from various sources, which may vary in quality, a second source of optical velocities is needed.
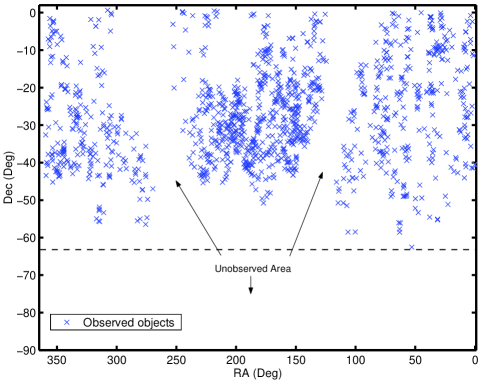
The 6dFGS, an on-going survey of the complete southern sky, is a uniform, high quality dataset that includes redshift measurements. Though 6dFGS is not complete, the sky coverage to date is very useful for our purposes as possible optical counterparts to Hipass sources are included in their observing list. The data we use is not publicly available but are obtained directly from the 6dFGS team and is the latest available at the time. For 6dFGS sky coverage, see Fig. 1.
2.4 Magnitude Calibration
The SuperCOS data allows for magnitudes to be calculated as galaxies regardless of whether they are classified as a star or a galaxy (Hambly et al. 2001b). This would have been ideal for our purposes, however we are not able to use this data as discussed in Section 2.1.
Instead, we use SuperCOS images analysed using the SExtractor image analysis package. This enables us to choose parameters to calculate the area for the SEx ellipses that represents the total galaxy area and hence determine reliable magnitudes. However, this raises problems since the SExtractor magnitudes are not calibrated. To calibrate these magnitudes we use the relationship between SuperCOS data’s calibrated and SExtractor’s uncalibrated magnitudes.
2.4.1 Plate to plate differences
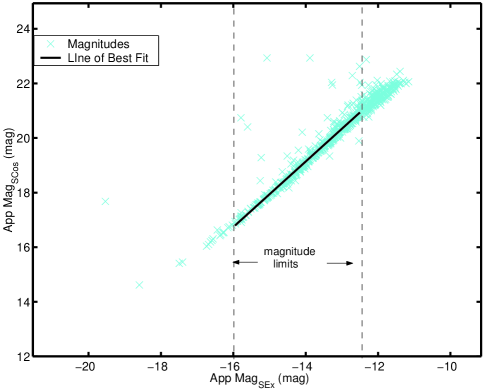
On examination of the images, we find there are variations in the background levels from plate to plate. We use the relationship between the SuperCOS data’s calibrated magnitudes and SExtractor’s uncalibrated magnitudes to find the zero-point calibration values. The SuperCOS data’s magnitude RMS (zero-point corrected) for Hopcat’s magnitude limit are =0.08, =0.04 and =0.08 mag (Hambly et al. 2001b). For each image the apparent magnitude of every object is plotted and by fitting and using the values from the best line of fit for each plot, a magnitude calibration value for each plate is determined, see Fig. 2. The magnitude range of the SuperCOS and SExtracted data has been limited for the line of best fit determination to exclude extremely faint or bright galaxies that may distort the results.
2.4.2 Matched Galaxies B, R & I Magnitude Calibration
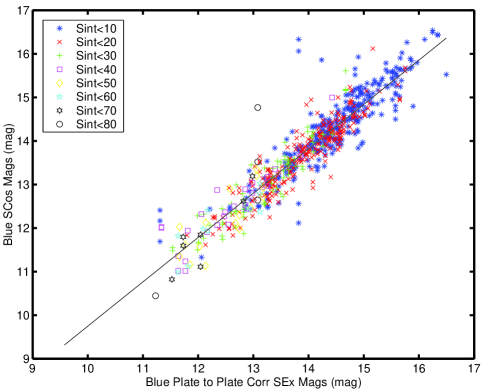
Once the zero-point calibrations for the SuperCOS images are made, we further investigate the calibration for large galaxies by using magnitudes for optically matched galaxies only. We use the relationship between the calibrated SuperCOS data and the zero-point calibrated SExtractor magnitudes to determine calibrated magnitudes. The SuperCOS data is obtained using the ‘parent’ image deblend parameter to minimise the segmentation problem as previously discussed in Section 2.1. Parent image deblends minimise the number of SuperCOS ellipses calculated for a single object. However, on plotting the SuperCOS data and zero-point calibrated SExtractor magnitudes, we find outliers due to the segmentation problem. We remove these outliers and a line of best fit is determined, Fig. 3. Using the slope and intercept from the line of best fit and the zero-point calibrated SExtractor magnitudes, Table 1, calibrated B, R & I magnitudes are calculated.
| Band | ||||
|---|---|---|---|---|
| 1.018 | 0.0002 | -0.438 | 0.0019 | |
| 0.887 | 0.0019 | 2.2 | 0.01 | |
| 0.926 | 0.0013 | 2.02 | 0.011 |
The SuperCOS data calculates the B, R & I magnitudes from analysis of B, R & I images independently, hence the resulting SuperCOS ellipses for each band vary. However Hopcat’s SExtractor magnitudes are calculated using SEx ellipses from B band images only. Using the resulting B based SEx ellipses, the R & I magnitudes are calculated using SExtractor analysis of R & I images. As the area of the B based SEx ellipses are generally larger than those of the R & I images, the resulting R & I magnitudes will be slightly biased.
To check our final calibration we compare the Hopcat calibrated magnitudes with published magnitudes from NED and we find a standard deviation of mag. This is smaller than the overall spread from our calibration calculations.
2.5 The HI Radio-Optical Matching process
An automated visual interactive program (Adric), where images centred on each Hipass source’s position are viewed by several people, has been developed. Adric utilizes SuperCOS images, SExtractor B, R & I image analysis, and NED and 6dFGS velocities for cross-checking, to reliably match Hicat HI sources with their optical counterparts.
The matching process consists of downloading B, R & I band SuperCOS images and analysing each one using the 2 sets of image analysis parameters in SExtractor to produce SEx ellipses as discussed in Section 2.2. These SEx ellipses represent the area of each object and are superimposed onto the image. We use published NED and optical 6dFGS velocities to cross-check the Hipass velocities to confirm the optical match. The NED velocities are checked to ensure that we only use velocities from optical and high-resolution HI radio observations.
When Adric is activated the user views each image, centred on the Hicat position, with the superimposed SEx ellipses. The original Hicat velocities as well as the 6dFGS and NED velocities are displayed for cross-checking purposes. Each of the 4315 images are matched independently by three people (MTD, MJD & DJR). This multiple, independent matching eliminates, as far as possible, biases by any one person in the choosing of galaxy matches.
We use a 2 digit match category number to quantify the choices made as well as the quality of the resulting magnitudes. The first digit represents the galaxy match choice (Table 2). The second digit is the quality of the magnitudes based on SEx ellipse coverage. A 0 signifies ‘good photometry and segmentation’; 1 signifies ‘poor photometry’ where one or more foreground stars are within the SEx ellipse choice; and 2 signifies ‘poor segmentation’ and/or ‘poor photometry’, where the SEx ellipse does not represent the total galaxy area. Both poor photometry and segmentation may effect the magnitude calculation.
A ‘velocity match’ galaxy (coded as 60, 61 & 62 in Table 2 & see Fig. 4) is chosen when a single galaxy’s NED and/or 6dF velocity is within 400km s of the Hipass velocity, see section LABEL:SubSec:HI_Radio-Optical_Position_and_Velocity_Separations. A ‘good guess’ galaxy match (50, 51, 52) is chosen when there is no NED or 6dF velocity but there is a single galaxy within the image that could be a match. When there is no agreement on the choice for a galaxy, the image is viewed again by at least 2 people who then jointly decide on the correct match category for the galaxy.
Note that match categories with first digit = 4 have multiple galaxies present, some with similar velocity values (see Fig. 5), but the one with the nearest velocity to Hicat’s is chosen. Also if the first digit = 1, one galaxy is chosen without the aid of published velocities but appears to be part of a group.
| Match Category Number | First Digit Description |
|---|---|
| Velocity Match | Single velocity match with chosen SEx ellipse |
| (60, 61, 62) | (see Fig. 4) |
| Good Guess | No velocity for SEx ellipse choice |
| (50, 51, 52) | Only significant galaxy in the field |
| Galaxy chosen using widths, flux or position (educated guess) | |
| Multi Velocity Match | Multiple galaxies within the field with: |
| (40, 41, 42) | matching velocity |
| group members Choose good/best galaxy including merging galaxies | |
| (see Fig. 5) | |
| Blank Field | No apparent galaxies in field |
| (30) | |
| No Guess | No match |
| (20) | No ellipse chosen |
| No similar velocities and there are multiple galaxies in field | |
| Multi Good Guess | No velocity for ellipse choice |
| (10, 11, 12) | Multiple galaxies within field with no velocity matches |
| group members Choose good/best galaxy Include merging galaxies |
First digit is the category of the galaxy match. Second digit is the quality of the resulting magnitude value: 0 = good photometry and segmentation; 1 = poor photometry ; 2 = poor segmentation.