SDSS Pre-Burst Observations of Recent Gamma-Ray Burst Fields
Abstract
In this paper, we present Sloan Digital Sky Survey (SDSS) photometry and spectroscopy in the fields of 27 gamma-ray bursts (GRBs) observed by Swift, including bursts localized by Swift, HETE-2, and INTEGRAL, after December 2004. After this bulk release, we plan to provide individual releases of similar data shortly after the localization of future bursts falling in the SDSS survey area. These data provide a solid basis for the astrometric and photometric calibration of follow-up afterglow searches and monitoring. Furthermore, the images provided with this release will allow observers to find transient objects up to a magnitude fainter than possible with Digitized Sky Survey image comparisons.
Subject headings:
surveys : SDSS, gamma-rays : bursts1. Introduction
Prompt long wavelength follow-up of gamma-ray bursts (GRBs) has revolutionized the study of these energetic and enigmatic objects. With the successful launch of the recent high-energy missions such as the High Energy Transient Explorer 2 (HETE-2 ; Lamb et al., 2004), International Gamma-Ray Astrophysics Laboratory (INTEGRAL ; Winkler et al., 2003),and Swift (Gehrels et al., 2004) satellites, rapid follow-up of gamma-ray bursts has come to maturity. Swift and HETE-2 not only detect new GRBs but also provide rapid X-ray localization allowing for very precise (uncertainties as small as a few arcseconds) positions, far superior than possible in the past. The size of modern GRB samples have become large enough to study the statistical properties of GRBs (e.g. Berger et al., 2005c) and rapid follow-up observations have allowed for the first optical, radio, and X-ray localization of afterglows from short-hard gamma-ray bursts (Gehrels et al., 2005; Hjorth et al., 2005; Villasenor et al., 2005; Fox et al., 2005; Pedersen et al., 2005; Prochaska et al., 2005; Covino et al., 2005; Berger et al., 2005b; Bloom et al., 2005).
There has been large-scale success in identifying afterglows and conducting prompt spectroscopic follow-up; afterglows extending out to (Price et al., 2005; Kawai et al., 2005) have been spectroscopically confirmed providing luminous probes of the Universe even back to the era of reionization. Recently, high resolution spectroscopy of GRBs has allowed for detailed studies of absorbing systems arising in the local environment of the GRB progenitor (Berger et al., 2005; Chen et al., 2005). Absorption line analyses of GRB afterglow spectra show structure similar to that of quasar damped Ly Absorbers (DLAs) but extend to higher hydrogen column densities and include several metal lines not found in quasar DLA systems (Watson et al., 2005; Chen et al., 2005).
It has been suggested that GRBs can provide a new class of standard candle for future cosmological experiments (Ghirlanda et al., 2004, 2004b; Friedman & Bloom, 2005; Bloom et al., 2003). As the luminosities of these objects should allow detection to very high redshifts () (Lamb & Reichart, 2000), studies of GRBs could extend current work using SN Ia to high redshifts, thus providing considerable constraints on our understanding of cosmology. Before gamma-ray bursts can be used as a cosmological tool, however, a large number of bursts must be observed spectroscopically in order to calibrate the method.
Two keys to studying GRB afterglows are the identification of a transient afterglow coincident with the burst detected at high energies and high-quality information for in-field photometric calibration stars so that all observations can be placed onto a common photometric system. Currently, many afterglow searches compare new data to digitized Palomar Observatory Sky Survey photometric plates (DSS) and use USNO stars (Monet et al., 1998) to calibrate both astrometry and photometry. As larger telescopes join the search for afterglows, the DSS imaging quickly becomes insufficient, as these images are too shallow for a detailed comparison to deep optical imaging, so afterglow candidates can only be identified through their temporal properties. The USNO catalog is a astrometric catalog, but it was not intended as a source of photometric calibration across the sky; USNO-calibrated photometry may thus be strongly affected by systematic photometric residuals in the USNO catalog itself.
The Sloan Digital Sky Survey (SDSS; York et al., 2000) provides accurate photometry and astrometry for objects over of the sky, making it a viable alternative to the DSS images and USNO catalogs. The imaging from SDSS extends over a magnitude deeper than those from the DSS, making it a valuable resource in identifying transient objects while the stable photometric and astrometric calibration of the survey makes it an ideal source of calibration data in GRB fields. In order to aid the community, we are releasing SDSS imaging and spectroscopy for the fields of 27 Swift-observed GRBs detected after December 2004, including bursts originally localized by Swift, HETE-2, and INTEGRAL observations. Here, we offer a bulk release of GRB fields observed in the SDSS, but, in the future, we will release similar data through the GRB Coordinate Network (GCN) shortly after the detection of a new burst within the SDSS survey area.
In this document, we provide some basic documentation relating to the Sloan Digital Sky Survey and describe the data products included in each GRB release. We hope that the information provided here will be a useful primer for those unfamiliar with SDSS data, but this document is by no means intended to be a full description of the survey or survey data products. The layout of the paper is as follows: in §2, we describe the Sloan Digital Sky Survey itself. A brief description of photometric quantities measured in SDSS is given in §3. We describe the data products provided with each GRB release in §4 and offer some concluding remarks in §5.
2. The Sloan Digital Sky Survey
The Sloan Digital Sky Survey (York et al., 2000; Stoughton et al., 2002; Abazajian et al., 2003, 2004a, 2005; Adelman-McCarthy et al., 2006) is imaging steradians of the sky through 5 filters, (Fukugita et al., 1996, see Figure 1 and Table 1 for transmission curves and effective wavelengths). The imaging is conducted with a CCD mosaic in drift-scanning mode (Gunn et al., 1998) on a dedicated 2.5m telescope (Gunn et al., 2006) located at Apache Point Observatory in New Mexico. Images are processed (Lupton et al., 2001; Stoughton et al., 2002b; Pier et al., 2003; Lupton, 2006) and calibrated (Hogg, et al., 2001; Smith et al., 2002; Ivezić et al., 2004; Tucker et al., 2006) after which targets are selected for spectroscopy (Eisenstein et al., 2001; Strauss et al., 2002; Richards et al., 2002) with two double-spectrographs mounted on the same telescope using a fiber allocation algorithm which ensures highly complete spectroscopic samples (Blanton et al., 2003). The reduced spectra are classified and redshifts are determined using the idlspec2d automated pipeline (Schlegel et al., in preparation).
| Filter | |||||
|---|---|---|---|---|---|
| 3546 | 4670 | 6156 | 7472 | 8917 |

The photometric calibration of SDSS imaging results in photometry which is nearly on an AB system (Oke, 1974). The details of SDSS photometric calibration are beyond the scope of this document; the interested reader may find the calibration procedure in the data release papers and technical papers cited above; the bottom line is that the photometric calibration in SDSS is quite robust with small random errors. When considering the position of the bright-star stellar locus in color-color space, the rms errors in the , ,and bandpasses are found to be 0.01 mag, 0.02 mag in the -band, and 0.03 in the -band (Ivezić et al., 2004). Similarly small photometric errors have been demonstrated by measuring the small scatter in the colors of early-type galaxies on the red sequence (Cool et al., 2006). It should be noted that the data provided in these pre-burst GRB releases have been processed using a slightly different pipeline than that used for the SDSS public data releases. We cannot guarantee that the values presented here will exactly match those from the SDSS public data releases; in particular, we expect the photometric calibrations to differ by of order 0.01 mag.
Astrometric calibration within SDSS is also quite robust. Relative astrometry is generally better than 50 milli-arcseconds per coordinate while the absolute astrometry is generally better than 0.1 arcseconds per coordinate (Pier et al., 2003). It should be noted that the SDSS astrometric system can have systematic offsets with respect to other astrometric catalogs. Users requiring high accuracy astrometry should check for any such offsets when comparing astrometry between SDSS and data calibrated to another astrometric system.
3. Measured Quantities
In this section, we outline the definitions of several of the photometric measurements used in the SDSS and included in this data release. This description is, by no means, an exhaustive source of information. Much more detailed descriptions of the SDSS data products can be found in the data release papers and the technical papers referenced in the previous section.
| Filter | Zero-Flux | ||
|---|---|---|---|
| Magnitude | |||
| 24.63 | 22.12 | ||
| 25.11 | 22.60 | ||
| 24.80 | 22.29 | ||
| 24.36 | 21.85 | ||
| 22.83 | 20.32 |
3.1. SDSS Magnitudes & Fluxes
All SDSS magnitudes, including those presented in this and future GRB releases, are expressed in terms of asinh magnitudes (Lupton et al., 1999). At high signal-to-noise, asinh magnitudes are identical to the standard logarithmic magnitude (Pogson, 1856). Asinh magnitudes, however, are well behaved even at very low, or even negative, fluxes, allowing for magnitude calculations even without a formal object detection. As described in Stoughton et al. (2002), the asinh magnitude for a measured flux, , is given by
| (1) |
Here defines the zero point of the magnitude scale and the softening parameter, , denotes the typical 1 noise of the sky in a PSF aperture in 1” seeing. Table 2, a reproduction of Table 21 in Stoughton et al. (2002), lists the values of and the magnitude corresponding to a zero-flux measurement. The table further lists , corresponding to a flux of ; asinh and logarithmic magnitudes differ by less than 1% in flux for objects brighter than this limit.
In this, and future, pre-burst data releases we report photometry in flux units as well as magnitudes. All flux measurements presented in these releases have units of nanomaggies. A nanomaggie is a flux-density unit equal to of a magnitude zero source. As SDSS is nearly an AB system, 1 nanomaggie corresponds to or erg s-1 cm-2 Hz-1.
| File | Description |
|---|---|
| Column | |
| 1 | Right Ascension (J2000) |
| 2 | Declination (J2000) |
| 3-7 | PSF magnitudes |
| 8-12 | PSF magnitude errors |
| 9-13 | Quality flags in each filter |
3.2. PSF Magnitudes
For each object detected in the SDSS imaging, a locally determined model of the point-spread function (PSF) is used to measure the flux contained within a PSF centered on the location of the source. An aperture correction is applied to each frame based both on the local PSF model and the seeing in the frame. Details on these aperture corrections are given in Stoughton et al. (2002). The errors reported for the PSF fluxes include contributions from counting statistics as well as uncertainties in the aperture corrections and PSF modeling. PSF magnitudes are the preferred photometric measurement for point-sources such as stars and quasars.
3.3. Model Magnitudes
Two galaxy models are fit to the two-dimensional image of each object detected in the SDSS, a pure de Vaucouleurs (de Vaucouleurs, 1948) profile,
| (2) |
and a pure exponential profile
| (3) |
Each of the models are convolved with the local PSF before fitting to the image. The best fit model is chosen in the -band; this is the model used to calculate the model quantities for the object. In order to provide meaningful colors, the photometric pipeline fits the full profile in the -band image and the images from the other bands are fit allowing only the amplitude of the profile to vary (Stoughton et al., 2002). In the absence of color-gradients, model colors provide an unbiased measurement of galaxy colors.
3.4. Petrosian Magnitudes
The Petrosian ratio (Petrosian, 1976), , the ratio of the local surface brightness at radius to the average surface brightness at that radius, is given by
| (4) |
where is the azimuthally averaged surface brightness profile of a galaxy and and are chosen to be 0.85 and 1.25 for SDSS. The Petrosian flux is given by the flux within a circular aperture of , where is the radius at which falls below 0.2. In SDSS, is determined in the -band then subsequently used in each of the other bands. In the absence of seeing effects, this flux measurement contains a constant fraction of a galaxy’s light, independent of its size or distance, and thus provides a fair flux measurement when comparing galaxies of different sizes or at different redshifts. More details of SDSS Petrosian magnitudes can be found in Blanton et al. (2001), Strauss et al. (2002), and Stoughton et al. (2002).
3.5. Flags
A number of data quality flags are maintained in order to guarantee the accuracy of photometric measurements in SDSS. A full description of these flags is beyond the scope of this document but can be found in the Early Data Release paper (Stoughton et al., 2002) and at the SDSS DR4 website 111http://www.sdss.org/dr4/products/catalogs/flags.html. For each object included in this release, we provide five quality flags (one for each band) based on the flags output by the SDSS pipeline. In brief, we collapse all of the SDSS data quality flags into a single yes or no quality indicator. Data which are marked as suspect (flag=1) should be used with caution.
4. Data Products
In this section, we describe each of the data products provided in this data release. We have removed saturated stars from all of the data table and we have not corrected the photometry for Galactic extinction. Again, magnitudes are asinh magnitudes as is standard in the SDSS.
| File | Description |
|---|---|
| Column | |
| 1 | Right Ascension (J2000) |
| 2 | Declination (J2000) |
| 3 | Object type |
| star = 6 galaxy = 3 | |
| 4-8 | MODEL magnitudes |
| 9-13 | MODEL magnitude errors |
| 14-18 | PETROSIAN magnitudes |
| 19-23 | PETROSIAN magnitude errors |
| 24-28 | Quality flags in each filter |
4.1. sdss.calstar
For each burst, we report the photometry and astrometry of bright stars () within 15′ of the burst location in files labeled sdss.calstar. These stars provide a reliable basis for both the astrometric and photometric calibration of GRB follow-up imaging. The area covered by these calibration stars is well matched to the Swift XRT field-of-view (Gehrels et al., 2004). Table 3 lists the information provided for each of the calibrations stars in the sdss.calstar file for each GRB dataset. It is important that the user consult the object flags and photometric errors when utilizing stars from this file as some of the stars are poorly detected in the -band.
4.2. sdss.objects
In the sdss.objects_flux and sdss.objects_magnitude files, we provide photometry and astrometry of all unsaturated objects with within 6′ of the GRB location. As suggested by the filenames, photometric quantities in the sdss.objects_flux file use flux units (nanomaggies) while those in the sdss.objects_magnitudes file use magnitudes (asinh magnitudes). Table 4 lists the quantities reported in these files.
We recommend using model fluxes when calculating colors of galaxies with . We generally prefer Petrosian fluxes compared to model fluxes for the overall flux of a galaxy, but Petrosian fluxes are noisier than model quantities at faint flux levels. We warn the user to exercise caution about using photometry with quoted errors larger than 20% in flux. These objects generally are simply low signal-to-noise ratio detections, but sometimes the large errors indicate complications in the reductions.
4.3. sdss.spectro
If SDSS spectroscopy has been completed in the field of the GRB, we include redshifts of spectroscopically observed objects within 6′ of the GRB location in the sdss.spectro file. Table 5 documents the parameters reported in the sdss.spectro files. For stars and galaxies, redshifts are accurate to approximately 30 km s-1 while quasar redshifts, which are of less importance here, are measured to (Stoughton et al., 2002). All redshifts have been corrected to a heliocentric frame but are not corrected for Galactic rotation.
Each spectroscopically observed object is classified by a spectral class (STAR, GALAXY, or QSO) and a spectral subclass, if appropriate. Galaxies can be sub-classified as STARFORMING, AGN, or STARBURST depending on the strength of the emission lines observed in the spectrum. Both galaxies and quasars can be sub-classified as BROADLINE based on the width of the emission line features; stars are sub-classified by spectral type.
| File | Description |
|---|---|
| Column | |
| 1 | Right Ascension (J2000) |
| 2 | Declination (J2000) |
| 3 | Spectroscopic classification |
| 4 | Spectroscopic subclass |
| 5 | Measured redshift |
| 6 | error on redshift |
| 7 | SDSS spectroscopic plate |
| 8 | SDSS spectroscopic fiber |
| 9 | MJD of SDSS spectroscopic observation |
4.4. Images
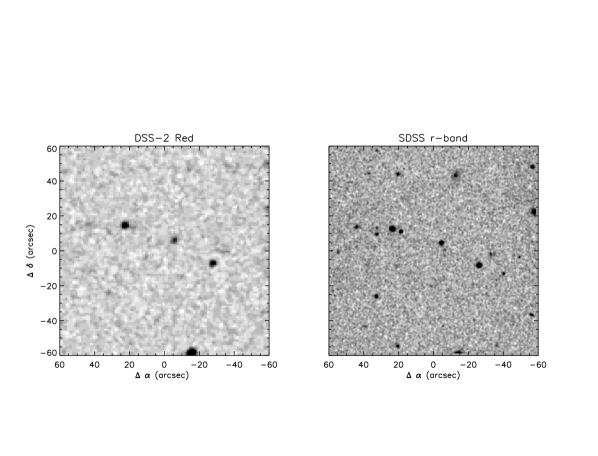
For an 8′x8′ region around each burst, we include -zipped FITS images in each of the SDSS passbands as well as three color-composite () images of the field in JPEG format. The FITS images are in units of nanomaggies per pixel where a pixel is 0.396′′ on a side. Each of the images is oriented with N up and E to the left and the FITS headers include the relevant World Coordinate System information. The SDSS images provide an important comparison epoch for follow-up imaging in order to locate possible gamma-ray burst afterglows. To illustrate the power of using SDSS images rather than those from the Digitized Sky Survey, Figure 2 shows a 1′x1′ region around the field of GRB041224 as imaged in SDSS and the DSS-2 red plates. Both images are centered on the position of the GRB as reported by the Swift BAT detection (Barthelmy et al., 2004). The imaging from SDSS reaches over a magnitude deeper than the DSS imaging allowing for the identification of transient objects to fainter limits than possible using the DSS.
| GRB | Position | SDSS Status | |||||
|---|---|---|---|---|---|---|---|
| (degrees) | (degrees) | GCN | |||||
| 041224 | 56.200 | 6.620 | 280 | 791 | 12 | 2908 | PUBLIC |
| 050124 | 192.877 | 13.044 | 338 | 688 | 4 | 2974 | PUBLIC |
| 050215B | 174.449 | 40.796 | 167 | 463 | 5 | 3027 | PRIVATE |
| 050319 | 154.200 | 43.548 | 238 | 476 | 2 | 3133 | PRIVATE |
| 050408 | 180.573 | 10.852 | 231 | 593 | 6 | 3191 | PRIVATE |
| 050412 | 181.105 | 1.201 | 274 | 450 | 2 | 3241 | PRIVATE |
| 050416A | 188.478 | 21.057 | 232 | 596 | 0 | 3268 | PUBLIC |
| 050504 | 201.005 | 40.703 | 192 | 654 | 1 | 3359 | PRIVATE |
| 050505 | 141.763 | 30.273 | 286 | 832 | 2 | 3365 | PRIVATE |
| 050509B | 189.058 | 28.984 | 118 | 976 | 0 | 3381 | PUBLIC |
| 050520 | 192.526 | 30.451 | 229 | 858 | 0 | 3434 | PUBLIC |
| 050522 | 200.081 | 24.770 | 132 | 769 | 0 | 3452 | PUBLIC |
| 050528 | 353.529 | 45.944 | 2019 | 988 | 3 | 3496 | PUBLIC |
| 050715 | 155.645 | 0.040 | 392 | 958 | 6 | 3621 | PRIVATE |
| 050802 | 219.275 | 27.786 | 417 | 622 | 0 | 3734 | PRIVATE |
| 050813 | 241.988 | 11.248 | 840 | 774 | 0 | 3788 | PUBLIC |
| 050819 | 358.756 | 24.859 | 598 | 1140 | 0 | 3826 | PUBLIC |
| 050904 | 13.711 | 14.085 | 412 | 638 | 5 | 3910 | PUBLIC |
| 050922C | 317.389 | 8.758 | 663 | 774 | 0 | 4013 | PUBLIC |
| 051008 | 202.872 | 42.100 | 257 | 408 | 4 | 4071 | PRIVATE |
| 051114 | 226.267 | 60.156 | 222 | 282 | 1 | 4279 | PRIVATE |
| 051117A | 228.391 | 30.870 | 399 | 541 | 4 | 4287 | PRIVATE |
| 051215 | 163.139 | 38.626 | 162 | 1112 | 8 | 4352 | PRIVATE |
| 051227 | 125.270 | 31.929 | 552 | 1294 | 4 | 4397 | PUBLIC |
| 060108 | 147.006 | 31.918 | 187 | 630 | 2 | 4444 | PUBLIC |
| 060121 | 137.488 | 45.675 | 301 | 507 | 3 | 4550 | PUBLIC |
| 060123 | 179.700 | 45.513 | 166 | 376 | 1 | 4584 | PRIVATE |
5. Data Release and Usage
In this paper, we present SDSS observations of all Swift-observed gamma-ray bursts occurring after December 2004 that lie in the SDSS imaging footprint. For convenience, we include data both for burst fields with photometry included in previous SDSS data releases as well as bursts for which the data has not yet been released by the SDSS. Table 6 lists the bursts included in this release as well as the current status of the data included and the number of calibration stars, surrounding objects, and spectroscopically observed objects located in each GRB field.
All of the data included in this release as well as data we release in the future can be found at http://mizar.as.arizona.edu/grb/public/. In addition to all of the data products described in the previous section, we also include a short text file for each burst. This short description provides a brief introduction to the data products and reports the local mean galactic extinction for each GRB field. In the future, we will release SDSS imaging and spectroscopy of individual GRB fields shortly after future bursts are localized. These future data releases will be announced via a GCN circular and, unless otherwise noted, follow the same data release model described in this document. All data from this release and future pre-burst data releases may be used freely, but we request that both the most recent SDSS data release paper (currently Adelman-McCarthy et al., 2006) and this paper (for bursts included in the current release) or GCN circular (for bursts released in the future) be cited.
6. Acknowledgments
RJC is funded through a National Science Foundation Graduate Student Fellowship. This research has made use of NASA’s Astrophysics Data System Bibliographic Services. The Second Palomar Observatory Sky Survey (POSS-II) was made by the California Institute of Technology with funds from the National Science Foundation, the National Aeronautics and Space Administration, the National Geographic Society, the Sloan Foundation, the Samuel Oschin Foundation, and the Eastman Kodak Corporation.
Funding for the SDSS and SDSS-II has been provided by the Alfred P. Sloan Foundation, the Participating Institutions, the National Science Foundation, the U.S. Department of Energy, the National Aeronautics and Space Administration, the Japanese Monbukagakusho, the Max Planck Society, and the Higher Education Funding Council for England. The SDSS Web Site is http://www.sdss.org/.
The SDSS is managed by the Astrophysical Research Consortium for the Participating Institutions. The Participating Institutions are the American Museum of Natural History, Astrophysical Institute Potsdam, University of Basel, Cambridge University, Case Western Reserve University, University of Chicago, Drexel University, Fermilab, the Institute for Advanced Study, the Japan Participation Group, Johns Hopkins University, the Joint Institute for Nuclear Astrophysics, the Kavli Institute for Particle Astrophysics and Cosmology, the Korean Scientist Group, the Chinese Academy of Sciences (LAMOST), Los Alamos National Laboratory, the Max-Planck-Institute for Astronomy (MPA), the Max-Planck-Institute for Astrophysics (MPIA), New Mexico State University, Ohio State University, University of Pittsburgh, University of Portsmouth, Princeton University, the United States Naval Observatory, and the University of Washington.
References
- Abazajian et al. (2003) Abazajian, K., et al. 2003, AJ, 126, 2081
- Abazajian et al. (2004a) Abazajian, K., et al. 2004, AJ, 128, 502
- Abazajian et al. (2005) Abazajian, K., et al. 2005, AJ, 129, 1755
- Adelman-McCarthy et al. (2006) Adelman-McCarthy, J. K. 2006, ApJS, in press, astro-ph/0507711
- Barthelmy et al. (2004) Barthelmy, S., et al. 2004, GRB Coordinates Network, 2908, 1
- Berger et al. (2005) Berger, E., Penprase, B. E., Cenko, S. B., Kulkarni, S. R., Fox, D. B., Steidel, C. C., & Reddy, N. A. 2005, ApJ, submitted, astro-ph/0511498
- Berger et al. (2005b) Berger, E., et al. 2005b, Nature, in press, astro-ph/0508115
- Berger et al. (2005c) Berger, E., et al. 2005c, ApJ, 634, 501
- Blanton et al. (2001) Blanton, M. R., et al. 2001, AJ, 121, 2358
- Blanton et al. (2003) Blanton, M. R., Lin, H., Lupton, R. H., Maley, F. M., Young, N., Zehavi, I., & Loveday, J. 2003, AJ, 125, 2276
- Bloom et al. (2003) Bloom, J. S., Frail, D. A., & Kulkarni, S. R. 2003, ApJ, 594, 674
- Bloom et al. (2005) Bloom, J. S., et al. 2005, ApJ, in press, astro-ph/0505480
- Chen et al. (2005) Chen, H.-W., Prochaska, J. X., Bloom, J. S., & Thompson, I. B. 2005, ApJ, 634, L25
- Cool et al. (2006) Cool, R. J., Eisenstein, D. J., Johnston, D., Scranton, R., Brinkmann, J., Schneider, D. P., & Zehavi, I. 2006, AJ, in press, astro-ph/0510301
- Covino et al. (2005) Covino, S., et al. 2005, A&A, submitted, astro-ph/0509144
- de Vaucouleurs (1948) de Vaucouleurs, G. 1948, Annales d’Astrophysique, 11, 247
- Eisenstein et al. (2001) Eisenstein, D. J., et al. 2001, AJ, 122, 2267
- Fox et al. (2005) Fox, D. B., et al. 2005, Nature, 437, 845
- Friedman & Bloom (2005) Friedman, A. S., & Bloom, J. S. 2005, ApJ, 627, 1
- Fukugita et al. (1996) Fukugita, M., Ichikawa, T., Gunn, J. E., Doi, M., Shimasaku, K., & Schneider, D. P. 1996, AJ, 111, 1748
- Gehrels et al. (2004) Gehrels, N., et al. 2004, ApJ, 611, 1005
- Gehrels et al. (2005) Gehrels, N., et al. 2005, Nature, 437, 851
- Ghirlanda et al. (2004) Ghirlanda, G., Ghisellini, G., Lazzati, D., & Firmani, C. 2004, ApJ, 613, L13
- Ghirlanda et al. (2004b) Ghirlanda, G., Ghisellini, G., & Lazzati, D. 2004b, ApJ, 616, 331
- Gunn et al. (1998) Gunn, J. E., et al. 1998, AJ, 116, 3040
- Gunn et al. (2006) Gunn, J. E., et al. 2005, AJ, in press
- Hjorth et al. (2005) Hjorth, J., et al. 2005, Nature, 437, 859
- Hogg, et al. (2001) Hogg, D. W., Finkbeiner, D. P., Schlegel, D. J., & Gunn, J. E. 2001, AJ, 122, 2129
- Ivezić et al. (2004) Ivezić, Ž., et al. 2004, Astronomische Nachrichten, 325, 583
- Kawai et al. (2005) Kawai, N., et al. 2005, astro-ph/0512052
- Lamb & Reichart (2000) Lamb, D. Q., & Reichart, D. E. 2000, ApJ, 536, 1
- Lamb et al. (2004) Lamb, D. Q., et al. 2004, Nuclear Physics B Proceedings Supplements, 132, 279
- Lupton (2006) Lupton, R. H., 2006, AJ, submitted
- Lupton et al. (1999) Lupton, R. H., Gunn, J. E., & Szalay, A. S. 1999, AJ, 118, 1406
- Lupton et al. (2001) Lupton, R. H., Gunn, J. E., Ivezić, Z., Knapp, G. R., Kent, S., & Yasuda, N. 2001, ASP Conf. Ser. 238:Astronomical Data Analysis Software and Systems X, 10, 269
- Monet et al. (1998) Monet, D. B. A., et al. 1998, VizieR Online Data Catalog, 1252, 0
- Oke (1974) Oke, J. B. 1974, ApJS, 27, 21
- Pedersen et al. (2005) Pedersen, K., et al. 2005, ApJ, 634, L17
- Petrosian (1976) Petrosian, V. 1976, ApJ, 209, L1
- Pier et al. (2003) Pier, J. R., Munn, J. A., Hindsley, R. B., Hennessy, G. S., Kent, S. M., Lupton, R. H., & Ivezić, Ž. 2003, AJ, 125, 1559
- Pogson (1856) Pogson, N. 1856, MNRAS, 17, 12
- Price et al. (2005) Price, P. A., Cowie, L. L., Minezaki, T., Schmidt, . P., Songaila, A., & Yoshii, Y. 2005, ApJ, submitted, astro-ph/0509697
- Prochaska et al. (2005) Prochaska, J. X., et al. 2005, ApJ, submitted, astro-ph/0510022
- Richards et al. (2002) Richards, G. T., et al. 2002, AJ, 123, 2945
- Smith et al. (2002) Smith, J. A., et al. 2002, AJ, 123, 2121
- Stoughton et al. (2002) Stoughton, C., et al. 2002, AJ, 123, 485
- Stoughton et al. (2002b) Stoughton, C., et al. 2002, Proc. SPIE, 836, 339
- Strauss et al. (2002) Strauss, M. A., et al. 2002, AJ, 124, 1810
- Tucker et al. (2006) Tucker, D., et al. 2006, AJ, submitted
- Villasenor et al. (2005) Villasenor, J. S., et al. 2005, Nature, 437, 855
- Watson et al. (2005) Watson, D., et al. 2005, ApJ, submitted, astro-ph/0510368
- Winkler et al. (2003) Winkler, C., et al. 2003, A&A, 411, L1
- York et al. (2000) York, D. G., et al. 2000, AJ, 120, 1579