Modelling galaxy spectra in presence of interstellar dust.
II. From the UV to the far infrared
Abstract
In this paper, we present spectrophotometric models for galaxies of different morphological type whose spectral energy distributions (SEDs) take into account the effect of dust in absorbing UV-optical light and re-emitting it in the infrared (IR). The models contain three main components: (i) the diffuse interstellar medium (ISM) composed of gas and dust whose emission and extinction properties have already been studied in detail by Piovan et al. (2006), (ii) the large complexes of molecular clouds (MCs) in which new stars are formed and (iii) the stars of any age and chemical composition.
The galaxy models stand on a robust model of chemical evolution that assuming a suitable prescription for gas infall, initial mass function, star formation rate and stellar ejecta provides the total amounts of gas and stars present at any age together with their chemical history. The chemical models are taylored in such a way to match the gross properties of galaxies of different morphological type. In order to describe the interaction between stars and ISM in building up the total SED of a galaxy, one has to know the spatial distribution of gas and stars. This is made adopting a simple geometrical model for each type of galaxy. The total gas and star mass provided by the chemical model are distributed over the whole volume by means of suitable density profiles, one for each component and depending on the galaxy type (spheroidal, disk and disk plus bulge). The galaxy is then split in suitable volume elements to each of which the appropriate amounts of stars, MCs and ISM are assigned. Each elemental volume bin is at the same time source of radiation from the stars inside and absorber and emitter of radiation from and to all other volume bins and the ISM in between. They are the elemental seeds to calculate the total SED.
Using the results for the properties of the ISM and the Single Stellar Populations (SSPs) presented by Piovan et al. (2006) we derive the SEDs of galaxies of different morphological type. First the technical details of the method are described and the basic relations driving the interaction between the physical components of the galaxy are presented. Second, the main parameters are examined and their effects on the SED of three prototype galaxies (a disk, an elliptical and a starburster) are highlighted. The final part of the paper is devoted to assess the ability of our galaxy models in reproducing the SEDs of a few real galaxies of the Local Universe.
keywords:
Galaxies – dust, extinction, emission; ISM – radiative transfer; Galaxies – formation, evolution, population synthesis; Galaxies – ellipticals, spirals, starburstersGalaxies spectra with interstellar dust
1 Introduction
In the early thirties of the past century, nearly at the same time of the Hubble discoveries (external galaxies and expansion of the Universe), another important discovery albeit less spectacular was made by Trumpler, i.e. the existence of the interstellar dust, whose implications could not be even imagined seventy years ago. He suggested the existence of a solid component, made by particles of many irregular shapes and dimensions, mixed and associated to the ISM and absorbing the stellar radiation: the interstellar dust. It was soon clear that the dust grains diffusing and absorbing the light emitted by the stars, in particular in the UV-optical region, cannot be neglected when measuring the light emitted by distant stars and galaxies.
In the local universe a turning point was the IRAS survey that discovered ten of thousands of galaxies, the major part of them too weak to be included in the optical catalogs, emitting more energy in the infrared than in all the other spectral regions. Galaxies with IR luminosity as high as , are the main population of extragalactic objects in the Local Universe.
Which is the reason of this huge IR luminosity? What powers the IR emission? Observations show that a great deal of the IR luminosity is emitted by dust, which absorbs the UV-optical light emitted by stars formed inside the MCs in huge bursts of activity and re-emits it in the IR. About the or more of the stellar light in the Local Universe is reprocessed by dust in the IR-submm range (Soifer et al., 1987).
An important new element in the study of high-redshift universe has been the detection by the COBE satellite of a FIR and sub-mm background radiation of extragalactic origin, the so-called Cosmic InfraRed Background (CIRB). This radiation implies that galaxies in the past should have been much more active in the far-IR than in the optical, and very luminous. It is likely that dust plays a fundamental role in shaping the SED of these galaxies (Puget et al., 1996; Guiderdoni et al., 1997; Fixsen et al., 1998; Hauser, 1998; Pozzetti et al., 1998). Observations with SCUBA (Barger et al., 1999; Hughes et al., 1998), ISOPHOT (Puget et al., 1999; Dole et al., 1999) and ISOCAM (Elbaz et al., 1998, 1999) have measured the CIRB at selected wavelengths trying to detect and identify the sources of this radiation. Even if it is not easy to identify these objects and to measure their redshift (Lilly et al., 1999; Barger et al., 1999), from the observations it turns out that the IR luminosity seems to be emitted be the counterparts at high redshift of the local LIRGs and ULIRGs, (ongoing high star formation, obscuration and reprocessing of the stellar radiation by a dusty environment).
Observations of high- galaxies at (Steidel et al., 1996; Madau et al., 1996) confirm that these objects are characterized by strong obscuration and emission by dust in the IR, in such a way that only taking into account their emission all over the spectral range it is possible to study their properties. Going to even higher redshifts, dust still plays a fundamental role even in objects at redshift , as indicated by the observations of QSOs and galaxies (McMahon et al., 1994; Omont et al., 1996; Soifer et al., 1998).
It clearly appears how it is no longer possible to leave dust aside in studies of the Milky Way, the Local and the High Redshift Universe.
Stars and dust are therefore tightly interwoven, even if the presence of dust is more spectacular in galaxies with strong star formation. In disk galaxies, with active, mild star formation, dust is partly associated to the diffuse ISM, partly to the molecular regions with star formation, and, finally, partly to the circumstellar envelopes of AGB stars. The contribution from all the three kinds of source is evenly balanced. In starburst galaxies, the situation is the same as above but now the key role is played by the regions of intense star formation. In elliptical galaxies, which show weak emission in the FIR (IRAS), dust is essentially associated to AGB stars of small mass that continuously loose matter refueling the ISM of gas and dust. The great importance of dust in relation to the formation and evolution of galaxies is evident. Dust strongly affects the observed SED of a galaxy, hampering its interpretation in term of the fundamental physical parameters, such as age, metallicity, initial mass function (IMF), mix of stellar populations, star formation history (SFH). Determinations of luminosity functions, number counts and many large-scale relations, such as the Tully-Fisher just to mention one, are also affected by the dust content of galaxies (Calzetti, 2001). The strong effect of dust, both for local (Bell & Kennicutt, 2001) and high redshift galaxies (Madau et al., 1996; Steidel et al., 1999), is the reason why the evolution with the redshift of the galaxy star formation rate (SFR) is still a matter of vivid debate (Madau et al., 1996; Steidel et al., 1999; Barger et al., 2000).
To get precious informations on the process of galaxies formation and evolution, we need to measure the SFR in galaxies at different redshifts, to understand when and how galaxies form their stars. To this purpose, many wide-field and all-sky surveys are currently running or have been just completed, e.g. the Galaxy Evolution Explorer [GALEX] (Martin et al., 1997) and the Sloan Digital Sky Survey [SDSS] (York et al., 2000) in the UV-optical range; the Two Micron All-Sky Survey [2MASS] (Skrutskie et al., 1997) and the Deep Near-Infrared Survey of the Southern Sky [DENIS] (Epchtein et al., 1997) in the near infrared. Recently, the Spitzer Space Telescope has open the gate to dedicated studies aimed at improving our knowledge of the Universe in the middle and far infrared (MIR and FIR), e.g. the SIRTF Wide-Area Infrared Extragalactic Survey (SWIRE - Lonsdale et al., 2003) and the SIRTF Nearby Galaxies Survey (SINGS - Kennicutt et al., 2003). The IR data will increase even more with the coming ASTRO-F mission (Pearson et al., 2004) and the advent of the James Webb Space Telescope (JWST). Combined with other astronomical databases, they provide a huge amount of UV-optical and IR data for millions of galaxies. Both spectral intervals are strongly affected by dust.
To fully exploit the information on the physical properties of the observed objects, this wealth of data must be accompanied by the continuous upgrade of the theoretical models of galaxy formation and evolution. This means that the effects of dust must be included in the SEDs of single stellar populations (SSP), assemblies of coeval stars with the same initial chemical composition, and in the SEDs of galaxies, composite systems made of stars of any age and chemical composition, gas and dust. Current theoretical models for both SSPs and galaxies in presence of dust and still unsatisfactory for many different reasons: the lack of theoretical spectra for very cool likely dust-rich stars, the poor knowledge of the dust properties in high metallicity environments and of the production of dust itself, the relation between gas and dust content.
With a few exceptions (e.g Bressan et al., 1998; Mouhcine & Lançon, 2002; Piovan et al., 2003, 2006), the light emitted by SSPs is modelled neglecting the presence of dust around their stars, both for AGB and young stars (e.g. Bertelli et al., 1994; Tantalo et al., 1998; Girardi et al., 2002; Bruzual & Charlot, 2003). When we fold many SSPs using the classical evolutionary population synthesis technique (EPS) we simply convolve their fluxes with the SFH of the galaxy. Many spectrophotometric models of galaxies are built in this way: there is no dust at the level of SSPs and again no dust at the level of the galaxy model (see e.g. Arimoto & Yoshii, 1987; Arimoto & Tarrab, 1990; Bruzual & Charlot, 1993; Leitherer & Heckman, 1995; Leitherer et al., 1999; Tantalo et al., 1996; Kodama & Arimoto, 1997; Kodama et al., 1998; Tantalo et al., 1998; Buzzoni, 2002, 2005). There are many reasons for this lack of realistic dusty models. First, before IRAS (1983) and COBE (1989), the important role played by dust in the galaxy SEDs was not fully appreciated and consequently only the stellar component was taken into consideration (Tinsley, 1972; Searle et al., 1973; Huchra, 1977). Second, the inclusion of the dusty component and the IR emission, in particular, require a higher level of sophistication of the models. Indeed one has to develop a 3D-model in which the sources of radiation and the emitting/absorbing medium are distributed; one has to face and solve the problem of the radiative transfer; one has to know optical properties of the dust; one has to simulate in a realistic way the interactions among the various physical components of a galaxy and the computational cost is often very high.
Despite the above difficulties, many efforts have been made to develop more and more complex and refined models, trying to take into account both the effects of attenuation and emission by dust. Considering the complexity of the problem, many even sophisticated studies are limited to the UV-optical region of the spectrum and consider or suggest and discuss only the attenuation of the stellar radiation by dust at various levels of detail (Guiderdoni & Rocca-Volmerange, 1987; Bressan et al., 1994; Tantalo et al., 1996; Fioc & Rocca-Volmerange, 1997; Tantalo et al., 1998; Buzzoni, 2002; Bruzual & Charlot, 2003; Buzzoni, 2005) . In some cases, the emission of dust in the IR/sub-mm range is considered (Rowan-Robinson & Crawford, 1989; Guiderdoni et al., 1998, e.g.), but no detailed model of the stellar sources whose radiation is reprocessed by dust is developed. In this case there is not a clear relationship between the sources of UV flux and the reprocessed IR flux. There are also models that include at different level of sophistication the effects of obscuration and emission by dust, but many of them have been developed to study particular objects or aspects of the radiative transfer, or the effects of the space distribution of the dust (Efstathiou & Rowan-Robinson, 1995; Bianchi et al., 1996; Wise & Silva, 1996; Cimatti et al., 1997; Gordon et al., 1997; Ferrara et al., 1999; Gordon et al., 2001; Misselt et al., 2001; Dopita et al., 2005; Dopita, 2005). They cannot be applied to a general spectrophotometric study of galaxies of different morphological type. The most recent models are those by Devriendt et al. (1999), Devriendt & Guiderdoni (2000), Silva et al. (1998), Silva (1999), Takagi et al. (2003, 2004, 2003). The model of Silva et al. (1998) has been later updated and improved by including the radio emission (Bressan et al., 2002), the nebular emission (Panuzzo et al., 2003) and the X-ray emission (Silva et al., 2003). They present some important differences in the way they approach the problem. For instance, the models of Silva et al. (1998) and Takagi et al. (2003) are merely theoretical and all properties are derived from a few important assumptions and/or ingredients, whereas those of Devriendt & Guiderdoni (2000) rescale the SEDs to match the average IRAS colors.
As in the meantime, much progress has been made in many aspects of this complex problem, for instance better understanding of the dust properties (Li & Draine, 2001; Draine & Li, 2001), more complete grids of stellar evolutionary models and isochrones (Salasnich et al., 2000; Girardi et al., 2000), new libraries of stellar spectra at high resolution (Zwitter et al., 2004), better chemical models (Portinari et al., 1998), new SSPs with dust (Piovan et al., 2003, 2006), and finally more detailed, multi-phase chemical models (Dwek, 1998), we intend to present here a new model of population synthesis in dusty conditions trying to take advantage of some of these advancements. It follows the theoretical approach of Silva et al. (1998), but yet improves upon important aspects. Major changes are related to the chemistry and optical properties of the dust (going from using updated cross sections for absorption and emission processes, to including new grain size distribution laws, to more accurate description of the radiative transfer for star forming regions), to better models of star formation and chemical enrichment histories in galaxies including the most recent chemical yields and the effect of galactic winds (whenever required), and finally to more recent libraries of SSPs to calculate the photometric properties of the galaxies. The resulting galaxy SEDs go from the far UV to the far IR.
2 Strategy of the study
The model we have adopted is shortly summarized in Sect. 3 where first we define the galaxy components we are dealing with, i.e. bare stars, stars embedded in MC complexes, and diffuse ISM (Sect. 3.1); second we outline the recipes and basic equations for the gas infall, chemical evolution, initial mass function and SFR (Sect. 3.2); third we describe how the total amounts of stars, MCs and ISM present in the galaxy at a certain age are distributed over the galaxy volume by means of suitable density profiles, one for each component (Sect. 3.3) that depend on the galaxy type: disk galaxies (Sect. 3.3.1), spheroidal galaxies (Sect. 3.3.2), and composite galaxies with both disk and bulge (Sect. 3.3.3). In Sect. 4 we briefly summarize some useful basic relationships/equations by Piovan et al. (2006) on modelling the dusty ISM. In Sect. 5 we explain how the SEDs of galaxies of different morphological type are calculated. First the technical details of the method are described and basic relationships/equations describing the interaction between the physical components of the galaxy are presented. Second, we shortly described the SSPs library in use (Piovan et al., 2003, 2006) and the space of the parameters. Third, three prototype galaxies (a disk galaxy, an elliptical galaxy and a starburst galaxy) are used to show the effects on the galaxy SED of varying the parameters. This is presented in Sect. 5.2.1 for an elliptical galaxy, in Sect. 5.2.2 for a disk galaxy, and finally 5.2.3 for a starburst galaxy. The final part of the paper is devoted to assess the ability of our model in reproducing the SED of a few galaxies of different morphological type belonging to the Local Universe. In Sect. 6, we present two late-type spiral galaxies, in Sect. 7, we show two early-type galaxies and finally in Sect. 8 we examine two well studied starburst galaxies. Some concluding remarks are drawn in Sect. 9. Finally, the mathematical derivation of some expressions presented in this paper are given in Appendices A, B, and C.
3 Galaxy Models
3.1 The main components and outline of the model
First, the galaxy models we are dealing with contain at least three components:
-
The large complexes of MCs in which active star formation occurs. In our model we do not take HII regions and nebular emission into account. Very young stars are totally or partially embedded in these parental MCs and the SEDs emitted by these stars are severely affected by the dusty MCs environment around them and skewed toward the IR. (see Piovan et al., 2006, for more details)
-
The populations of stars that are no longer embedded in their parental MCs. These stars can be subdivided in the intermediate age AGB stars (from about 0.1 Gyr to a few Gyr) that are intrinsically obscured by their own dust shells as described in Piovan et al. (2003), and the old stars which shine as bare objects.
Second, the amount of stars and gas (and its components) present in a galaxy at any age must be the result of the star formation activity framed in a suitable scenario.
Third, we have to adopt a suitable scheme for the 3D distribution of the three components in the galaxy volume, in order to describe their interaction, and to calculate the transfer of the radiation across the ISM of the galaxy.
3.2 Gross history of star formation and chemical enrichment
The star formation and chemical enrichment histories of the model galaxies are described by the so-called infall-model developed by Chiosi (1980), and ever since used by many authors among whom we recall Bressan et al. (1994), Tantalo et al. (1996), Tantalo et al. (1998), and Portinari et al. (1998). In brief, within a halo of Dark Matter of mass , radius , and hence known gravitational potential, the mass of the luminous matter, , is supposed to grow with time by infall of primordial gas according to the law
| (1) |
where is the infall time scale. The constant is fixed by assuming that at the present age the mass is equal to , the luminous asymptotic mass of the galaxy (see also for more details Tantalo et al. (1996, 1998)):
| (2) |
Therefore, the time variation of the baryonic mass is
| (3) |
Indicating with the mass of gas at the time , the corresponding gas fraction is . Denoting with the mass abundance of the -th chemical species, we may write where by definition . The general set of equations governing the time variation of the generic elemental species in presence of gas infall, star formation, and gas restitution by dying stars has been introduced and numerically solved by Talbot & Arnett (1971) for closed models and modified by Chiosi (1980) to include the infall term for open models:
where is the SFR, is the IMF (by mass), and are respectively the lower and upper bounds of the IMF, and are the lifetime and the birth time of a star of mass . is the fraction of a star of initial mass that is ejected back in form of the species . The first term on right-end side represents the depletion of the species from the ISM due to the start formation; the second term represents the growth of the species ejected back to the ISM by stars. The last term is the gas accretion rate by infall. In the above formulation only the ejecta of single stars are included.
It has been modified to include the contribution of Type Ia supernovae assuming that the originate in close binary systems (Matteucci & Greggio, 1986; Portinari et al., 1998) which are supposed to obey the same IMF of single stars:
and are the lower and upper limit for the mass of the binary system ( is the total mass of the binary system, and represents the mass of the primary and secondary star), is the distribution of the fractionary mass of the secondary , is the minimum value of this mass ratio and are the ejecta of SNæ Ia, assumed to be independent of or (Portinari et al., 1998). In the range between and of binary systems suitable to become a SN Ia, the contribution of single stars (the fraction of the total) is separated from that of binaries producing SNæ Ia (the fraction of the total).
The first three integrals on the right-end side represent the contribution of the ejecta of single stars. The fourth integral represents the contribution of the primary star in a binary system, assumed to be unaffected by its companion, as far as the released chemical ejecta are concerned. The fifth term is the contribution of SNæ Ia exploding when the secondary star pours all its ejecta on the primary star. The factor multiplying is , the rate of SNæ Ia as described in Greggio & Renzini (1983). Following Portinari et al. (1998) we have adopted , and . The distribution function of the fractionary mass of the secondary is (Greggio & Renzini, 1983).
The SFR, i.e. the number of stars of mass born in the time interval and mass interval , is given by . The rate of star formation is the Schmidt (1959) law adapted to our model which, normalized to , becomes
| (6) |
The parameters and are extremely important: yields the dependence of the star formation rate on the gas content. Current values are or . The factor measures the efficiency of the star formation process.
In this type of model, because of the competition between gas infall, gas consumption by star formation, and gas ejection by dying stars, the SFR starts very low, grows to a maximum and then declines. The time scale (eqn. 1) roughly corresponds to the age at which the star formation activity reaches the peak value.
The chemical models are meant to provide the mass of stars, , the mass of gas and the metallicity to be used as entries for the population synthesis code.
We also introduce in the model composite galaxies made of a disk and a bulge. In this case the mass of the galaxy is the sum of the two components. The disk and the bulge are assumed to evolve independently and for each component the evolution of its , and will be followed.
3.3 The spatial distribution of stars and ISM
In the classical EPS, the structure of a galaxy has no effect on the total SED which is simply obtained by convolving the SSP spectra with the SFH. The galaxy structure is mimicked by considering different SFHs for the various morphological types and/or componenents of a galaxy, e.g. bulge and disk (Buzzoni, 2002). This simple convolution is no longer suitable to be used when the ISM and the absorption and IR/sub-mm emission by dust are taken into account. In this case the spatial distribution of the ISM, dust and stars in the galaxy should be specified. To this aim we start from the observational evidence that the spatial distribution of stars and ISM depends on the galaxy type. In our models we consider three prototype distributions, i.e. a pure disk, a spheroid and combination of the two to simulate late-type (with no bulge), early-type (classical ellipticals), and intermediate-type (with a prominent bulge) galaxies, respectively.
3.3.1 Disk galaxies
The mass density distribution of stars, , diffuse ISM, , and MCs, , inside a disk galaxy can be represented by double decreasing exponential laws so that the mass density decreases moving away from the equatorial plane and the galactic center or both.
Taking a system of polar coordinates with origin at the galactic center [], the height above the equatorial plane is and the distance from the galactic center along the equatorial plane is , where is the angle between the polar vector and the z-axis perpendicular to the galactic plane passing through the center. The azimuthal symmetry rules out the angle and therefore the density laws for the three components are:
| (7) |
where can be or that is stars, diffuse ISM and star forming MCs. , , and are the radial scale lengths of stars, MCs and ISM, respectively, whereas , , are the corresponding scale heights above the equatorial plane. To a first approximation, we assume the same distributions for stars and MCs so that and thus reducing the number of scale parameters. Distributions with different scale parameters for the three components are, however, possible.
The constants vary with the time step. Let us indicate now with the age of the galaxy to be modelled. For the gaseous components only the normalization constants and are required as both loose memory of their past history and what we need is only the amount and chemical composition of gas at the present time. This is not the case for the stellar component for which is needed at each time . In other words to calculate the stellar emission we need to properly build the mix of stellar populations of any age as result of the history of star formation.
The normalization constants are derived by integrating the density laws over the volume and by imposing the integrals to equal the mass obtained from the chemical model. In general, the mass of each component is given by
| (8) |
The mass of stars born at the time is given by , and therefore will be obtained by using . is the result of gas accretion, star formation and gas restitution by dying stars. The current total mass is a fraction of . The double integral (in and ) is numerically solved for to be used in eqn. 7.
The galaxy radius is left as a free parameter of the model, thus allowing for systems of different sizes and distributions of the components.
There is a final technical point to examine, i.e. how to subdivide the whole volume of a disk galaxy into a number of sub-volumes so that the energy source inside each of these can be approximated to a point source located in their centers. This requires that the coordinates [] are divided in suitable intervals. As far as the radial coordinate is concerned, test experiments carried out in advance have indicated that subdividing the galaxy radius in a number of intervals going from to would meet the condition, secure the overall energy balance among the sub-volumes, speed up the computational time and yield numerically accurate results.
The number of radial intervals is derived by imposing that the mass density among two adjacent sub-volumes scales by a fixed ratio , where is a constant. Upon simple manipulations the above relation becomes . Therefore, the radial grid is equally spaced in constant steps given by (Silva, 1999).
The grid for the angular coordinate is chosen in such a way that spacing gets thinner approaching the equatorial plane, thus allowing for more sub-volumes in regions of higher mass density. We split the angle going from 0 to in sub-values. We need an odd value for so that we have sub-angles per quadrant. Following Silva (1999), the angular distance between the two adjacent values of the angular grid is chosen in such a way that subtends a fraction of the disk scale height ; in other words . Logarithmic angular steps are then imposed where is determined by the condition that the second angular bin near the equatorial plan is , with . This implies .
The grid for the angular coordinate is chosen to be suitably finely spaced near and to get progressively broader and broader moving away clockwise and counterclockwise from . The angular steps are spaced on the logarithm scale. As a matter of fact, thanks to the azimuthal symmetry it is sufficient to calculate the radiation field impinging on the volume from all other volumes . A grid thinner at than elsewhere guarantees the approximation of point-like energy sources at the center of the volume elements and the conservation of the total energy in turn.
3.3.2 Early-type galaxies
The luminosity distribution of early-type galaxies can be described by the density profiles of Hubble, de Vaucouleurs and King (Kormendy, 1977), the most popular of which is the King law that yields a finite central density of mass (Froehlich, 1982). However, following Fioc & Rocca-Volmerange (1997), we use a density profile slightly different from the King law in order to secure a smooth behavior at the galaxy radius . We suppose that the mass density profiles for stars, MCs, and diffuse ISM are represented by the laws
| (9) |
where again can be or (stars, diffuse ISM and MCs) and , , are the core radii of the distributions of stars, MCs, and diffuse ISM, respectively.
The density profile has to be truncated at the galactic radius , which is a free parameter of the model. This would prevent the mass for . In analogy to what already made for disk galaxies, the constants , and can be found by integrating the density law over the volume and by equating this value of the mass to the correspondent one derived from the global chemical model
| (10) |
where while and have the same meaning as in Sect. (3.3.1). The integral is numerically evaluated and solved for .
Like in the case of disk galaxies, the last step is to fix the spacing of the coordinate grid []. The problem will be simpler and the calculations will be faster than in the previous case because of the spherical symmetry. The spacing of the radial grid is made keeping in mind the energy conservation constrain. Also in this case we take a sufficiently large number of grid points . The condition on the density ratio between adjacent volumes, with constant (Silva, 1999), implies
| (11) |
where usually . The coordinate is subdivided into an equally spaced grid, with elements in total, and . Since the distribution is spherically symmetric, i.e. independent from , we do not need a thinner grid toward the equatorial plane. For the azimuthal coordinate we adopt the same grid we have presented for disk galaxies.
3.3.3 Intermediate-type galaxies
Intermediate-type galaxies are characterized by the relative proportions of their bulge and disk: they go from the early S0 and Sa where the bulge is big, to the late Sc and Sd where the bulge is small or negligible. In our models, we take all this into account by means of different SFHs for the disk and the bulge. Furthermore, both in the bulge and disk we consider the three components (ISM, MCs and stars) in a realistic way. In analogy to what already made for purely disk galaxies we adopt a system of polar coordinates with origin at the galactic center []. Azimuthal symmetry rules out the coordinate .
In the disk, the density profiles for the three components are the double decreasing exponential laws of eqn. (7). Accordingly, we introduce the scale lengths , , , , and , where the suffix indicates that now the scale lengths are referred to the disk-bulge composite model. In the bulge the three components are distributed according to the King-like profiles defined in eqn. (9), where now the core radii , and are referred to the bulge. The constants of normalization are derived in the same way described in Sects. 3.3.1 and 3.3.2 The two SFHs of disk and bulge are assumed to be independent and are simply obtained from the chemical models where the mass of disk and bulge are specified. The content in stars, MCs and ISM in a given point of the galaxy will be simply given by the sum of the contributions for the disk and bulge.
Owing to the composite shape of the galaxy (a sphere plus a disk), we have to define a new mixed grid sharing the properties of both components, i.e. those described in Sect. 3.3.1 and Sect. 3.3.2. Let us indicate with the bulge radius and with the galaxy radius. The radial grid is defined in the following way. We build two grids of radial coordinates, and , one for the disk and one for the bulge, in analogy to what we did in Sects. 3.3.1 and 3.3.2. As the grid of the bulge is not equally spaced, but thicker toward the center of the galaxy, we take the coordinates of the bulge grid if , while if , we take the coordinates of the disk until . For the angular coordinate we proceed in the same way. We build and as in Sects. 3.3.1 and 3.3.2. In this case the disk grid is thinner toward the equatorial plane of the galaxy whereas the bulge grid is equally spaced, so we take the coordinates of the disk as long as and elsewhere. For the azimuthal grid there is no problem as it is chosen in the same way both for the disk and the bulge.
3.4 The elemental volume grid
Assigned the geometrical shape of the galaxies, the density distributions of the three main components, and the coordinate grid (The number of grid points for the three coordinates is ), the galaxy is subdivided into small volumes , each one identified by the coordinates of the center given by the mid-point of the coordinate grid , and . Thereinafter the volume will be simply indicated as . The mass of stars, MCs, and diffuse ISM, in each volume are easily derived from the corresponding density laws where stands for stars, MCs, and ISM. By doing this, we neglect all local gradients in ISM and MCs (gradients inside each elemental volume). Since the elemental volumes have been chosen sufficiently small, the approximation is fairly reasonable.
4 Extinction and emission of the diffuse ISM
Piovan et al. (2006) presented a detailed study of the extinction and emission properties of dusty ISMs. They take into account three dust components, i.e. graphite, silicates and PAHs and the final global agreement reached between theory and the ISM extinction and emission data of MW, LMC and SMC has been very good. As we are now going to include this dusty ISM model in our galaxies, it is wise to briefly summarize here the basic quantities and relationships in usage.
First of all, the total cross section of scattering, absorption and extinction is given by
| (12) |
where the index stands for absorption (abs), scattering (sca), total extinction (ext), the index identifies the type of grains, and are the lower and upper limits of the size distribution for the i-type of grain, is the number density of atoms, are the dimension-less absorption and scattering coefficients (Draine & Lee, 1984; Laor & Draine, 1993; Li & Draine, 2001) and, finally is the distribution law of the grains (Weingartner & Draine, 2001a). With the aid of the above cross sections it is possible to calculate the optical depth along a given path
| (13) |
where is the optical path and all other symbols have their usual meaning. In this expression for we have implicitly assumed that the cross sections remain constant along the optical path.
Let us name , and the contributions to the emission by small grains, big grains and PAHs, respectively. How these quantities are calculated is widely described in Piovan et al. (2006) to whom the reader should refer for more details. Let us summarize here just the key relationships in usage.
The contribution to the emission by very small grains of graphite and silicates is
| (14) | |||||
where is the distribution temperature from to attained by grains with generic dimension under an incident radiation field and is the Planck function. are the absorption coefficients, is the Weingartner & Draine (2001a) distribution law for the dimensions, is the upper limit for thermally fluctuating grains, is the lower limit of the distribution.
The emission by big grains of graphite and silicates is evaluated assuming that they behave like black bodies in equilibrium with the radiation field. Therefore we have
| (15) |
where is the upper limit of the distribution and the meaning of the other symbols is the same as in eqn. 14.
The emission by PAHs is given by
where the ionization of PAHs is taken into account (Weingartner & Draine, 2001b) and is the fraction of ionized PAHs with dimension . and give the energy emitted at wavelength by a molecule of dimension , as a consequence of absorbing a single photon with energy . and are the limits of the distribution and is the incident radiation field.
5 The galaxy SED
Given the main components of a galaxy, their spatial distribution, the coordinate system, and the grid of elemental volumes, to proceed further one has to model the interaction among stars, dusty ISM and MCs to simulate the total SED emerging from the galaxy.
Let us consider a generic volume of the galaxy: it will receive the radiation coming from all other elemental volumes . The radiation travelling from one volume to another interacts with the ISM comprised between any two generic volumes. Therefore one has to take into account the energy that is both absorbed and emitted by the ISM under the interaction with the radiation field. Two simplifying hypotheses are worth being made here:
(i) The dust contained in a generic volume does not contribute to the radiation field impinging on the volume . This approximation stands on the notion that, in first approximation, owing to the low optical depths of the diffuse ISM in the MIR/FIR, dust cannot effectively absorb the radiation it emits, except for high density regions such as MCs, for which dust self-absorption has already been taken into account. In other words, the dust contained in will be transparent to the IR radiation emitted by the dust contained in the volume . Therefore, only stars and MCs will contribute to the incoming radiation.
(ii) Following Rybicki & Lightman (1979), the radiative transfer from a generic volume to is simply calculated by means of the so-called effective optical depth defined by
| (17) |
The above relation stands on the following considerations: scattering increases the absorption, however as photons are not destroyed, the effective optical depth must be lower than the sum of the optical depths by scattering and absorption but higher than the one by sole absorption (Rybicki & Lightman, 1979). Although this expression for has been derived for photons randomly travelling across an absorbing diffusive medium, so that it would strictly apply only to an infinite, homogeneous, isotropically scattering medium, we make use of it here. The results from the above approximation have been compared by Silva et al. (1998) with those by Witt et al. (1992) and Ferrara et al. (1999) using Monte-Carlo methods to solve radiative transfer problems. The results fully agree with those by Witt et al. (1992) and Ferrara et al. (1999) in the case of spherical symmetry and partially disagree in the case of disk galaxies. For these latter the quality of agreement depends on view angle between the galaxy and the observer (Silva et al., 1998).
The total radiation field incident on is
where the summations are carried over the whole ranges of with and ; is the value averaged over the volume of the square of the distance between the volumes and ; is the effective optical depth from to defined by eqn. (17), which by means of eqn. (13) becomes
| (19) | |||||
This integral represents the number of H atoms contained in the cylinder between and . All details on the derivation of this quantity and are given in Appendix A and B.
The two terms and are the emission by MCs and stars per unit volume of . They are evaluated at the center of the volume element.
Let us now define two kinds of SSPs: those that are already free of the parental cloud and are indicated as (classical free SSPs), and those that are still embedded in their parental dusty molecular clouds and are indicated as (dusty SSPs).
Let us denote with the fraction of the SSP luminosity that is reprocessed by dust and with the time scale for this to occur, in such a way that
| (20) |
where is a suitable parameter determining the evaporation time of the parental MCs. Accordingly, the fraction of SSP luminosity that escapes without interacting with dust is .
The parameter will likely depend on the properties of the ISM and type of galaxy in turn. Plausibly, will be of the order of the lifetime of massive stars. It will be discussed in more detail in Sect. 5.1.
The monochromatic luminosity of a free SSP of given age , born at , and metallicity for unit of SSP mass is therefore
| (21) |
Knowing the the monochromatic luminosity of the naked SSPs , the monochromatic luminosity of the dust enshrouded SSPs has been derived as described in Piovan et al. (2006). The emission of stars and MCs per unit volume, and respectively, are given by
| (22) |
and
| (23) |
It is worth noticing that luminosity of the MCs depends only on the luminosity of the young embedded stars and not on the mass of molecular gas enclosed in the MCs. The factors and follows from relations (20) and the definition of .
Once calculated the incident radiation field we can obtain the emission per unit volume from the dusty ISM. At this point the azimuthal and spherical symmetries of the galaxy models become very important. The emission per unit volume from the dusty ISM calculated at the center of the volume elements is the same everywhere, independently of the coordinate . Therefore it is sufficient to calculate the dust emission at for all possible values of and on this ”galaxy slice”. It is obvious that the symmetry will be lost when considering the total emission from a certain volume element because owing to the adopted spacing of the galaxy the elemental volumes are not equal. However, as long as we refer to the emission per unit volume, the symmetry properties above allows us to avoid tedious and lengthy numerical calculations. The total radiation field for unit volume emitted by a single element is
| (24) |
where is the radiation outgoing from a unit volume of the dusty diffuse ISM and is given by the sum of the contributions from silicates, graphite and PAHs described by eqns. (14), (15), and (4). The total outgoing emission from the volume is therefore given by obviously different from volume to volume.
The radiation emitted by each elemental volume has to travel across a certain volume of the galaxy itself before reaching the edge, escaping from the galaxy, and being detected by an external observer. While finding its way out, the radiation is absorbed and diffused by the ISM. The external observer will see the galaxy along a direction fixed by the angle , where means that the galaxy is seen face-on, whereas means that the galaxy is seen edge-on. To this aim, we need to determine the properties of the cylinder of matter from the center of each element to the edge of the galaxy, along the direction in order to calculate the amount of radiation emitted by the galaxy along this direction. Therefore, the monochromatic luminosity measured by an external observer is
| (25) | |||||
where is the effective optical depth between and the galactic edge along the direction . The details on the derivation of the effective optical depth are described in Appendix C.
5.1 SSPs in usage and parameters of the galaxy model
In this section first we shortly present the libraries of stellar models, isochrones, and stellar spectra that are used to calculate the SEDs of SSPs and galaxies. Second we summarize the results for SSP intrinsically affected by dust calculated by Piovan et al. (2003, 2006) and in the case of young SSPs we describe the effect of the parameters of the model. Finally, we present the other parameters governing the the ISM and chemical model and the galaxy geometry.
(1) Libraries of stellar models and stellar spectra: We adopt the set of isochrones by Tantalo et al. (1998) (anticipated in the data base for galaxy evolution models by Leitherer, Alloin, von Alvensleben, Gallager, Huchra & et al. (1996)). The underlying stellar models are those of the Padova Library calculated with convective overshooting and are amply described by Fagotto et al. (1994a, b, c), so that no detail is given here.
The library of stellar spectra is from Lejeune et al. (1998), which stands on the Kurucz (1995) release of theoretical spectra, however with several important implementations (see Piovan et al., 2003, 2006, for more details).
(2) Dust enshrouded SSPs As already mentioned, young stars and AGB stars are both surrounded by their own dust. The young stars because they are immersed in MCs, the AGB stars because they eject dust on their own. In both cases the UV-optical light emitted by the stars is absorbed and re-emitted in the FIR. But for old ellipticals, in which star formation stopped at early epochs because of the galactic wind so that no young stellar populations embedded into parental MCs are present, for all the other morphological types the impact of young dusty populations on the galaxy SED has to be considered. This indeed is stronger than the one caused by dusty AGB stars (see below). The reason of it can be reduced to the fact that while for young SSPs all the emitted energy interacts with the dusty environment, in the case of old SSPs only AGB stars interact with the dust. However, as the ranges of wavelength interested in the case of young SSPs and dusty AGBs are different, the accurate description of the region around requires that the dusty shells around AGB stars are fully taken into account. SSPs for AGB stars and young stars with this effect built in are by Piovan et al. (2003) and Piovan et al. (2006).
Intermediate age and old SSPs: In this paper we decided not to use the SSPs of Piovan et al. (2003) where the effects of circumstellar dusty shells around the AGB stars (of intermediate/old ages) are included. The main reason is that dust enshrouded AGB stars are available only for three metallicities. Work is in progress to build a more complete set of SEDs in which the effects of the dusty shells around AGB stars are included.
Young SSPs: In general dust around young stars shifts the UV/optical radiation into the MIR/NIR. However, the SED of young SSPs (Piovan et al., 2006) is governed by a number of parameters describing the MC itself, chief among which are the optical depth in the band, the scale radius of the cloud , the abundance in the two log-normal populations of very small carbonaceous grains according to the distribution law of Weingartner & Draine (2001a), and finally the ionization state of PAHs. In addition to these, there is another parameter related to young MCs, namely the evaporation time . Let us examine their effect in some detail.
(i) The MC optical depth in the band. Up to now in our library of SSPs only two values are considered, i.e. and 35, corresponding to intermediate and high optical depths. The effect of changing the optical depth is simple: the higher the optical depth, the higher is the amount of energy shifted toward longer wavelengths. A remark is worth here. Using a certain set of SSPs (i.e. a set with given parameters) we implicitly fix the optical depth. Clearly, the optical depth of MCs not only increases with the cloud mass, decreases with the cloud size, and in general increases with the cloud density, but also increases with the metallicity. Therefore the ideal situation would be the one in which MCs in galaxy models cover the whole range of masses, radii, densities and metallicities.
(ii) The scale radius of the MC. Two values are allowed, and 5. They correspond to MCs of different compactness. Keeping constant all other parameters, the peak of emission shifts to longer wavelengths at increasing scale radius (see also Takagi et al., 2003).
(iii) The carbon abundance per H nucleus fixes the abundance of this element in the two log-normal populations of very small grains in the Weingartner & Draine (2001a) law. As shown by Weingartner & Draine (2001a), the sole extinction curve is unable to constrain . It provides only an upper limit for , which at given ratio is reached when the very small carbonaceous grains and PAHs are able to account for the ultraviolet bump of the extinction curve. Values lower than the upper limit are possible. Without other constraints, for instance the IR emission of the region of interest, it is not possible to determine , which plays an important role in the IR emission of galaxies. Specifically, it drives the emission of PAHs in the MIR generated by young MCs. The effect of varying is simple: for higher values of , the PAH emission in the MIR reaches higher flux levels. In contrast, the UV-optical flux and the shape of the absorbed stellar emission do not depend on , because the extinction curve remains the same for different values of . As the global abundance of is fixed, the distribution of the grains has to compensate for the small number of small grains with an higher number of big grains. Therefore, for low values of we expect that the emission in the FIR slightly increases (the total energy budget has clearly to be conserved).
(iv) The ionization state of PAHs. The optical properties we have adopted are different for ionized and neutral PAHs (see Li & Draine, 2001, for more details). The ionization state of PAHs affects the PAH emission profile in the MIR. We considered three ionization models. The first is the one by Weingartner & Draine (2001b). The second model adopts for the MCs the same ionization profile calculated by Li & Draine (2001) for the diffuse ISM of the MW. The third model simply takes into account only neutral PAHs (very low ionization). In other words, we have a sequence of models going from ionized to neutral PAHs (see Piovan et al., 2006, for more details).
(v) : Following the simple recipe by Silva et al. (1998), this is the scale time required by a new generation of stars to get rid of the parental MCs (see also Piovan et al., 2006). In Silva et al. (1998) model, star formation is reduced to a point source scheme, in which stars born at the center of dusty MCs slowly evaporate them to eventually shine free. As pointed from Takagi et al. (2003), if the time of the star forming activity is shorter than the escaping time scale , the light coming from young stars is completely hidden at the UV-optical wavelenghts. In general, in Silva et al. (1998) model, for times shorter than , no light escapes from dusty star forming regions and therefore the light observed in the UV-NIR should be negligible for any aperture size of the galaxies. This is not what we observe in real galaxies especially in their central regions. The discrepancy is cured by adopting the more realistic descriptions in which stars are randomly distributed inside the MC, and solving the radiation transfer problem with the ray tracing method (see Piovan et al., 2006). We can reproduce in detail in this way the inner regions of starbursters like Arp and M. Even with the new scheme, the parameter drives the amount of energy emitted by the young stars that is absorbed and reprocessed by the local dust (i.e. in the region immediately around the stars themselves). The evaporation is simulated by letting more and more energy to escape without being reprocessed by dust. The time scale likely goes from 3 to 100 Myr, i.e. the evolutionary lifetime of a 100 and 5 respectively. High values of mean that young stars are longer hidden by the parental clouds and accordingly much of the light they emit in the UV-visible range is shifted to the FIR for a long period of time. In such a case a large fraction of the IR light emitted by a galaxy could be due to young stars still embedded in MCs. The opposite for low values of .
(3) Parameters of the ISM model are the fractionary mass of gas in the ISM and the metallicity .
(a) : The fraction of diffuse gas present in a galaxy with respect to the total amount of gas can be inferred from observational data on the ratio between the molecular and atomic gas. In disk galaxies for instance most of hydrogen in MCs is in form of , whereas the inter-cloud medium is mainly made of atomic . This parameter bears very much on emission and extinction by the diffuse ISM. The larger , the bigger is the amount of gas present in the diffuse ISM. Therefore, the emission (proportional to the number density of atoms) will be higher. Furthermore, extinction of the diffuse ISM as well will increase because of the bigger absorption by dust, which is also proportional to the number density of atoms in the diffuse ISM.
(b) Metallicity : The metallicity reached by the ISM of the galaxy fixes the properties of the dust, drives the intensity of the ISM emission and its ability in extinguishing the radiation field. We adopted as standard models for the three compositions of MW, LMC and SMC, that allow us to cover well this range of metallicities. The dust to gas ratio scales with the metallicity: the higher the metal content of a galaxy, the higher is the abundance of grains per atom. This simply implies that the ISMs of high metallicity galaxies will both absorb and emit more energy. For metallicities higher than the solar one (), we keep the relative proportions of silicates, graphite and PAHs of the diffuse ISM of the MW, scaled to the higher dust to gas ratio.
(4) Parameters of the chemical models: Chief among others are the exponent and the efficiency of the star formation law, the infall time scale , and limited to the case of elliptical galaxies the parameters fixing the gravitational and thermal energy of the gas and driving the onset of galactic winds. In the case of galaxies composed by disk and bulge, the number of parameters increases. There are , and together with , and , and the bulge to disk mass ratio . Finally, we will also consider the case in which galaxies may undergo a burst of star formation. The burst is introduced superimposing it to the star formation history law described by eqn. (6). The burst is described by the following parameters: the age at which the burst occurs, the enhancement factor amplifying the current efficiency , and, finally, the duration .
(5) Parameters of the geometrical models: In the case of early type galaxies (our spherical case) the parameters are , , , i.e. the core radii for the distribution of stars, MCs and ISM, respectively. In the case of disk galaxies the spatial distributions of the three components are fixed by the radial scale lengths , , and , and the scale heights , , and , with obvious meaning of the various symbols. For composite galaxies with disk and bulge the number of parameters increases dramatically as we are dealing with two distributions: the King law (as for early-type galaxies) for the bulge, described with the parameters , , and a double decreasing exponential law for the disk, described by the parameters , , and , , . In all types of model, the scale length of the young and old stellar populations is the same. Even if this reduces the number of parameters, in reality it would be interesting, for starburst galaxies in particular, to consider different spatial distributions for old and young stars (see Calzetti, 2001). Work is in progress to improve upon this type of model. The remaining geometrical parameters are: the radius of the galaxy and, if a bulge is present, the radius of this, and finally the angle of inclination going from edge-on to face-on galaxies, i.e. from to with respect to the z-axis perpendicular to the equatorial plane of the galaxy.
5.2 Role of the parameters in template model galaxies
In this section we analyze in detail the effect of the various parameters on galaxy SEDs. To this aim we calculate three template galaxies, i.e. an old early-type galaxy, a late-type spiral galaxy, and finally a starburst galaxy.
5.2.1 Early-type galaxies
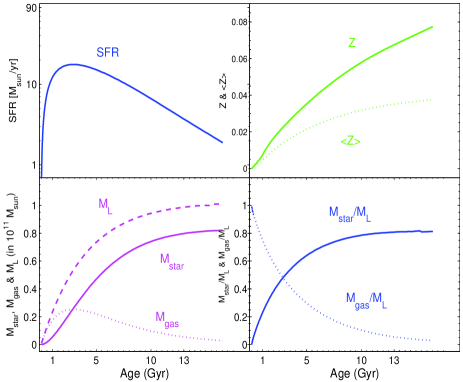
Early-type galaxies are simulated by means of spherical models whose total baryonic mass is and total dark matter mass is times higher (see Tantalo et al., 1996, for details). For the purposes of this section we limit ourselves to consider the typical SFH of an elliptical, characterized by a strong initial burst of stellar activity, early onset of galactic wind, and quiescence ever since. As the model stands on the infall scheme, the SFR starts small, increases to a peak value and then declines ever since. The time scale at which the peak occurs is of the order of the infall time scale that is fixed at =0.1 Gyr (Tantalo et al., 1996) which means that the model tends to the closed-box approximation but for the occurrence of galactic winds. The exponent for the star formation law is =1. The efficiency of star formation is . The reason for the above choice and more details can be found in Tantalo et al. (1996, 1998). The four panels of Fig. 1 show a few relevant quantities characterizing the galaxy.
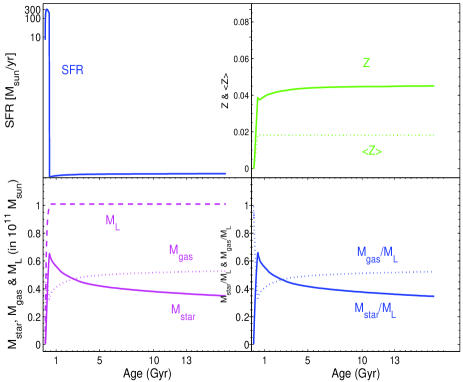
To study the effect of the parameters we consider two stages of the history of an early-type galaxy: the age of Gyr, when the SFR reaches the peak and the present age of Gyr after billion years of passive evolution.
In the very early stages of high star formation we can assume that dust is mostly concentrated in the dense regions of star formation. Following this idea we assign a low gas content to the diffuse ISM (, which implies that the mass in dusty MCs is about twice mass of the diffuse ISM). We adopt 40 Myr, a long evaporation time, which sounds reasonable for a high density star forming environment. Once the galactic wind has taken place and star formation has ceased, we can adopt and .
In the 13 Gyr model there is no longer star formation and the evolution is merely passive. If the galaxy is free of gas and only stars are present, the SED is expected to drop off long-ward of about . However elliptical galaxies of the local universe emit in the IR (Guhathakurta et al., 1986). The origin of this flux in the MIR/FIR may be due to diffuse dust which emits at those wavelengths. Therefore to match this part of the spectrum one has to allow for a small amount of diffuse ISM which is likely to exist. By imposing for our model of age Gyr, we assume that all the gas is in form of diffuse ISM. Interesting questions to rise are: how much gas can be present today in an elliptical galaxy? What is the source of this gas?
To answer the above questions let us examine how the gas content of an elliptical galaxy is expected to evolve with time (Gibson & Matteucci, 1997; Chiosi, 2000). According to the classical scenario (Larson, 1974), all the gas present in elliptical galaxies at the onset of the galactic wind is supposed to be expelled from the gravitational potential well of the galaxy into the intracluster medium. Despite the radiative losses, the energy input from supernova explosions, stellar winds and dynamical interactions overwhelms the gravitational potential and makes galactic wind to occur in such a way to happen later and later at increasing galaxy mass. Star formation suddenly ceases and consequently the energy input by Type II (early on) and Type I (afterwards) either stops (Type II) or get very small (Type I). All this requires about Gyr. Subsequently low mass stars () loose mass by stellar wind (during the red giant and the asymptotic giant branch phases) thus refueling the galaxy of gas in amounts that are comparable to those before the galactic wind (Chiosi, 2000). What is the fate of this gas?
In the most plausible scenario (Gibson & Matteucci, 1997) the phase of galactic wind should last for about 0.5-1 Gyr thanks to the energy input by Type Ia supernovae and then stop. The amount of gas lost by low mass stars during this time interval turns out to be very large (Chiosi, 2000) and it is not entirely clear how it can exceed the gravitational energy. Nevertheless, there is general consensus that on a rather short time scale the gas may escape the galaxy. Most likely a sort of dynamical equilibrium is reached in which gas is continuously ejected by stars and lost by the galaxy. It may happen that a tiny amount of gas is always present in the galaxy, thus accounting for the IR emission.
After the onset of the galactic wind, our chemical model is not able to describe this complex situation. Dying stars emit lots of gas whose fate is uncertain. Basing on the flux level observed in real galaxies, the gas content of the galaxy is reduced by a factor of the order of .
Finally, we are left with the geometrical parameters to fix. For the exponents and a value around could be taken for ellipticals. The value for the ISM is more uncertain. Following Froehlich (1982), Witt et al. (1992), and Wise & Silva (1996) we choose , that is the ISM is less concentrated toward the center than the stars.
Before galactic wind, at the ages of 0.15, the gas is made of molecular clouds and diffuse ISM. Therefore, we need the scale lengths of MCs, dusty ISM and stars for which we assume kpc. Afterwards, we need only the scale lengths for ISM and stars. Both are kept unchanged (0.5 kpc). In general we will assume in spheroidals to reduce the number of parameters.
In Table 1, columns (2) and (3), we summarize the set of parameters we have used to model our test ellipticals.
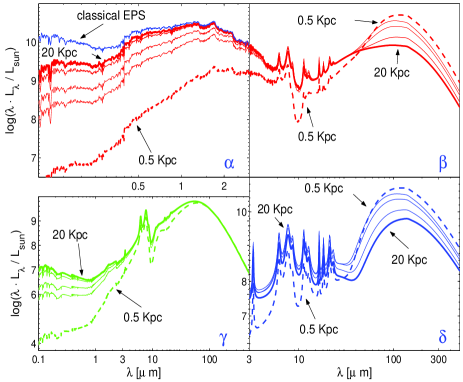
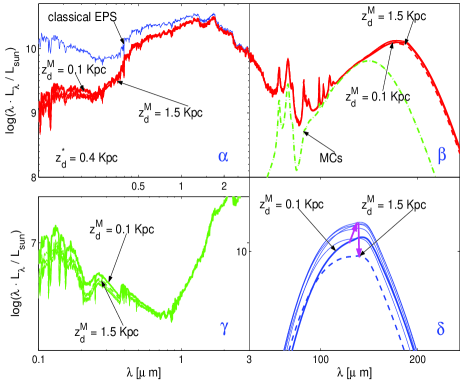
At the age of Gyr only the geometrical parameters need to be discussed. First we consider the galaxy radius , which is let vary from to kpc, i.e. from very expanded to very compact systems. In Fig. 2, we show the resulting SEDs together with the emission in the UV-optical region (bottom-left panel) and the contribution to the total flux by the diffuse ISM (bottom-right panel). At decreasing size of the galaxy, the optical depth increases: the dimension of the galaxy scales linearly, the density of matter and the numerical density of atoms increase as and, therefore, the optical depth increases as . From the top-right and bottom-left panels of Fig. 2 we can see the effect of it on the UV-optical/NIR part of the spectrum: the smaller the dimension, the stronger is the extinction of the UV-optical light. For the same reason the emission of dust in the FIR becomes stronger at decreasing dimensions because of the higher density (bottom-right panel of Fig. 2). The emission, in fact, linearly depends on the numerical density of atoms.
As the mass of the physical components of the galaxy and all their scale lengths are fixed (in our example all equal to Kpc), in models of smaller size more gas, stars and dust are stored in the outer regions with respect to the larger size models. In such a case the matter distribution tends to become uniform, a limit situation reached when . For compact objects, the peak of emission in the FIR also shifts toward shorter wavelengths. This is due to the higher temperature of the grains, thanks to the combined effect of the higher local emission and the presence of more sources in the outer regions (bottom-right panel of Fig. 2).
| (1) | (2) | (3) | (4) | (5) | (6) | (7) | (8) | (9) | (10) | (11) |
| Model – Galaxy | E | E | D | SB | M | NGC | NGC | NGC | Arp | M |
| Age11footnotemark: 1 | 13 | 0.15 | 13 | 13 | 13 | 13 | 13 | 13 | 13 | 13 |
| 22footnotemark: 2 | – | – | – | – | 19 | 5.5 | 21.5 | 20 | 76 | 3.25 |
| 33footnotemark: 3 | 1 | 1 | 1 | 1 | 2 | 1.2 | 2.2 | 2 | 1.35 | 0.18 |
| 44footnotemark: 4 | 0 | 40 | 5 | 15 or 30 | 5 | 3 | 0 | 0 | 80 | 100 |
| 55footnotemark: 5 | 1 | 0.3 | 0.5 | 0.5 | 0.35 | 0.55 | 1 | 1 | 0.5 | 0.9 |
| 66footnotemark: 6 | 0.5 | 0.5 | – | 0.5 | – | – | 0.5 | 0.5 | 1.0 | 0.2 |
| 77footnotemark: 7 | 0.5 | 0.5 | – | 0.5 | – | – | 0.5 | 0.5 | 0.5 | 0.35 |
| 88footnotemark: 8, | – | – | 5 | – | 5 | 5 | – | – | – | – |
| 99footnotemark: 9 | – | – | 5 | – | 5 | 5 | – | – | – | – |
| 1010footnotemark: 10 | – | – | 0.4 | – | 0.5 | 1 | – | – | – | – |
| 1111footnotemark: 11 | – | – | 0.4 | – | 0.5 | 1 | – | – | – | – |
| 1212footnotemark: 12 | 10 | 10 | 10 | 10 | 19 | 13 | 20 | 12 | 17 | 10 |
| 1313footnotemark: 13 | 0.1 | 0.1 | 4 | 9 | 4 | 5 | 0.1 | 0.1 | 9 | 9 |
| 1414footnotemark: 14 | 6 | 6 | 0.7 | 1 | 0.7 | 0.7 | 2 | 2 | 0.4 | 1.2 |
| 1515footnotemark: 15 | – | – | – | 12.95 | – | – | – | – | 12.95 | 12.95 |
| 1616footnotemark: 16 | – | – | – | 0.05 | – | – | – | – | 0.05 | 0.05 |
| 1717footnotemark: 17 | – | – | – | 30 | – | – | – | – | 60 | 5 |
| 1818footnotemark: 18 | – | – | 60∘ | – | 27∘ | 35∘ | – | – | – | – |
1Age in Gyr. 2Distance of the galaxy in Mpc. 3Baryonic mass of the galaxy in units of . 4Evaporation time in Myr of young SSPs from dusty parental regions. In the Gyr models and the galaxies NGC and NGC with no ongoing star formation, the parameter is set equal to . 5Fractionary gas content in the diffuse ISM. 6Ratio between the core radii of stars and ISM in the spherical models. 7Scale radii in kpc of stars and MCs in the spherical models. 8Radial scale in kpc of the diffuse ISM in the disk models. 8Radial scales in kpc of stars and MCs in the disk models. 9Vertical scale in kpc of the diffuse ISM in the disk models. 10Vertical scales in kpc of stars and MCs. 11Radius of the galaxy in kpc. 12Infall time scale in Gyr. 13Efficiency of star formation. 14Age of the beginning of the burst for starburst models in Gyr. 15Length of the burst for starburst models. 16Multiplying factor for the star formation for starburst models. 17Inclination angle.
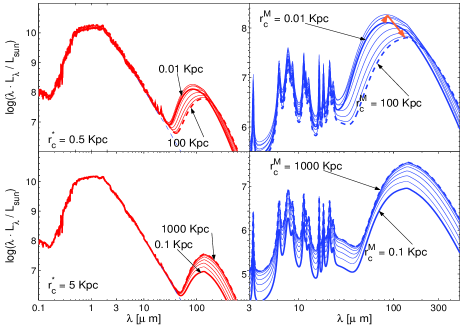
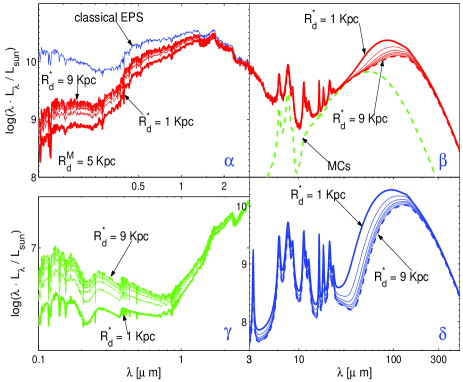
Other geometrical parameters are the scale length and the ratio that at fixed gives . We calculate a grid of models characterized by seven values of , i.e. , , , , , and kpc ( is fixed at kpc), and ten values of the ratio , i.e. , , , , , , , , and , for a total of models covering large intervals of and . The results obtained for various combinations of these parameters are presented in figs. 3 and 4. In Fig. 3, we show the results obtained keeping fixed and leaving free the ratio , or equivalently . Four values of are considered. For each of these on the left panel we show the total galaxy flux at varying , whereas on the right panel we display the corresponding contribution of the diffuse ISM to the total flux. For the two smallest values of , and kpc, at varying the emission in the FIR grows, reaches a peak value, and then declines. This can be explained in the following way. For and , the diffuse ISM is concentrated either in the inner or in the outer regions of the galaxy. In both cases the spatial distributions of the ISM does not favors the interaction with the stellar radiation: the FIR flux increases as grows from very small values to , which represents the best condition in which the intensity of the local radiation field is strong in high density regions. Moving to the flux decreases, because the dust is concentrated in regions of weaker radiation field. The emission peak shifts to longer wavelenghts because for small , as increases, the dust is confined in regions of lower radiation field intensity. For the two highest values of , and kpc, the flux simply increases as dust goes from being concentrated in the inner regions of the galaxy, to being shifted toward the outer regions with higher density of stars.
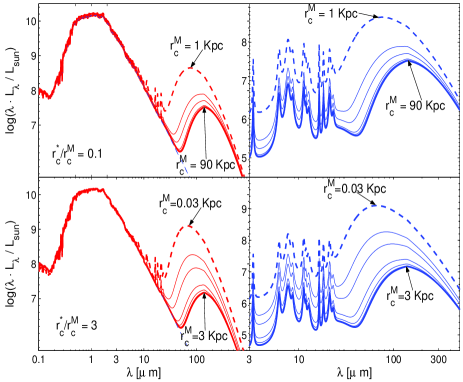
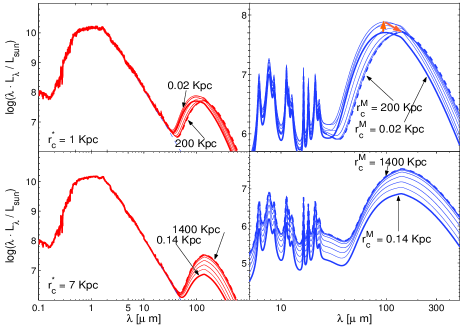
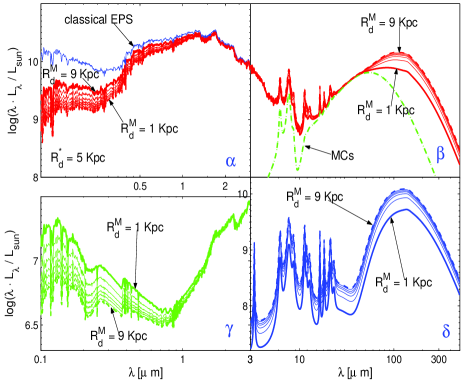
In Fig. 4 we keep fixed the ratio and let vary from to kpc. The result is the same for both cases no matter whether or . The FIR emission is stronger when both and are small, i.e. when stars and dust occupy the same inner region of the galaxy. With high values of the two radial scale lengths, stars and dust are more dispersed across the galaxy, therefore the FIR emission is weaker and the peak shifts toward longer wavelengths.
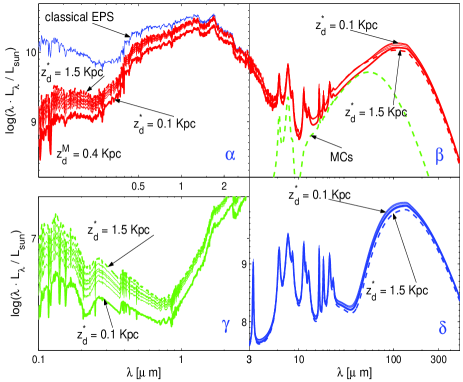
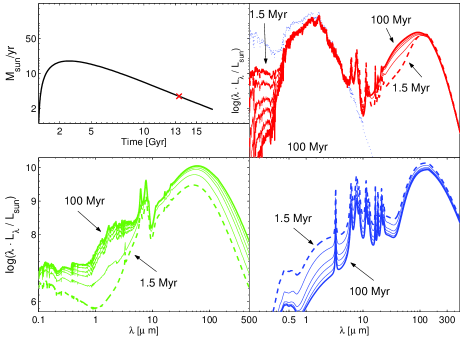
To show the effects of , the time scale for a young SSP to evaporate the MC in which it is embedded, and , the fractionary gas mass in the diffuse ISM, we take the Gyr old model galaxy, at the peak of star formation. In Fig. 5, we show the SEDs for several values of . The effect of this parameter is strong and straightforward: the longer this time scale, the higher is the obscuration of the UV-optical light because the energy of newly born young and luminous objects is long trapped by the dusty environment (top-right panel). Simultaneously, more energy is emitted in the FIR by the dusty MCs regions (bottom-left panel). In any case it is clear from the top-right and the bottom-right panel that an increase of , corresponds to a decrease of the emission by the diffuse ISM, whose peak also shifts toward longer wavelengths. The explanation is that increasing the UV-optical intensity of the local radiation field dramatically drops, leaving a cooler and weaker mean radiation field to heat the dust.
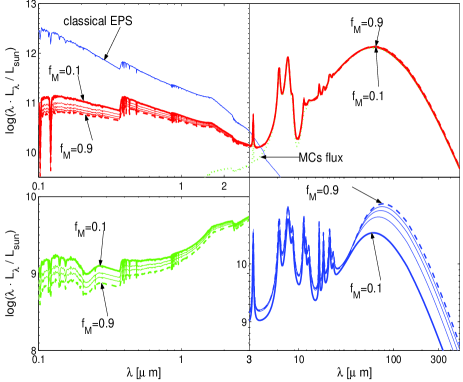
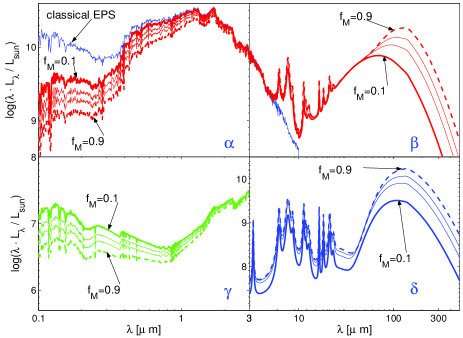
Finally, we compare in Fig. 6 the SEDs of our test galaxy at varying the amount of gas in the diffuse ISM, i.e. . The remaining gas is stored in MCs. As shown by the top panels, increasing the amount of gas in the diffuse ISM has little influence on the global SED. The reason is that the galaxy is at the peak of star formation, where the attenuation and IR emission are clearly dominated by the star forming MCs. Similar albeit smaller effects of are expected in starburst galaxies with high star formation rate. In any case, as expected, increasing the amount of gas in the diffuse ISM yields stronger attenuation of the light emitted by old and young stars (top and bottom left panels). The emission by the diffuse ISM (which anyhow scarcely contributes to the total flux) increases with the amount of gas and also becomes cooler because of the weaker local radiation field heating the grains (bottom right panel).
5.2.2 Late-type galaxies
We consider a disk galaxy of at the age of 13 Gyr. In our model disk galaxy (i.e. with infall scheme and the Schmidt law of star formation) and likely in real disk galaxies as well, the star forming activity never ceases. Due to the lack of significant galactic winds in disk galaxies, the gas remain for ever in the disk and continuously refuels star formation. This means that our model has to take all possible components into account even at the age of 13 Gyr: young stars just formed and still embedded in their parental molecular cloud, bare stars of any age and diffuse ISM. The task is more complicate than with the spheroidal models due to the lower degree of symmetry (only the azimuthal one).
The choice of the three main parameters driving the star formation and chemical enrichment of a disk galaxy, i.e. the infall time scale , the exponent , and the efficiency of the star formation rate, rests on the following considerations. In the star formation rate, typically varies from 1 (Schmidt, 1963)to 2 (Larson, 1991). In our model for a late-type galaxy the choice is guided by the Portinari et al. (1998) results for the Solar Vicinity. Therefore we adopt , and , whereas for the infall time scale we assume . The resulting star formation rate starts small, grows to a maximum at about Gyr, and then gently declines to the present day value.
The temporal evolution of a few physical quantities characterizing the model galaxy is shown in Fig. 7.
To proceed further other parameters must be specified. First, we fix the geometrical parameters, i.e. the radial and vertical scale heights, for which we make the most simple choice, i.e. kpc and kpc (the spatial scales for the three components are the same) in agreement with typical values found for local spiral galaxies such as M100 and M51 (Beckman et al., 1996). Second, we need to specify the fraction of the gas present in form of diffuse ISM. The task is not easy and to a certain extent beyond the aims of this study because it would require a multi-component description taking into account all heating and cooling processes that transform atomic likely hot gas into cool molecular gas. So, as already presented in Sect. 5.1, we consider as a parameter, and, for the sake of illustration, we adopt . This means that half of the gas is in the diffuse medium and half in the MCs. Third, for the timescale we assume Myr which roughly corresponds to the lifetime of the most massive stars. This means that the heavily obscured part of young stars lifetime is rather short. For the sake of illustration we consider the case with inclination angle .
In Table 1, column (4), we summarize the set of parameters we have used to model our test disk galaxy.
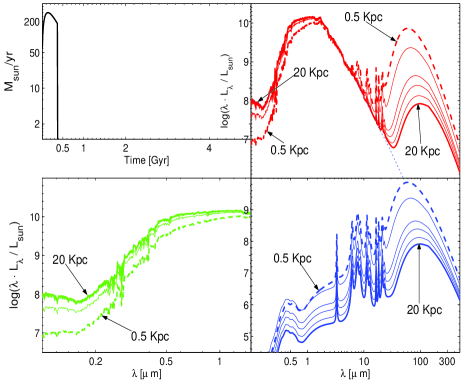
In the same way we did for the ellipticals we calculated a sequence of models with going from to kpc, from very expanded to very compact systems. In Fig. 8 we show the resulting SEDs (top panels and ) also with the spectrum calculated with the classical EPS. In the bottom panels we show the emission in the UV-optical region (bottom-left panel) coming from MCs and the contribution to the total flux coming from the diffuse ISM (bottom-right panel). The effect of the radius is the same as for ellipticals: for smaller galaxies, higher optical depths, the stronger will be the extinction of the UV-optical light. For the same reason the emission of dust in the FIR will be stronger for the smaller dimensions because of the higher density (bottom-right panel of Fig. 8).
In the case of disk galaxies the degree of symmetry is lower than for spheroidal systems as only azimuthal symmetry is conserved. In Fig. 9, we show the SED at varying the radial scale lengths and . In the four left panels we keep fixed and vary , the opposite in the four right panels. Examining the four panels on the left, we notice that once fixed , the attenuation becomes weaker going from low to high values of (panels and ). This is simply due to the fact that growing the value of , more stars are distributed in the outer regions of the galaxy and thus they are less obscured. It is worth noticing how in our model disk galaxy the attenuation is partially due to young MCs and partially to the diffuse ISM. The ultimate reason of this is the low evaporation time for dusty regions we have chosen for the model. In panel we see the effect of attenuation on the emission of MCs: again it is stronger for , because for these values young dusty SSPs are confined in the inner region . The effect of varying the star scale on the diffuse ISM emission (panel ) is that this emission becomes weaker and cooler at the increasing of , because more stars are distributed in the outer regions of the galaxy weakly heating the ISM. Passing now to the four right panels the above effects are reversed. is fixed and the obscuration of the stellar light by the diffuse ISM (panels and ) grows at the increasing of , because the ISM shifts toward the outer regions more and more wrapping the stellar component. In the same way the emission of the ISM becomes stronger at the increasing of , because dust is more evenly distributed in the regions occupied by stars.
In Fig. 10 we show the effect of the vertical scale lengths. As we did for the radial scales, we consider two cases: first we fix and let vary, second we fix and let change. In the four left panels is fixed. At increasing the extinction becomes lower, because more stars are distributed in the outer regions of the galaxy ( panel). This effect of growing attenuation is the same on young dusty SED (panel ) that in this model are distributed with the same vertical scale of bare stars. The ISM emission tends to be stronger for lower values of (panel ). In the four right panels of Fig. 10 the vertical scale of stars is kept fixed. In this case the effect of varying the other parameter is smaller: in particular in panel we can see as the emission of the diffuse ISM grows to a maximum and then decreases. The maximum is reached when the scale lengths of stars and dust are similar. If , or the emission tends to be lower.
In Fig. 11, we show the effect of varying the evaporation time of young dusty SSPs. The longer the time scale, the higher is the effective extinction of the UV-optical light because the energy of newly stars is obscured for a longer time (top-left panel), and the higher is the amount of energy shifted toward the FIR by MCs (bottom-left panel). As for the elliptical galaxy of Gyr, at increasing the emission of the diffuse ISM decreases and becomes cooler, because the intensity of the local radiation field is weaker.
Finally, we compare the SEDs of our disk galaxy at varying the amount of gas in the diffuse ISM with respect to that in dusty MCs, using the parameter . This is shown in Fig. 12. The effect of can be easily seen in the top panels ( and ). Increasing , i.e. the amount of gas in the diffuse ISM, strongly affects the SED. The higher the amount of gas, the stronger is the obscuration, and the higher is the flux in the FIR. As expected, increasing the amount of gas in the diffuse ISM makes stronger also the effect of attenuation on the light from young stars (bottom left panel). The emission of the diffuse ISM becomes also cooler with more gas in the diffuse ISM, because of the weaker radiation field heating the grains (bottom right panel).
5.2.3 Starburst galaxies
Starburst galaxies are objects that show a recent and transient increase in SFR by a large factor (ten at least). The burst is often confined to a few hundred parsecs near the nucleus, although bursts extending to wider regions are easy to find. The high SFR of starburst galaxies is of great interest, because it is the local analog of high redshift galaxies during their formation, involving strong star formation in dust rich environments.
The light emitted by newly born stars in these star forming galaxies is absorbed by dust and re-emitted in the FIR/MIR. One of the main problem is to disentangle whether the dominant energy source heating dust is a starburst or an AGN. In our models, AGNs as energy source is not yet included. Future work is planned to include the AGN contribution thus providing a more realistic description of these systems. In Table 1, column (5), we summarize the set of parameters we have adopted to model our prototype starburst galaxy.
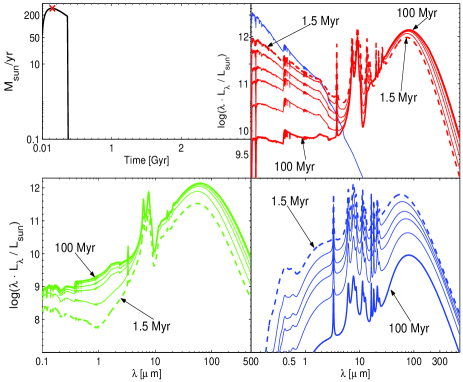
To simplify things we take a spherical model for which we adopt a long infall time scale and relatively low star formation efficiency, i.e. and . In this model star formation is maximum at about 3 Gyr, slowly declines up the the present time ( Gyr) and never ceases. It is a sort of late type galaxy but for the spherical symmetry. As already mentioned the specific shape is irrelevant for the purposes of this experiment. At the age of Gyr (not long ago) we introduce a short burst whose intensity is times stronger than the current SFR at the age of Gyr.
Star formation in starbursters is tightly related to reddening and obscuration which render the detailed interpretation of their continuum and emission-lines very complicate. Starbursters are known to possess a flat obscuration law (with no bump) as pointed out by Calzetti et al. (1994), who considered a mix of stars and dust and took the effects by scattering into account. This obscuration law is very puzzling, because starbursters are typically objects of high metallicity and so we would expect an extinction law similar to that of the MW. It is worth noticing, however, that the dust obscuration in galaxies is not strictly equivalent to dust extinction in stars. The latter measures the optical depth of the dust between the observer and the star, whereas the former corresponds to a more general attenuation, to which many effects may concur such as those by extinction, scattering, and geometrical distribution of the dust relative to the emitters (Calzetti, 2001). Because of this, there is nowadays much debate on the origin of the flat law. Is it due to geometrical effects (Granato et al., 2000), or peculiar distribution and the composition of the dust in star forming environments? Furthermore, there is some evidence that reddening by gas and stars are systematically different (Calzetti, 2001), as stars are on average less reddened than ionized gas. Another point is that both stars and ionized gas are contrasted by a foreground-like distribution of dust. This could be due to dust being preferentially associated to the star forming regions. In addition to this, the evidence of different amounts of gas mass along different lines of sight, could mirror a density and reddening structure. These considerations led Calzetti (2001) to propose a model aimed at explaining many observational constraints: newly born stars form in a central high density region immersed in a bath of older stars and dust.
In our models we can easily deal with this bath of old stars and dust: setting (in spherical models) and/or (in disks), the region of dust coincides with the region in which stars are present. We can also allow for different scales between old and newly born stars so that centrally confined burst can be superimposed to a ”normal” galaxy, setting or . However, as in all this paper, we will simply put or , leaving this point aside because it would require a deep investigation beyond the purposes of this study.
As for our starburster galaxy we have adopted the spherical symmetry, all scale lengths are the same as in model for early-type galaxies. In Fig. 13 we show the effect on the total SED of varying the galaxy radius . The effect is the same as already found for the model elliptical and disk galaxies: the smaller the galaxy, the higher is the optical depth and the stronger is the attenuation of the UV-optical light. The emission of dust in the FIR is stronger for compact objects because of the higher density (bottom-right panel of Fig. 13.
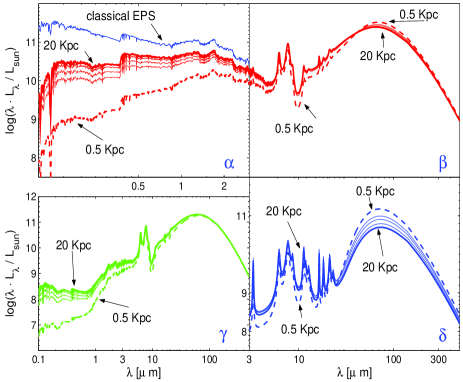
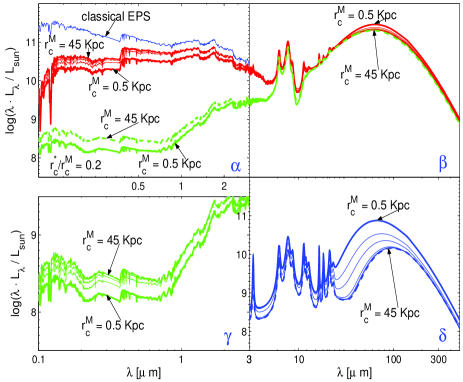
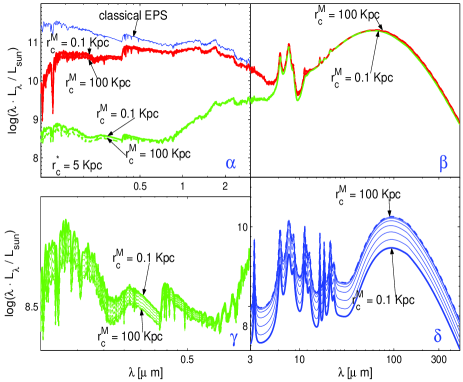
In Fig. 14 we show how the total SED changes at varying the scale radii. Their effects on the emission of diffuse ISM and young dusty MCs are also highlighted. Two cases are considered. First, the ratio is fixed and is let vary over a wide range of values (four left panels). Second, is fixed and is let change (four right panels). In both groups of four, panels and display the total SED, the old SED without dust, the contribution of MCs for the extreme values of the parameters, whereas panels and show the contribution of MCs and diffuse ISM to the total flux. In the four left panels of Fig. 14 we notice that the attenuation is stronger when and are the lowest, both for stars (panel ) and MCs (panel ). The emission of diffuse ISM grows for more compact systems, because the radiation field heating the grains is stronger in the central regions of high density (panel ). In the four right panels where is fixed, there is a small effect of varying , because the emission is clearly dominated from the MCs component. For higher values of , the system is more obscured (panel ), because there is more dust in the outer regions to screen the stellar light.
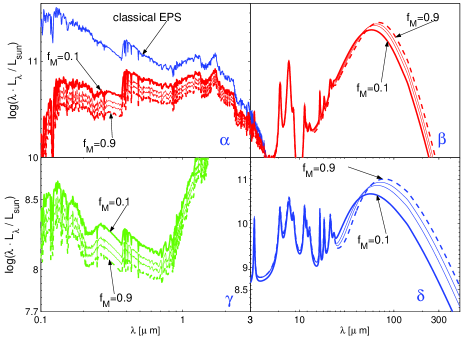
We compare the SEDs of our model starburster at varying the amount of gas in the diffuse ISM. The remaining part of the gas is distributed among the dusty MCs. In Fig. 15 we compare SEDs obtained with different amounts of gas in the diffuse ISM, varying the parameter . Increasing the amount of gas in the diffuse ISM makes stronger the extinction of the light from old and young stars, whereas it makes higher and cooler the FIR flux, because of the higher density and the weaker radiation field.
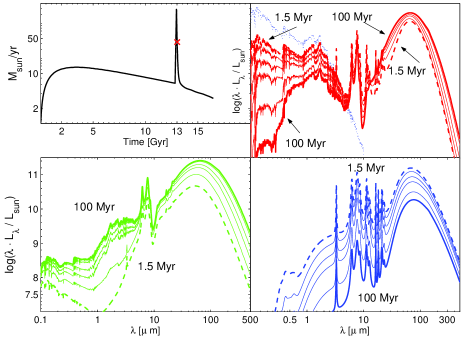
Finally, in Fig. 16, we show the effect of varying the evaporation time scale of young dusty SSPs. The effect is the same as in our model elliptical of Gyr (see Fig. 6) For longer time scales, the attenuation of the UV-optical light becomes stronger (top-right panel), and the amount of energy shifted toward the MIR/FIR by MCs becomes higher (bottom-left panel).
6 Late-type galaxies of the Local Universe
In this section, using our models we seek to reproduce the SEDs of two late-type galaxies of the Local Universe, namely M and NGC.
In Table 1, columns (6) and (7), we summarize the parameters characterizing the models that best match the properties of the two galaxies under consideration. Part of the parameters are based on observational hints, the others are suitably varied to get agreement between observational and theoretical SEDs. Specifically, the geometrical parameters and distances are from literature and kept constant. The gas mass in the ISM and MCs is let vary within the range indicated by current observational data. The star formation efficiency and infall time scale are also let vary around the typical values currently estimated for spiral galaxies. Finally the evaporation timescale and the set of dusty SSPs in our library are free parameters.
M. This Sbc spiral galaxy is one of the most important members of the Virgo Cluster, characterized by two huge and luminous spiral arms and many other smaller ones. The redshift of the galaxy, taken from NED111http://nedwww.ipac.caltech.edu/. (Nasa/Ipac Extragalactic Database) is . Using the Hubble constant km/s/Mpc, it corresponds to a distance of Mpc. Shapley et al. (2001), who performed a thorough search in literature of the distances for the spiral galaxies of their sample, report for NGC 4321 the distance of Mpc, based on Cepheid distance by Freedman et al. (1994) and km/s/Mpc. We adopt here for the distance the average of the two estimates, i.e. Mpc. The major and minor diameters of the galaxy in arcmin (NED) are . Taking the average dimension of , we obtain the linear radius Kpc. Following Gnedin et al. (1995), Knapen & Beckman (1996) and Beckman et al. (1996) we adopt the inclination angle and we assume that both stars and dust have the same radial and vertical scale lengths of and kpc, respectively.
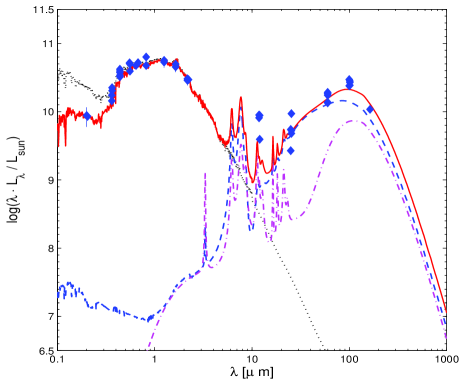
The star formation history of M is derived assuming the total baryonic mass of , and Gyr. With this choice, the star formation never stops: it starts small, grows to a maximum and then smoothly declines. We remain with the following parameters to adjust: the gas mass in the diffuse ISM and in MCs, the evaporation time and the library of young dusty SSPs. We may also slightly vary the radial and vertical scale lengths with respect to current estimates. For the gas masses we adopt the values given by Young et al. (1989) based on and , According to Young et al. (1989), , where is the total gas mass. It means that this galaxy is dominated by the molecular component. A good fit of the observational SED is obtained adopting the fractionary gas mass in MCs . For the evaporation time we find , consistent with a dust-poor star forming medium in which the first supernovae explosions in the newly born stellar populations evaporate the parental gas. The library of young SSPs best suited to M (and the other spiral as well) is characterized by the optical depth , , and high abundance. Nothing can be said for the ionization state of PAHs. We adopt the case with the complete treatment of the ionization state. Only the detailed spectrum in the MIR region may help clarifying the issue. It is worth noticing that for spirals, more extended and cooler MCs with fit the FIR emission better than MCs with . In Fig. 17 we show our best fit of the observational data. The result is remarkably good.
NGC is a Sc/Scd nearby galaxy, highly obscured by the interstellar matter of our galaxy, as it is quite close to the Galactic plane and it is seen nearly face-on. However, the inclination angle is uncertain due to the global asymmetry (Blais-Ouellette et al., 2004). We adopt (see also Bonnarel et al., 1988; Carignan et al., 1990; Oey & Kennicutt, 1990). The distance to NGC is uncertain and going from (de Vaucouleurs, 1979) to Mpc (Rogstad et al., 1973). Our distance to this galaxy has been taken from Shapley et al. (2001) who give Mpc as a mean value based on previous studies. From the NED online catalogue, the diameters of the galaxy in arcmin are . Adopting the average dimension of , we obtain the radius Kpc. According to Tacconi & Young (1986), the galaxy has some evidence of a spiral structure extending beyond kpc with HI emission out to kpc. However they adopted the distance of Mpc, that is two times longer than the recent value proposed by Shapley et al. (2001) that we have adopted here. Taking Mpc, the radius is Kpc consistent with the Shapley et al. (2001) results and the NED diameters. The radial scale lengths of stars and gas are also taken from Tacconi & Young (1986), however rescaled to our shorter value for the distance to the galaxy. We adopt the radial scale length of kpc, and for the scale height we use the same value of 1 kpc proposed by Silva et al. (1998). As far as the fraction of total gas embedded in young MCs is concerned, the question is controversial. Young et al. (1989) reports : this means that only of the gas is in molecular form, in good agreement with the results by Young & Knezek (1989) on the molecular to atomic gas ratio for the morphological types Sc/Scd. Tuffs et al. (1996) found that the bulk of the FIR luminosity arises from a diffuse disk component. However, Devereux & Young (1993) reports NGC as a galaxy where the molecular gas dominates the interstellar medium and the thermal emission is explained mainly with a warm dust component heated from young massive stars, a result confirmed in Malhotra et al. (1996). A recent work by Walsh et al. (2002) confirms the importance of the molecular component in NGC , almost as massive as the atomic one, giving the ratio , which is high with respect to other galaxies of the same morphological type. We find that the observational SED is best reproduced if the molecular component is about as massive as the atomic one. The star formation history of NGC , that exhibits a moderate starburst activity, has been calculated with a baryonic mass similar to M (, and ).
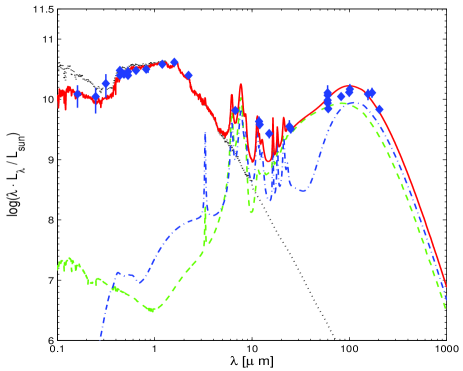
In Fig. 18, we show the result of our fit to the data for NGC . The evaporation time is very short, Myr, and the library of dusty SSPs is the same as for M. As compared to M, the agreement with the MIR is better, even if MIR spectra would allow a better comparison between theory and observations.
7 Early-type galaxies of the local universe
In this section we present two old early-type galaxies of the Local Universe, namely NGC 2768 and NGC 4491, and our attempts to reproduce their SEDs. In Table 1, columns (8) and (9), we summarize the values of the parameters we have chosen. The number of parameters is smaller than for disk galaxies. First because of the higher degree of symmetry, and second because parameters like and have no role. The star formation ceased long ago after the onset of the galactic wind, no young stars in dusty MCs are present and all gas (if any) is in the diffuse ISM . There is however, a new parameter to consider, i.e. the fraction of the gas continuously ejected by dying and evolved stars (mostly RHB) that is still retained in the galaxy (see Sect. 5.2.1 for details).
NGC is an elliptical galaxy of morphological type E at the distance of Mpc (Takagi et al., 2003). As noticed by Takagi et al. (2003), this galaxy has been detected in the sub-mm range of wavelengths thus providing a better constraint on the dust emission. Data for this galaxy have been taken from the literature as listed in Fig. 19. As in Takagi et al. (2003), all the data have been corrected where it was necessary to be consistent with the galaxy observed as a whole, even if there is a certain amount of error for the IUE data of Longo et al. (1991) that correspond to a small aperture in the center of the galaxy. The diameters of the galaxy in arcmin (NED) are and using an average dimension of , we obtain a radius of the galaxy of about Kpc.
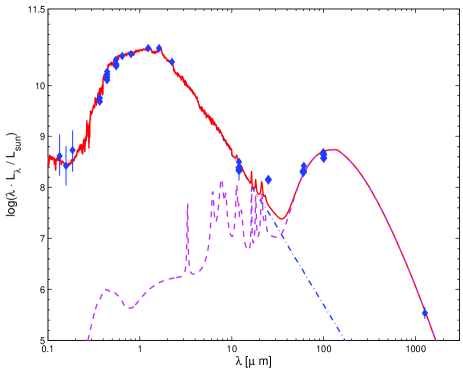
The parameters chosen to model the SFH are as follows: the infall time scale is =0.1 Gyr, the exponent for the star formation law is =1 as in Tantalo et al. (1996, 1998), whereas the efficiency is =2. In Fig. 20 we show the SFH with other quantities derived by the chemical code. The onset of the galactic wind takes place at about Gyr. The scale lengths of stars and gas have been fixed as for the prototype elliptical of Sect. 5.2.1.
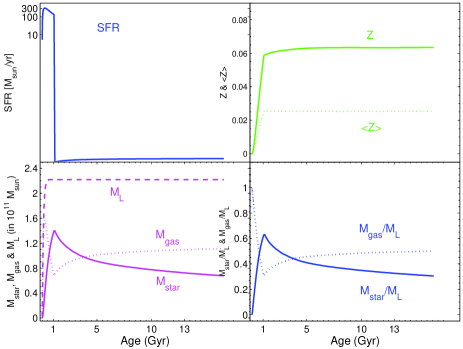
Finally, in Fig. 19, we show the theoretical SED and its comparison with the observational data. Agreement is excellent from the UV to FIR. Note the strong reduction factor for the gas content.
NGC is a roughly spherical elliptical galaxy of the morphological type E. For this galaxy the NED catalog reports the redshift corresponding to a distance of about kpc, using km/s/Mpc. Temi et al. (2004) report from the LEDA catalog a distance of about Mpc. We choose the average distance between the two determinations, i.e. Mpc. The diameters of the galaxy in arcmin (NED) are and using an average dimension of , we obtain a dimension of about Kpc.
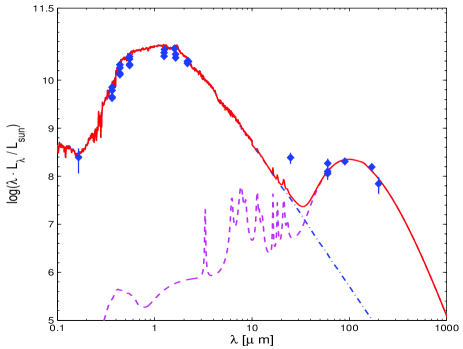
The SFH and the evolution in metallicity of NGC are calculated in the same way as for NGC, only with a slightly different value of the baryonic mass. The scale lengths are the same as for the other elliptical. In Fig. 21 we show the result of our fit. The agreement is good. The main reason of uncertainty is the correction we made for the IUE UV-data of Rifatto et al. (1995). As pointed in Takagi et al. (2003), only knowing the true UV profile it is possible to properly correct these IUE data that cover only a small region in the central region of the galaxy. Finally, the same remark on the gas content made for the other elliptical can be made also here.
8 Starburst galaxies
Finally, we present models for two well known and thoroughly studied star-burst galaxies of the local universe, namely Arp220 and M82. In Table 1, columns (10) and (11), we summarize the values of the parameters we chose to reproduce the SEDs of these galaxies. We adopt the spherical geometry to describe both objects. As for ellipticals, the number of parameters to deal with is much lower than for disk galaxies. The situation, however, is different from the case of ellipticals because now the parameters and particular play in the fit of the observational data.
Arp. Arp is the brightest object in the Local Universe. There is nowadays the general consensus that Arp is a starburst-dominated galaxy and not an AGN-dominated object (Lutz et al., 1996; Genzel et al., 1998; Lutz et al., 1999; Rigopoulou et al., 1999; Tran et al., 2001). Recently, Spoon et al. (2004) re-analyzing the ISO MIR spectrum of Arp confirm the starburst-dominated hypothesis, suggesting that the IR luminosity should be be probably powered by the starburst activity in extremely dense regions, even if the AGN contribution cannot be definitely ruled out because of the high extinction.
The redshift of the galaxy, taken from the NED database is . Using the Hubble constant km/s/Mpc, it corresponds to a distance of about Mpc. This value is fully consistent with the distances proposed in Soifer et al. (1987) and in Spoon et al. (2004). The diameters of the galaxy in arcmin (NED) are . Adopting the mean value of , the radius of the galaxy is of about Kpc. Wynn-Williams & Becklin (1993) showed that almost all the MIR flux of Arp220 comes from a small central region of about aperture and this concentration of the MIR emission has been confirmed by Soifer et al. (1999) comparing the fluxes at a fixed MIR wavelength and varying the beam. For this reason we can quite safely use the MIR data from small apertures even modelling the whole galaxy.
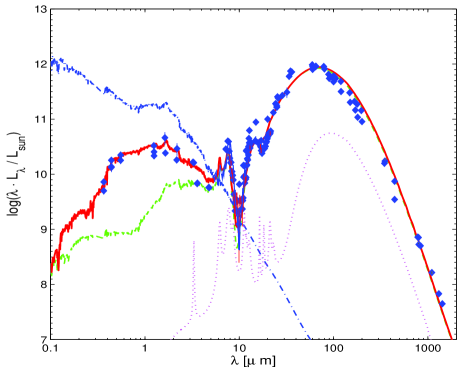
The mass of molecular gas in Arp according to CO estimates is about (Solomon et al., 1997; Scoville et al., 1997). Mundell et al. (2001) estimated the nuclear column densities of to be of the order of . These values are comparable to the mean column densities that are of the order of , with the spin temperature between and K. These column densities are likely lower limits because of the uncertainty in the values of (Kulkarni & Heiles, 1988), in the abundance of (Frerking et al., 1982), in the excitation conditions and optical depth, which all suggest us to adopt similar contents for both atomic and molecular gas. We fix . The SFH history of Arp is modelled adding to the current SFH (which peaked in past and ever since decreased) a very strong and short burst. The burst is obtained by increasing the star formation of a factor of . In Fig. 22 we show our best fit of Arp, the agreement is good. However, there are two points that need to be clarified. First, we have no data of Arp in the near and far UV. As outlined by Takagi et al. (2003), the data by Goldader et al. (2002) are puzzling because, owing to the large angular size of Arp 220 filling the field of view of the instrument, the flux level of the sky (to be subtracted) is highly uncertain. Second, to get satisfactory agreement with observational data we had to extend the parameter space, namely the scale radius has been lowered to and the , this one in agreement with Sturm et al. (1996) and Genzel et al. (1998). The ionization of PAHs is fully considered, but it is worth noticing that the ionization model does not bear very much on the extinction curve we have adopted thanks to the low carbon abundance and low contribution of PAHs.
There is another interesting point to note. Arp is modelled as a Gyr old galaxy with a strong burst superimposed to a spiral-like SFH that reached a maximum in the past and gently declines. This long history of star formation slowly increases the metallicity well above the solar value. For these high metallicities values, one should (has to) use a MW-like extinction curve for dense regions to calculate the SED of young SSPs emerging from dusty regions. This type of extinction curve is characterized by a high abundance of carbon. We tried to fit the observational SED of Arp using the lowest available value of , but the MIR emission was always too high and the absorption features of silicates not as deep as required. To obtain a good fit we had to use for young dusty SSPs the extinction curve of the SMC, which is poor of carbon. Similar result was found by Takagi et al. (2003). There seems to be a point of contradiction, because the carbon-poor extinction curve of the SMC is characteristic of a low metallicity environment, whereas here we are dealing with a high metallicity one. Although this point deserves careful future investigation, a plausible explanation could be that the high rate of type II supernovae due to the strong burst alters the composition of dust, growing the amount of silicates with respect to that of carbonaceous grains. Another hypothesis is that this high energy output of the star forming process destroys molecules and small grains thus altering the distribution of the grains. Finally the geometry of the system could play a role.
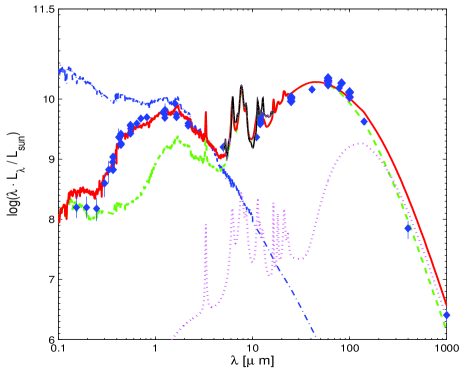
M. The central region of the irregular starburst galaxy M seems to have suffered a strong gravitational interaction about years ago (Förster Schreiber et al., 2003) with its companion M and it shows a remarkable burst of star formation activity. M is still strongly interacting with as proved by the common envelope of neutral hydrogen (Yun et al., 1993; Ichikawa et al., 1995). The classical distance to M is Mpc (Tammann & Sandage, 1968) that makes of M the nearest and most studied starburst galaxy (see Shopbell & Bland-Hawthorn, 1998, and references therein). For M data for the emission of PAHs in the MIR region are available. The ISO-SWS data by Sturm et al. (2000, private communication) cover a wide region going from to with different parts of a SWS full grating scan that are observed with different aperture sizes, going from to . The problem is that with these small apertures it is not possible to observe the whole galaxy, but only part of it. In our case the south-western star formation lobe. Recently, Förster Schreiber et al. (2003, private communication) observed M in the MIR range between and with ISOCAM on board of ISO. The total field of view is . It covers almost entirely the MIR sources of M and it is more suitable to be used to model M as a whole. The mass of molecular gas for M is of the order of , as derived from CO determinations (Lo et al., 1987; Wild et al., 1992; Förster Schreiber et al., 2001). The estimates of the total mass of gas are of the order of (Solinger et al., 1977). For this reason we use a parameter , with almost all the gas in the diffuse ISM. In Fig. 23 we show the best fit obtained for M. The agreement with the data is good and the main features of PAHs are well reproduced. The young dusty SSPs used for this fit are characterized by the following parameters: , , and MW average ionization of PAHs. An interesting point is that we found it difficult to reach the low level of flux in the UV region. Even if data are highly uncertain, this could be due to the model of MCs with uniform distribution of dust, (see Piovan et al., 2006), we have adopted. It might be possible that for M, MCs with a shell-like distribution of dust with more dust in the outer regions and therefore with stronger attenuation of the flux from young stars, are better suited to obtain a good fit in that spectral region.
9 Discussion and conclusions
In this paper, improving upon the standard EPS technique, we have developed theoretical SEDs of galaxies, whose morphology goes from disk to spherical structures, in presence of dust in the ISM. Properly accounting for the effects of dust on the SED of a galaxy increases the complexity of the problem with respect to the standard EPS theory because it is necessary to consider the distribution of the energy sources (the stars) inside the ISM absorbing and re-emitting the stellar flux. This means that the geometry and morphological type of the galaxy become important and unavoidable ingredients of the whole problem, together with the transfer of radiation from one region to another. The emergent SEDs of our model galaxies have been shown to reproduce very well, even in details, the observational data for a few test galaxies of different morphological type. The model is versatile and applicable to a large range of objects of astrophysical interest at varying the star formation and chemical enrichment histories, the geometrical shape or morphology of the galaxies and the amounts of gas and dust contained in their ISM.
Before concluding, it is worth mentioning a few points of weakness that could be improved . First, the chemical models we have adopted are from Tantalo et al. (1996, 1998), whereas the chemical yields are from Portinari et al. (1998). These models are state-of-the-art in the study of the chemical evolution of galaxies. However, they do not include a proper description of the formation/destruction of dust as for instance recently developed by Dwek (1998, 2005). Even if the dust content can be related to the metallicity of the galaxy (see Sect. 5.1), the relative proportions of the various components of the dust would require the detailed study of the evolution of the dusty environment and the complete information on the dust yields (Dwek, 1998, 2005; Galliano et al., 2005). This would lead to a better and more physically sounded correlation between the composition of dust and the star formation and chemical enrichment history of the galaxy itself. All this is missing in most galaxy models in which dust is considered. The problem may be particularly severe for high metallicity environments.
Second, the models for disk galaxies with central bulge need to be tested against SEDs of local galaxies of intermediate type going from to , trying to match some observational constraints, like the UV-optical average colours (Buzzoni, 2002, 2005).
Finally, many other physical ingredients can be improved and/or considered. Just to mention a few, the inclusion of the recent models of thermally pulsing AGB stars with varying molecular opacities in the outer layers Marigo (2002), the extension of the SED to the radio range, and the simulation of the nebular emission.
Acknowledgements
We would like to deeply thank A. Weiss for the many stimulating discussions and for showing much interest in our work. L.P. is pleased to acknowledge the hospitality and stimulating environment provided by Max-Planck-Institut für Astrophysik in Garching where part of the work described in this paper has been made during his visit as EARA fellow on leave from the Department of Astronomy of the Padua University. This study has been financed by the Italian Ministry of Education, University, and Research (MIUR), and the University of Padua.
Appendix A Matter in the cylinder between and
To calculate the number of H atoms contained in the cylinder of matter between two generic volumes and one has to know the total gas mass in the cylinder
| (26) |
where is the density profile of the diffuse medium, given by the eqns. (7) or (9) or both, according to whether we are dealing with a disk galaxy, a spherical galaxy or a disk plus bulge one.
Normalizing the density to the central value, i.e. , and the radial distance to the radial scale length for disks or core radius for spheroidal galaxies as appropriate, i.e. or , we may express the density profiles by means of dimensionless quantities. For a disk galaxy we have which depends only on the ratio and , whereas for a spheroidal galaxy we have .
In this way it is possible to calculate once for all the mass contained in the cylinders between any two generic volume elements of the galaxy, independently from the mass of the galaxy, given the coordinate grid and ratio (for disk galaxies only) or exponent (for spheroidal galaxies). The integral of eqn. 26 is then numerically evaluated.
Appendix B The distance
Following Silva (1999) the distance shortly indicated as , which is defined as volume averaged value of the square of the distance between and all the points belonging to , is where is given by and the volume by .
Appendix C Matter in the cylinder between and the galactic edge
The matter contained in the cylinder between a generic element and the edge of the galaxy extinguishes the radiation emerging from the volume element, travelling across the galaxy up to its edge, from which it escapes toward an external observer. To determine this mass we proceed as follows. Firstly, since the emission of eqn. (24) has been defined per unit volume and the problem has azimuthal symmetry, we resize the grid of azimuthal coordinates by taking many equally spaced bins. Using this resized grid, we introduce the Cartesian coordinates of the center of the volume element by means of the transformations , and , where are the polar coordinates of centre of the volume . The starting reference system is in spherical coordinates and corresponds to a Cartesian system . Let us now consider another reference system to which another Cartesian system would correspond. The transformations from one Cartesian system to the other is given by and , where are the coordinates of the centre of the new system in the old one. We take the new reference system with the origin in , where . This represents a translation of the origin along the Y-axis to a new origin so that the centre of the volume lies in the plane . The Cartesian coordinates of the volume centre in the new system will be , and . Applying the inverse relationships to pass from Cartesian to spherical coordinates, the and of the volume centre are and .
Obviously the new coordinate is equal to or , because the volume belong to the plane . For , whereas for . To avoid useless complications, the grid of azimuthal coordinates has been redefined in such a way that is always different from zero. We proceed now to determine the radius of the circular section of the galaxy coincident with the plane . This will depend on the type of galaxy under consideration. We get .
where is the galactic radius and is equal to for disks and to for spherical galaxies. Let us now consider an observer looking at the galaxy from the view angle with respect to the equatorial plane of the galaxy. For the sake of simplicity we place the observer on the plane . Therefore, corresponds to a galaxy seen edge-on, whereas to the case face-on. Thanks to the azimuthal and equatorial symmetries we make take and .
Associated to the volume center with coordinates there will be a point located on the galaxy edge with coordinates where and are still unknown. Let us first calculate . If all the points at the galactic edge have . If two cases are possible: for , whereas for . In the general case with we have to calculate the equation of the straight line with angular coefficient passing through the point . We obtain . We calculate now where are the coordinates of the volume center. If we have , whereas if we get .
The derivation of is slightly more complicate because five cases are possible. In any case, it is a matter of lengthy trigonometrical manipulations. The line for the center of the plane with inclination has equation . This leads us to define the parameter to check whether the volume in the plane falls above or below the line . If whereas if . Finally, let us introduce the ratio . The following cases are then possible. If and then . If and then . If and then . If and then . If and we have three solutions: , and , depending on whether is greater, smaller or equal to , respectively.
Once determined the spherical coordinates of in the translated system, by means of an inverse transformation of coordinates we can obtain the Cartesian coordinates in the old system of coordinates: , and . Having eventually derived the Cartesian coordinates of the point on the galactic edge and those of volume center , the calculation of the mass in the cylinder comprised between and the galaxy edge is trivial and can be straightforwardly performed as described in Appendix A.
References
- Arimoto & Tarrab (1990) Arimoto N., Tarrab I., 1990, A&A, 228, 6
- Arimoto & Yoshii (1987) Arimoto N., Yoshii Y., 1987, A&A, 173, 23
- Barger et al. (2000) Barger A. J., Cowie L. L., Richards E. A., 2000, AJ, 119, 2092
- Barger et al. (1999) Barger A. J., Cowie L. L., Sanders D. B., 1999, ApJL, 518, L5
- Beckman et al. (1996) Beckman J. E., Peletier R. F., Knapen J. H., Corradi R. L. M., Gentet L. J., 1996, ApJ, 467, 175
- Bell & Kennicutt (2001) Bell E. F., Kennicutt R. C., 2001, in Astronomical Society of the Pacific Conference Series Comparing Ultraviolet and H Star Formation Rates. pp 305–306
- Bertelli et al. (1994) Bertelli G., Bressan A., Chiosi C., Fagotto F., Nasi E., 1994, A&AS, 106, 275
- Bianchi et al. (1996) Bianchi S., Ferrara A., Giovanardi C., 1996, ApJ, 465, 127
- Blais-Ouellette et al. (2004) Blais-Ouellette S., Amram P., Carignan C., Swaters R., 2004, A&A, 420, 147
- Bonnarel et al. (1988) Bonnarel F., Boulesteix J., Georgelin Y. P., Lecoarer E., Marcelin M., Bacon R., Monnet G., 1988, A&A, 189, 59
- Bressan et al. (1994) Bressan A., Chiosi C., Fagotto F., 1994, ApJS, 94, 63
- Bressan et al. (1998) Bressan A., Granato G. L., Silva L., 1998, A&A, 332, 135
- Bressan et al. (2002) Bressan A., Silva L., Granato G. L., 2002, A&A, 392, 377
- Bruzual & Charlot (1993) Bruzual G., Charlot S., 1993, ApJ, 405, 538
- Bruzual & Charlot (2003) Bruzual G., Charlot S., 2003, MNRAS, 344, 1000
- Buat et al. (1989) Buat V., Deharveng J. M., Donas J., 1989, A&A, 223, 42
- Buzzoni (2002) Buzzoni A., 2002, AJ, 123, 1188
- Buzzoni (2005) Buzzoni A., 2005, MNRAS, 361, 725
- Calzetti (2001) Calzetti D., 2001, PASP, 113, 1449
- Calzetti et al. (1994) Calzetti D., Kinney A. L., Storchi-Bergmann T., 1994, ApJ, 429, 582
- Carignan et al. (1990) Carignan C., Charbonneau P., Boulanger F., Viallefond F., 1990, A&A, 234, 43
- Chiosi (1980) Chiosi C., 1980, A&A, 83, 206
- Chiosi (2000) Chiosi C., 2000, A&A, 364, 423
- Cimatti et al. (1997) Cimatti A., Bianchi S., Ferrara A., Giovanardi C., 1997, MNRAS, 290, L43
- de Jong & van der Kruit (1994) de Jong R. S., van der Kruit P. C., 1994, A&AS, 106, 451
- de Vaucouleurs (1979) de Vaucouleurs G., 1979, ApJ, 227, 729
- de Vaucouleurs et al. (1992) de Vaucouleurs G., de Vaucouleurs A., Corwin H. G., Buta R. J., Paturel G., Fouque P., 1992, VizieR Online Data Catalog, 7137
- Devereux & Young (1993) Devereux N. A., Young J. S., 1993, AJ, 106, 948
- Devriendt & Guiderdoni (2000) Devriendt J. E. G., Guiderdoni B., 2000, A&A, 363, 851
- Devriendt et al. (1999) Devriendt J. E. G., Guiderdoni B., Sadat R., 1999, A&A, 350, 381
- Dole et al. (1999) Dole H., Lagache G., Puget J. L., Gispert R., Aussel H., Bouchet F. R., Ciliegi C., Clements D. L., Cesarsky C. J., Desert F. X., Elbaz D., 1999, in ESA SP-427: The Universe as Seen by ISO FIRBACK survey with ISO: data reduction, analysis and first results. p. 1031
- Donas et al. (1987) Donas J., Deharveng J. M., Laget M., Milliard B., Huguenin D., 1987, A&A, 180, 12
- Dopita (2005) Dopita M. A., 2005, in AIP Conf. Proc. 761: The Spectral Energy Distributions of Gas-Rich Galaxies: Confronting Models with Data Modelling the UV to sub-mm SED of Starburst Galaxies. p. 203
- Dopita et al. (2005) Dopita M. A., Groves B. A., Fischera J., Sutherland R. S., Tuffs R. J., Popescu C. C., Kewley L. J., Reuland M., Leitherer C., 2005, ApJ, 619, 755
- Draine & Lee (1984) Draine B. T., Lee H. M., 1984, ApJ, 285, 89
- Draine & Li (2001) Draine B. T., Li A., 2001, ApJ, 551, 807
- Dunne et al. (2000) Dunne L., Eales S., Edmunds M., Ivison R., Alexander P., Clements D. L., 2000, MNRAS, 315, 115
- Dunne & Eales (2001) Dunne L., Eales S. A., 2001, MNRAS, 327, 697
- Dwek (1998) Dwek E., 1998, ApJ, 501, 643
- Dwek (2005) Dwek E., 2005, in Popescu C. C., Tuffs R. J., eds, AIP Conf. Proc. 761: The Spectral Energy Distributions of Gas-Rich Galaxies: Confronting Models with Data Interstellar dust: what is it, how does it evolve, and what are its observational consequences?. p. 103
- Eales et al. (1989) Eales S. A., Wynn-Williams C. G., Duncan W. D., 1989, ApJ, 339, 859
- Efstathiou & Rowan-Robinson (1995) Efstathiou A., Rowan-Robinson M., 1995, MNRAS, 273, 649
- Elbaz et al. (1998) Elbaz D., Aussel H., Baker A. C., 1998, in ESA SP-429: The Next Generation Space Telescope: Science Drivers and Technological Challenges ISOCAM Deep Surveys Unveiling Star Formation in the Mid-Infrared. p. 47
- Elbaz et al. (1999) Elbaz D., Aussel H., Cesarsky C. J., Desert F. X., Fadda D., Franceschini A., Harwit M., Puget J. L., Starck J. L., 1999, in ESA SP-427: The Universe as Seen by ISO Vol. 427, ISOCAM extragalactic mid-infrared deep surveys. p. 999
- Engargiola (1991) Engargiola G., 1991, ApJS, 76, 875
- Epchtein et al. (1997) Epchtein N., de Batz B., Capoani L., Chevallier L., Copet E., Fouque P., Lacombe F., Le Bertre T., Pau S., Rouan D., Ruphy S., Simon G., Tiphene D., Burton W. B., Bertin E., Deul E., Habing H., Borsenberger J., 1997, The Messenger, 87, 27
- Förster Schreiber et al. (2001) Förster Schreiber N. M., Genzel R., Lutz D., Kunze D., Sternberg A., 2001, ApJ, 552, 544
- Förster Schreiber et al. (2003) Förster Schreiber N. M., Genzel R., Lutz D., Sternberg A., 2003, ApJ, 599, 193
- Fagotto et al. (1994a) Fagotto F., Bressan A., Bertelli G., Chiosi C., 1994a, A&AS, 100, 647
- Fagotto et al. (1994b) Fagotto F., Bressan A., Bertelli G., Chiosi C., 1994b, A&AS, 104, 365
- Fagotto et al. (1994c) Fagotto F., Bressan A., Bertelli G., Chiosi C., 1994c, A&AS, 105, 39
- Ferrara et al. (1999) Ferrara A., Bianchi S., Cimatti A., Giovanardi C., 1999, ApJS, 123, 437
- Fioc & Rocca-Volmerange (1997) Fioc M., Rocca-Volmerange B., 1997, A&A, 326, 950
- Fixsen et al. (1998) Fixsen D. J., Dwek E., Mather J. C., Bennett C. L., Shafer R. A., 1998, ApJ, 508, 123
- Freedman et al. (1994) Freedman W. L., Hughes S. M., Madore B. F., Mould J. R., Lee M. G., Stetson P., Kennicutt R. C., Turner A., Ferrarese L., Ford H., Graham J. A., Hill R., Hoessel J. G., Huchra J., Illingworth G. D., 1994, ApJ, 427, 628
- Frerking et al. (1982) Frerking M. A., Langer W. D., Wilson R. W., 1982, ApJ, 262, 590
- Froehlich (1982) Froehlich H.-E., 1982, Astronomische Nachrichten, 303, 97
- Frogel et al. (1978) Frogel J. A., Persson S. E., Aaronson M., Metthews K., 1978, ApJ, 220, 75
- Galliano et al. (2005) Galliano F., Dwek E., Chanial P., 2005, American Astronomical Society Meeting Abstracts, 207
- Gavazzi & Boselli (1996) Gavazzi G., Boselli A., 1996, Astrophysical Letters Communications, 35, 1
- Genzel et al. (1998) Genzel R., Lutz D., Sturm E., Egami E., Kunze D., Moorwood A. F. M., Rigopoulou D., Spoon H. W. W., Sternberg A., 1998, ApJ, 498, 579
- Gibson & Matteucci (1997) Gibson B. K., Matteucci F., 1997, ApJ, 475, 47
- Girardi et al. (2002) Girardi L., Bertelli G., Bressan A., Chiosi C., Groenewegen M. A. T., Marigo P., Salasnich B., Weiss A., 2002, A&A, 391, 195
- Girardi et al. (2000) Girardi L., Bressan A., Bertelli G., Chiosi C., 2000, A&AS, 141, 371
- Gnedin et al. (1995) Gnedin O. Y., Goodman J., Frei Z., 1995, AJ, 110, 1105
- Goldader et al. (2002) Goldader J. D., Meurer G., Heckman T. M., Seibert M., Sanders D. B., Calzetti D., Steidel C. C., 2002, ApJ, 568, 651
- Golombek et al. (1988) Golombek D., Miley G. K., Neugebauer G., 1988, AJ, 95, 26
- Gordon et al. (1997) Gordon K. D., Calzetti D., Witt A. N., 1997, ApJ, 487, 625
- Gordon et al. (2001) Gordon K. D., Misselt K. A., Witt A. N., Clayton G. C., 2001, ApJ, 551, 269
- Granato et al. (2000) Granato G. L., Lacey C. G., Silva L., Bressan A., Baugh C. M., Cole S., Frenk C. S., 2000, ApJ, 542, 710
- Greggio & Renzini (1983) Greggio L., Renzini A., 1983, A&A, 118, 217
- Guhathakurta et al. (1986) Guhathakurta P., Knapp G. R., Kim D. W., Jura M., 1986, Bull. Am. Astron. Soc., 18, 926
- Guiderdoni et al. (1997) Guiderdoni B., Bouchet F. R., Puget J., Lagache G., Hivon E., 1997, Nat, 390, 257
- Guiderdoni et al. (1998) Guiderdoni B., Hivon E., Bouchet F. R., Maffei B., 1998, MNRAS, 295, 877
- Guiderdoni & Rocca-Volmerange (1987) Guiderdoni B., Rocca-Volmerange B., 1987, A&A, 186, 1
- Hauser (1998) Hauser M. G., 1998, Bulletin of the American Astronomical Society, 30, 1337
- Huchra (1977) Huchra J. P., 1977, ApJ, 217, 928
- Hughes et al. (1998) Hughes D. H., Serjeant S., Dunlop J., Rowan-Robinson M., Blain A., Mann R. G., Ivison R., Peacock J., Efstathiou A., Gear W., Oliver S., Lawrence A., Longair M., Goldschmidt P., Jenness T., 1998, Nat, 394, 241
- Ichikawa et al. (1995) Ichikawa T., Yanagisawa K., Itoh N., Tarusawa K., van Driel W., Ueno M., 1995, AJ, 109, 2038
- Jarrett et al. (2003) Jarrett T. H., Chester T., Cutri R., Schneider S. E., Huchra J. P., 2003, AJ, 125, 525
- Johnson (1966) Johnson H. L., 1966, ApJ, 143, 187
- Kennicutt et al. (2003) Kennicutt R. C., Armus L., Bendo G., Calzetti D., Dale D. A., Draine B. T., Engelbracht C. W., Gordon K. D., Grauer A. D., Helou G., 2003, PASP, 115, 928
- Klaas et al. (1997) Klaas U., Haas M., Heinrichsen I., Schulz B., 1997, A&A, 325, L21
- Klein et al. (1988) Klein U., Wielebinski R., Morsi H. W., 1988, A&A, 190, 41
- Knapen & Beckman (1996) Knapen J. H., Beckman J. E., 1996, MNRAS, 283, 251
- Kodama & Arimoto (1997) Kodama T., Arimoto N., 1997, A&A, 320, 41
- Kodama et al. (1998) Kodama T., Arimoto N., Barger A. J., Arag’on-Salamanca A., 1998, A&A, 334, 99
- Kormendy (1977) Kormendy J., 1977, ApJ, 218, 333
- Kulkarni & Heiles (1988) Kulkarni S. R., Heiles C., 1988, Neutral hydrogen and the diffuse interstellar medium. Galactic and Extragalactic Radio Astronomy, pp 95–153
- Laor & Draine (1993) Laor A., Draine B. T., 1993, ApJ, 402, 441
- Larson (1974) Larson R. B., 1974, MNRAS, 169, 229
- Larson (1991) Larson R. B., 1991, in Lambert D. L., ed., Frontiers of Stellar Evolution Vol. 20. ASP Conf. Ser., p. 571
- Leitherer et al. (1996) Leitherer C., Alloin D., von Alvensleben U. F., Gallager J. S., Huchra J. P., et al. 1996, PASP, 108, 996
- Leitherer & Heckman (1995) Leitherer C., Heckman T. M., 1995, ApJS, 96, 9
- Leitherer et al. (1999) Leitherer C., Schaerer D., Goldader J. D., Delgado R. M. G., Robert C., Kune D. F., de Mello D. F., Devost D., Heckman T. M., 1999, ApJS, 123, 3
- Lejeune et al. (1998) Lejeune T., Cuisinier F., Buser R., 1998, A&AS, 130, 65
- Li & Draine (2001) Li A., Draine B. T., 2001, ApJ, 554, 778
- Lilly et al. (1999) Lilly S. J., Eales S. A., Gear W. K. P., Hammer F., Le Fèvre O., Crampton D., Bond J. R., Dunne L., 1999, ApJ, 518, 641
- Lo et al. (1987) Lo K. Y., Cheung K. W., Masson C. R., Phillips T. G., Scott S. L., Woody D. P., 1987, ApJ, 312, 574
- Longo et al. (1991) Longo G., Ceriello A., Capaccioli M., 1991, A&AS, 90, 375
- Lonsdale et al. (2003) Lonsdale C. J., Smith H. E., Rowan-Robinson M., Surace J., Shupe D., Xu C., Oliver S., Padgett D., Fang F., Conrow T., Franceschini A., Gautier N., 2003, PASP, 115, 897
- Lutz et al. (1996) Lutz D., Genzel R., Sternberg A., Netzer H., Kunze D., Rigopoulou D., Sturm E., Egami E., Feuchtgruber H., Moorwood A. F. M., de Graauw T., 1996, A&A, 315, L137
- Lutz et al. (1999) Lutz D., Genzel R., Sturm E., Tran D., Rigopoulou D., Spoon H. W. W., Moorwood A. F. M., 1999, Advances in Space Research, 23, 1061
- Madau et al. (1996) Madau P., Ferguson H. C., Dickinson M. E., Giavalisco M., Steidel C. C., Fruchter A., 1996, MNRAS, 283, 1388
- Malhotra et al. (1996) Malhotra S., Helou G., van Buren D., Kong M., Beichman C. A., Dinerstein H., Hollenbach D. J., Hunter D. A., Lo K. Y., 1996, A&A, 315, L161
- Marigo (2002) Marigo P., 2002, A&A, 387, 507
- Martin et al. (1997) Martin C., Friedman P., Schiminovich D., Madore B., Bianchi L., Szalay A., Heckman T., Milliard B., Malina R., Siegmund O., Welsh B., Rich M., 1997, American Astronomical Society Meeting, 29, 1309
- Matteucci & Greggio (1986) Matteucci F., Greggio L., 1986, A&A, 154, 279
- McMahon et al. (1994) McMahon R. G., Omont A., Bergeron J., Kreysa E., Haslam C. G. T., 1994, MNRAS, 267, L9
- Misselt et al. (2001) Misselt K. A., Gordon K. D., Clayton G. C., Wolff M. J., 2001, ApJ, 551, 277
- Moshir & et al. (1990) Moshir M., et al. 1990, in IRAS Faint Source Catalogue, version 2.0 (1990) IRAS Faint Source Catalogue, version 2.0.. p. 0
- Mouhcine & Lançon (2002) Mouhcine M., Lançon A., 2002, A&A, 393, 149
- Mundell et al. (2001) Mundell C. G., Ferruit P., Pedlar A., 2001, ApJ, 560, 168
- Oey & Kennicutt (1990) Oey M. S., Kennicutt R. C., 1990, in NASA, Ames Research Center, The Interstellar Medium in External Galaxies: Summaries of Contributed Papers p 309-311 (SEE N91-14100 05-90) Gravitational star formation thresholds and gas density in three galaxies. pp 309–311
- Omont et al. (1996) Omont A., Petitjean P., Guilloteau S., McMahon R. G., Solomon P. M., Pecontal E., 1996, Nat, 382, 428
- Panuzzo et al. (2003) Panuzzo P., Bressan A., Granato G. L., Silva L., Danese L., 2003, A&A, 409, 99
- Pearson et al. (2004) Pearson C. P., Shibai H., Matsumoto T., Murakami H., Nakagawa T., Kawada M., Onaka T., Matsuhara H., Kii T., Yamamura I., Takagi T., 2004, MNRAS, 347, 1113
- Piovan et al. (2003) Piovan L., Tantalo R., Chiosi C., 2003, A&A, 408, 559
- Piovan et al. (2006) Piovan L., Tantalo R., Chiosi C., 2006, MNRAS
- Portinari et al. (1998) Portinari L., Chiosi C., Bressan A., 1998, A&A, 334, 505
- Pozzetti et al. (1998) Pozzetti L., Madau P., Zamorani G., Ferguson H. C., Bruzual A. G., 1998, MNRAS, 298, 1133
- Puget et al. (1996) Puget J.-L., Abergel A., Bernard J.-P., Boulanger F., Burton W. B., Desert F.-X., Hartmann D., 1996, A&A, 308, L5
- Puget et al. (1999) Puget J. L., Lagache G., Clements D. L., Reach W. T., Aussel H., Bouchet F. R., Cesarsky C., Désert F. X., Dole H., Elbaz D., Franceschini A., Guiderdoni B., Moorwood A. F. M., 1999, A&A, 345, 29
- Rice et al. (1988) Rice W., Lonsdale C. J., Soifer B. T., Neugebauer G., Koplan E. L., Lloyd L. A., de Jong T., Habing H. J., 1988, ApJS, 68, 91
- Rifatto et al. (1995) Rifatto A., Longo G., Capaccioli M., 1995, A&AS, 114, 527
- Rigopoulou et al. (1996) Rigopoulou D., Lawrence A., Rowan-Robinson M., 1996, MNRAS, 278, 1049
- Rigopoulou et al. (1999) Rigopoulou D., Spoon H. W. W., Genzel R., Lutz D., Moorwood A. F. M., Tran Q. D., 1999, AJ, 118, 2625
- Rogstad et al. (1973) Rogstad D. H., Shostak G. S., Rots A. H., 1973, A&A, 22, 111
- Roussel et al. (2001) Roussel H., Vigroux L., Bosma A., Sauvage M., Bonoli C., Gallais P., Hawarden T., Lequeux J., Madden S., Mazzei P., 2001, A&A, 369, 473
- Rowan-Robinson & Crawford (1989) Rowan-Robinson M., Crawford J., 1989, MNRAS, 238, 523
- Rybicki & Lightman (1979) Rybicki G. B., Lightman A. P., 1979, Radiative processes in astrophysics. New York, Wiley-Interscience, 1979. 393 p.
- Salasnich et al. (2000) Salasnich B., Girardi L., Weiss A., Chiosi C., 2000, A&A, 361, 1023
- Schmidt (1959) Schmidt M., 1959, ApJ, 129, 243
- Schmidt (1963) Schmidt M., 1963, ApJ, 137, 758
- Scoville et al. (1997) Scoville N. Z., Yun M. S., Bryant P. M., 1997, ApJ, 484, 702
- Searle et al. (1973) Searle L., Sargent W. L. W., Bagnuolo W. G., 1973, ApJ, 179, 427
- Shapley et al. (2001) Shapley A., Fabbiano G., Eskridge P. B., 2001, ApJS, 137, 139
- Shopbell & Bland-Hawthorn (1998) Shopbell P. L., Bland-Hawthorn J., 1998, ApJ, 493, 129
- Silva (1999) Silva L., 1999, PhD thesis, SISSA
- Silva et al. (1998) Silva L., Granato G. L., Bressan A., Danese L., 1998, ApJ, 509, 103
- Silva et al. (2003) Silva L., Granato G. L., Bressan A., Panuzzo P., 2003, in Revista Mexicana de Astronomia y Astrofisica Conference Series Modelling the Radio to X-ray SED of Galaxies. pp 93–93
- Skrutskie et al. (1997) Skrutskie M. F., Schneider S. E., Stiening R., Strom S. E., Weinberg M. D., Beichman C., Chester T., Cutri R., Lonsdale C., Elias J., Elston R., Capps R., Carpenter J., Huchra J., Liebert J., Monet D., Price S., Seitzer P., 1997, in ASSL Vol. 210: The Impact of Large Scale Near-IR Sky Surveys The Two Micron All Sky Survey (2MASS): Overview and Status.. p. 25
- Smith et al. (1989) Smith C. H., Aitken D. K., Roche P. F., 1989, MNRAS, 241, 425
- Soifer et al. (1989) Soifer B. T., Boehmer L., Neugebauer G., Sanders D. B., 1989, AJ, 98, 766
- Soifer et al. (1998) Soifer B. T., Neugebauer G., Franx M., Matthews K., Illingworth G. D., 1998, ApJL, 501, L171
- Soifer et al. (1999) Soifer B. T., Neugebauer G., Matthews K., Becklin E. E., Ressler M., Werner M. W., Weinberger A. J., Egami E., 1999, ApJ, 513, 207
- Soifer et al. (1987) Soifer B. T., Sanders D. B., Madore B. F., Neugebauer G., Danielson G. E., Elias J. H., Lonsdale C. J., Rice W. L., 1987, ApJ, 320, 238
- Solinger et al. (1977) Solinger A., Morrison P., Markert T., 1977, ApJ, 211, 707
- Solomon et al. (1997) Solomon P. M., Downes D., Radford S. J. E., Barrett J. W., 1997, ApJ, 478, 144
- Spinoglio et al. (1995) Spinoglio L., Malkan M. A., Rush B., Carrasco L., Recillas-Cruz E., 1995, ApJ, 453, 616
- Spoon et al. (2004) Spoon H. W. W., Moorwood A. F. M., Lutz D., Tielens A. G. G. M., Siebenmorgen R., Keane J. V., 2004, A&A, 414, 873
- Stark et al. (1989) Stark A. A., Davidson J. A., Platt S., Harper D. A., Pernic R., Loewenstein R., Engargiola G., Casey S., 1989, ApJ, 337, 650
- Steidel et al. (1999) Steidel C. C., Adelberger K. L., Giavalisco M., Dickinson M., Pettini M., 1999, ApJ, 519, 1
- Steidel et al. (1996) Steidel C. C., Giavalisco M., Pettini M., Dickinson M., Adelberger K. L., 1996, ApJL, 462, L17
- Sturm et al. (1996) Sturm E., Lutz D., Genzel R., Sternberg A., Egami E., Kunze D., Rigopoulou D., Bauer O. H., Feuchtgruber H., Moorwood A. F. M., de Graauw T., 1996, A&A, 315, L133
- Sturm et al. (2000) Sturm E., Lutz D., Tran D., Feuchtgruber H., Genzel R., Kunze D., Moorwood A. F. M., Thornley M. D., 2000, A&A, 358, 481
- Tacconi & Young (1986) Tacconi L. J., Young J. S., 1986, ApJ, 308, 600
- Takagi et al. (2003) Takagi T., Arimoto N., Hanami H., 2003, MNRAS, 340, 813
- Takagi et al. (2004) Takagi T., Hanami H., Arimoto N., 2004, MNRAS, 355, 424
- Takagi et al. (2003) Takagi T., Vansevicius V., Arimoto N., 2003, Publ. Astron. Soc. Jpn., 55, 385
- Talbot & Arnett (1971) Talbot R. J., Arnett W. D., 1971, ApJ, 170, 409
- Tammann & Sandage (1968) Tammann G. A., Sandage A., 1968, ApJ, 151, 825
- Tantalo et al. (1996) Tantalo R., Chiosi C., Bressan A., Fagotto F., 1996, A&A, 311, 361
- Tantalo et al. (1998) Tantalo R., Chiosi C., Bressan A., Marigo P., Portinari L., 1998, A&A, 335, 823
- Temi et al. (2004) Temi P., Brighenti F., Mathews W. G., Bregman J. D., 2004, ApJS, 151, 237
- Tinsley (1972) Tinsley B. M., 1972, A&A, 20, 383
- Tran et al. (2001) Tran Q. D., Lutz D., Genzel R., Rigopoulou D., Spoon H. W. W., Sturm E., Gerin M., Hines D. C., Moorwood A. F. M., Sanders D. B., Scoville N., Taniguchi Y., Ward M., 2001, ApJ, 552, 527
- Tuffs & Gabriel (2003) Tuffs R. J., Gabriel C., 2003, A&A, 410, 1075
- Tuffs et al. (1996) Tuffs R. J., Lemke D., Xu C., Davies J. I., Gabriel C., Heinrichsen I., Helou G., Hippelein H., Lu N. Y., Skaley D., 1996, A&A, 315, L149
- Walsh et al. (2002) Walsh W., Beck R., Thuma G., Weiss A., Wielebinski R., Dumke M., 2002, A&A, 388, 7
- Weingartner & Draine (2001a) Weingartner J. C., Draine B. T., 2001a, ApJ, 548, 296
- Weingartner & Draine (2001b) Weingartner J. C., Draine B. T., 2001b, ApJS, 134, 263
- Wiklind & Henkel (1995) Wiklind T., Henkel C., 1995, A&A, 297, L71
- Wild et al. (1992) Wild W., Harris A. I., Eckart A., Genzel R., Graf U. U., Jackson J. M., Russell A. P. G., Stutzki J., 1992, A&A, 265, 447
- Wise & Silva (1996) Wise M. W., Silva D. R., 1996, ApJ, 461, 155
- Witt et al. (1992) Witt A. N., Thronson H. A., Capuano J. M., 1992, ApJ, 393, 611
- Wynn-Williams & Becklin (1993) Wynn-Williams C. G., Becklin E. E., 1993, ApJ, 412, 535
- York et al. (2000) York D. G., Adelman J., Anderson J. E., Anderson S. F., Annis J., Bahcall N. A., Bakken J. A., Barkhouser R., Bastian S., Berman E., Boroski W. N., 2000, AJ, 120, 1579
- Young & Knezek (1989) Young J. S., Knezek P. M., 1989, ApJL, 347, L55
- Young et al. (1989) Young J. S., Xie S., Kenney J. D. P., Rice W. L., 1989, ApJS, 70, 699
- Yun et al. (1993) Yun M. S., Ho P. T. P., Lo K. Y., 1993, ApJL, 411, L17
- Zwitter et al. (2004) Zwitter T., Castelli F., Munari U., 2004, A&A, 417, 1055