[
Cold dark matter identification: Diurnal modulation reexamined
Abstract
We report on new estimates of the modulation expected in semiconductor detectors due to eclipsing of dark matter particles in the Earth. We reevaluate the theoretical modulation significances and discuss the differences found with previous calculations. We find that a significantly larger statistics than previously estimated is needed to achieve the same level of sensitivity in the modulated signal.
pacs:
PACS numbers: 95.35.+d, 14.60.St]
I Introduction
For the past ten years or so semiconductor detectors (germanium and silicon) have been used to place bounds on masses and cross sections of cold dark matter candidates [1, 2, 3, 4]. In these devices massive particles in the halo of our Galaxy, with interactions weaker than electromagnetic, can be detected by measuring the recoil energy produced by their elastic scattering off the detector nuclei.
To discriminate the signature of these weakly interacting massive particles (WIMP’s) from the background, the first idea advanced [5] was to look for annual modulations of the detection rates originating in the orbital motion of the Earth around the Sun. Due to this, the average WIMP velocity relative to the Earth does not remain constant in time, giving rise to a variation, between June and December, of the order of 4% to 6% [5].
In 1992, Collar and Avignone [6] put forward the idea of looking for daily—as opposed to annual—modulations in counting rates and energy spectra. The argument was based on the fact that the Earth, during its daily rotation, could act as a shield in front of the detector eclipsing the dark matter wind traversing the planet. For candidates with scalar or vector interactions (axial-vector interactions with the Earth constituents are small) this would modify fluxes and velocity distributions, thus affecting counting rates. The theoretical estimates of this effect were obtained by Monte Carlo calculations (MC) by these authors [7] and indicated that for a suitably located detector the modulation could be of the order of 2 to 10% for the range of masses for which semiconductor detectors are more sensitive (10 GeV to 10 TeV) and for couplings of the order of the weak coupling constant [7]. Either type of search, annual or diurnal, requires the signal to be collected in the form of “event by event;” namely, each event must be time tagged.
Because of its shorter period, daily modulation has the advantage of placing less stringent requirements on the stability of the detector and its associated electronics. The first results ever published of a search for daily modulation appeared some time ago [8, 9, 10] and were performed with a Ge detector in the Canfranc tunnel. The experiment, run by the USC/PNNL/UZ (University of South Carolina, Pacific Northwest National Laboratories, Zaragoza) collaboration was located, however, in a geographical location which did not favor this sort of search. To improve this, a new site was sought and eventually found in Sierra Grande, Argentina, where a laboratory was set up and a 1.033 kg Ge detector installed in mid 1994. The TANDAR group, with support of the rest of the collaboration, has been running the experiment since then and the first analyses of the data were published elsewhere [11].
To get acquainted with the details involved in the calculation and to carry out an independent check of the previous theoretical estimates, a new MC code was developed [12]. The new results indicate that, for masses larger than 1 TeV (and couplings as large as 10 times the weak coupling constant) the modulation of the signal is predicted to be less than 1%. This is at variance with the original calculations and implies that a larger amount of data than previously estimated (more than 20 kg yr for a modulation of 0.5% as opposed to 2 kg yr) is needed for the sensitivity of the diurnal modulation method to exceed that of the conventional signal-to-noise [1, 8].
The aim of this paper is to report on new estimates, to evaluate the expected modulation significances, and to discuss the source of the discrepancy with respect to the original calculation. The next section describes the input to the calculation and gives a general idea of its contents. In the last section we give an account of the results and we discuss the differences with previous reports. Finally, we present some conclusions.
II Expected Daily Modulation
For an incoming WIMP of mass and velocity () the total counting rate in the recoil-energy interval , of the Ge nuclei, is given by
| (1) |
where is the total number of atoms in the detector, is the number density of WIMP’s ( GeV cm-3) and is the Maxwell-Boltzmann velocity distribution of the WIMP’s for an observer on the Earth: namely [13],
| (2) |
where
| (3) |
In the previous equation, is the velocity of the Earth with respect to the galactic rest frame ( 230 km s-1), is the velocity dispersion of the WIMP’s in the galactic halo ( is typically 270 km s-1 [13]), and the distribution (2) is normalized to one. In Eq. (1), is the maximum velocity


of the WIMP’s (, where is the escape velocity from our galaxy, 570 km s-1) and is the minimum velocity of a WIMP necessary to contribute to a particular energy of the recoil spectrum, . If is the reduced mass of the WIMP-nucleus system and is the mass of the recoiling nucleus, then
| (4) |
In Eq. (1) the differential cross section for the scattering of a WIMP off a spin zero () nucleus in the detector assuming the exchange of -like vector boson (; GeV-2, the Fermi coupling constant) is of the form [14]


| (5) |
where (fm) is the nuclear radius, is the weak mixing angle, and the exponential factor in Eq. (5) takes into account the loss of coherence of the interaction. The calculated recoil spectrum must also be convoluted with a function accounting for the efficiency of the recoiling process generating an ionization signal. In our case this function was taken from Ref. [1].
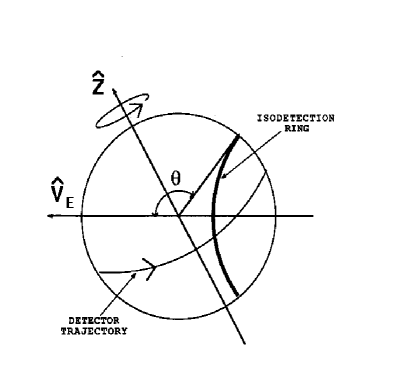
Estimations of a diurnal modulation involve considering the relation between the rotational axis of the Earth and its velocity (see Fig. 1). The velocity of the Earth, , through the Galaxy defines an axis of symmetry around which, the dispersion of WIMP’s has azimuthal symmetry. The position vector of a given detector (with the origin in the center of the planet) and define an angle, , that plays the role of a zenith angle. Thus, at the detector is maximally exposed to the “WIMP’s wind,” whereas at this exposure is diminished by the bulk of the Earth’s mass. The angle also defines isodetection rings, or rings of constant flux due to the symmetry of the problem. To each angle we can associate a time in some system. Particularly, the relation between the local sidereal time (LST) and the isodetection angles crossed by the Sierra Grande detector during 1994 is shown in Fig. 2. A detectable modulation effect can be quantitatively predicted provided there is a significant change with in the total counting rate and/or spectral shape.
The purpose of the MC code is to track all the particles and calculate their number density per unit area and their velocity distributions at the surface of the Earth, for all isodetection rings. The parameters and model of Earth are similar to those used in Ref. [7]. A typical outcome of the Monte Carlo can be seen in Fig. 3 which

shows how the velocity distributions, of WIMP’s of 50 GeV mass and vary for different angles. The parameter depicted in the figure, is defined as the difference between the velocity distribution of the WIMP’s for a given angle and the original Maxwell-Boltzmann distribution as given by Eq. (2), []. The distributions are all normalized to unity, since the number of particles crossing the area element are not the same. Note that the elastic scattering with nuclei of the Earth has the effect of depleting the region of particles with high velocities and increasing the number of particles with lower speeds.
A parameter that summarizes the properties of the velocity distributions is the average velocity distribution of incoming (i.e., penetrating the Earth) plus outgoing (exiting the Earth) WIMP’s, . Figure 4 shows

| WIMP | LST | LST | ||||
| mass | at max. | at min. | (keV) | (counts/keV kg d) | (counts/keV kg d) | (%) |
| (GeV) | (h) | (h) | ||||
| 20 | 17.5 | 9.5 | 0 | 7.69 | 7.51 | 2.30 |
| 30 | 20.5 | 9.5 | 0 | 10.16 | 9.84 | 3.12 |
| 50 | 22.5 | 9.5 | 0 | 10.55 | 10.14 | 3.88 |
| 70 | 20.5 | 9.5 | 2.5 | 6.95 | 6.68 | 3.83 |
| 100 | 20.5 | 8.5 | 3 | 5.62 | 5.43 | 3.43 |
| 200 | 20.5 | 8.5 | 10 | 1.73 | 1.68 | 2.75 |
| 300 | 19.5 | 8.5 | 15 | 0.83 | 0.82 | 1.57 |
| 10 | 17.5 | 8.5 | 0 | 6.04 | 5.82 | 3.74 |
| 20 | 22.5 | 9.5 | 0 | 25.72 | 23.78 | 7.52 |
| 30 | 20.5 | 9.5 | 0 | 33.96 | 30.62 | 9.83 |
| 50 | 22.5 | 9.5 | 0 | 35.34 | 31.54 | 10.74 |
| 70 | 20.5 | 9.5 | 2.5 | 23.10 | 20.47 | 11.6 |
| 100 | 20.5 | 9.5 | 3 | 18.70 | 16.79 | 10.2 |
| 200 | 20.5 | 9.5 | 6 | 8.58 | 8.07 | 5.9 |
| 300 | 20.5 | 9.5 | 10 | 4.28 | 4.10 | 4.4 |
| 400 | 22.5 | 9.5 | 12 | 2.84 | 2.74 | 3.34 |
| 500 | 22.5 | 9.5 | 15 | 1.83 | 1.78 | 2.83 |
| 1000 | 17.5 | 11.5 | 22 | 0.58 | 0.57 | 1.62 |
| 10 | 19.5 | 9.5 | 0 | 60.94 | 44.24 | 27.40 |
| 20 | 19.5 | 8.5 | 0 | 257.30 | 151.04 | 41.30 |
| 30 | 19.5 | 8.5 | 0 | 335.08 | 183.08 | 45.18 |
| 40 | 19.5 | 9.5 | 0 | 351.34 | 188.54 | 46.34 |
| 50 | 19.5 | 8.5 | 0 | 344.52 | 186.06 | 45.99 |
| 70 | 20.5 | 8.5 | 0 | 308.92 | 173.04 | 43.99 |
| 100 | 20.5 | 8.5 | 0 | 255.74 | 152.88 | 40.22 |
| 200 | 20.5 | 9.5 | 0 | 153.80 | 105.88 | 31.16 |
| 500 | 20.5 | 9.5 | 5 | 43.06 | 33.51 | 22.20 |
| 700 | 20.5 | 8.5 | 5 | 25.15 | 20.64 | 17.93 |
| 1000 | 20.5 | 8.5 | 10 | 14.53 | 12.71 | 12.56 |
| 2000 | 20.5 | 10.5 | 15 | 5.04 | 4.74 | 5.90 |
| 3000 | 19.5 | 9.5 | 18 | 2.72 | 2.61 | 3.80 |
the average velocity of the WIMP’s as a function of together with the average velocities for the case of a transparent Earth. Note that for all angles, the average values of the distributions are lower than in the transparent case meaning that, due to the interaction, the particles lose velocity to some degree. In particular, those distributions when approaches 180o would yield the largest effect.
Figures 3 and 4 indicate that the passage of the WIMP’s through the Earth alters their velocity distributions. This phenomenon and the net change in the number density of particles for rear angles modify the differential rate with and are therefore responsible for the effect of diurnal modulation.
Figure 5 illustrates the changes produced in the differential energy spectra. In general, low masses are inefficient in depositing energy in the detector because their momentum transfer to recoiling nuclei is smaller, therefo-
re their signal decreases rapidly with energy. Signals at high energies are only achievable by high-speed WIMP’s, but WIMPS with such velocities ( km s-1) are scarce. High masses, on the other hand, can deposit larger amounts of energy. But, their number density decreases as the mass of the candidates increases because of the constant halo density that galactic dynamics requires. This results in an overall signal decrease with WIMP mass at high masses and a different slope on the graph.
The rather small variations in the velocity distributions at (day) and (night) are responsible for the two sets of predicted energy spectra in Fig. 5 (solid and dashed lines, respectively). Generally speaking, those WIMP’s scattering the Earth at rear angles have lower relative speeds and therefore their signal decreases. However, this is only true for a specfic range of masses. For masses 100 GeV and larger, the variations in the velocity distributions change the slopes of the spectra generating crossing points at definite energies. These crossings energies, , occur at 1 keV for a mass of 100 GeV, 11 keV for 400 GeV, 20 keV for 1 TeV, and 22 keV for a 2 TeV WIMP mass. Determining the minimum energy and integrating the energy spectra between and an upper limit (say 50 keV) we optimize the predicted signal to obtain the maximum variation in the detection rate above .
These new calculations clearly show the energy below which scattering in the Earth increases the counting rate of WIMP’s, and above which the counting rate is decreased. This gives a new and more sensitive technique to analyze experimental data for diurnal modulations than just using the portion of the spectrum above .
The variation of the differential rate with is all we need to predict the WIMP’s signal. By combining this result with our knowledge of as a function of time (Fig. 2) one is able to look for the characteristic signature in our detector due to WIMP’s.
III Results and Conclusions
The total expected number of counts per keV and kg h in the range to 50 keV is shown in Fig. 6. In the graph, the cross sections were enhanced a factor 100 with respect to in order to make the diurnal modulation effect visible. From the figure, it can be clearly seen that the modulation effect is larger for masses close to 50 GeV, whereas it is very small for masses greater than 500 GeV. This is due to the asymmetry between the masses of the Earth nuclei and the WIMP masses. If the mass of the latter is many times larger than that of the nuclei in the Earth, the WIMP continues its trajectory almost unaffected by the interaction and no modulation is expected. For masses close to the average mass of nuclei in the Earth, the WIMP may suffer a large deflection and the scattering angle can be significantly different from zero. In this case, we predict a clear modulation effect.
To quantify the variations in Fig. 6, we define the modulation amplitude, , as the ratio of the difference between the maximum and minimum of the total predicted rates (between – 50 keV) with respect to the maximum rate,
| (6) |
The behavior of the modulation amplitude, , as a function of the WIMP mass for different coupling constants, , is shown in Fig. 7 (the actual values are given in Table I). In the graph only data points for which modulation is clearly seen are shown. Table I also shows the LST at which the maxima and minima are predicted.

We notice that for the coupling constants considered here, the greater the mass of the candidate, the smaller is the modulation expected. This decrease of the modulation amplitude moves towards the lower masses as we decrease the coupling constant.
The results of the present calculations are in disagreement with those of Refs. [7, 8] where no degradation of the modulation amplitude is predicted for increasing masses. A cross-check of the calculations revealed that in all previous results a transformation of the scattering angle from the center of mass to the laboratory frame was missing. When the correction is included the modulation amplitudes decrease for masses larger than GeV bringing the results into agreement.
Figure 8 summarizes the differences in predictions at 1.5 keV before and after the correction. This figure is analogous to Fig. 9 in Ref. [7]. Notice that, since some of the new values of the relative residual are negative,
Fig. 8 shows their absolute values. At some point, the spectrum of the high band is larger than the low band and this produces a negative value of the residual. Only three interaction strengths are considered in the figure just to exhibit the modifications to the original and to show the behavior of the relative residuals with the mass of the WIMP’s. Now the new values show a behavior with WIMP’s mass similar to Fig. 7.
In view of these new results, we conclude that a larger amount of data than previously estimated is needed for the sensitivity of the diurnal modulation method to exceed that of the conventional signal-to-noise. The minimum modulation amplitude that can be detected or excluded decreases, as is the case for any search for a periodic modulation, as roughly the square root of the volume of data. For collected statistics of 500 kg day, and typical background levels of 2–3 counts/keV kg day [11] this translates in a sensitivity of 2%, which would be produced by particles (see Fig. 7) that are already excluded using the conventional signal-to-noise method (for Dirac neutrinos, , masses larger than 26 GeV and up to 4.7 TeV have already been ruled out by direct-detection experiments [15]). With these figures, at least 20 kg yr of data are required for the diurnal modulation method to be sensitive to 0.5% needed to extend the WIMP search into the cosmological interesting region. It is worth noticing that though the calculations were conducted assuming vector interactions between the candidates and the Earth constituents our results also apply to dark matter particles with scalar interactions.
The other alternative to identify a WIMP candidate using a semiconductor detector is to look for annual modulation of the signal. Now the average velocity of the WIMP’s impinging on the Earth is what changes throughout one period (a year). Since this variation is independent of the WIMP’s mass, changes in the rate should be present for any candidate. At the present time, an exhaustive data analysis of the DEMOS collaboration is being carried looking for annual modulations of the signal in different parts of the spectrum.
Acknowledgements.
The authors would like to express their appreciation to Professor F. T. Avignone for his help and guidance throughout the doctoral research of F.H. from which this work resulted.REFERENCES
- [1] S. P. Ahlen et al., Phys. Lett. B 195, 603 (1987).
- [2] D. O. Caldwell et al., Phys. Rev. Lett. 61, 510 (1988); D. O. Caldwell, in Neutrino 94, Proceedings of the International Symposium on Neutrino Physics and Astrophysics, Eilat, Israel, edited by A. Dar et al. [Nucl. Phys. B (Proc. Suppl.) 38, 394 (1995)].
- [3] L. Mosca, in TAUP 95, Proceedings of the Workshop on Theoretical and Phenomenological Aspects of Underground Physics, Toledo, Spain, edited by A. Morales et al. [Nucl. Phys. B (Proc. Suppl.) 48, 34 (1996)].
- [4] F. T. Avignone III and A. Morales, Neutrino 96, [Nucl. Phys. B (Proc. Suppl.). (in press)].
- [5] A. K. Drukier, K. Freese, and D. N. Spergel, Phys. Rev. D 33, 3495 (1986).
- [6] J. I. Collar and F. T. Avignone III, Phys. Lett. B275 181 (1992).
- [7] J. I. Collar and F. T. Avignone III, Phys. Rev. D 47 5238 (1993).
- [8] E. García, J. Morales, A. Morales, M. L. Sarsa, A. Ortiz de Solórzano, E. Cerezo, R. Nuñez–Lagos, J. Puimedón, C. Saénz, J. A. Villar, J. I. Collar, F. T. Avignone III, R. L. Brodzinski, H. S. Miley, and J. H. Reeves, Phys. Rev. D 51 1458 (1995).
- [9] M. L. Sarsa, A. Morales, J. Morales, E. García, A. Ortiz de Solórzano, J. Puimedón, C. Sáenz, A. Salinas, and J. A. Villar, in TAUP 95 [3], p. 73.
- [10] E. García et al., in The Dark Side of the Universe: Experimental Efforts and Theoretical Framework, Proceedings of the International Workshop, Rome, Italy, 1993, edited by C. Bernabei and C. Tao (World Scientific, Singapore 1994), p. 216.
- [11] D. E. Di Gregorio, D. Abriola, F. T. Avignone, R.L. Brodzinski, J. I. Collar, H. A. Farach, E. García, A. O. Gattone, F. Hasenbalg, H. Huck, H. S. Miley, A. Morales, J. Morales, A. Ortiz de Solórzano, J. Puimedón, J. H. Reeves, C. Sáenz, A. Salinas, M. L. Sarsa, D. Tomasi, I. Urteaga, and J. A. Villar, in TAUP 95 [3], p. 56.
- [12] F. Hasenbalg, Ph.D. thesis, University of South Carolina, 1996.
- [13] K. Freese, J. Frieman, and A. Gould, Phys. Rev. D 37, 3388 (1988).
- [14] I. Wasserman, Phys. Rev. D 33, 2071 (1986); M. W. Goodman and E. Witten, ibid. 31, 3059 (1985).
- [15] M. Beck et al., Phys. Lett. B 336, 141 (1994).