06(08.13.2; 08.16.4; 09.04.1; 11.13.1; 13.09.01; 13.09.6) 11institutetext: European Southern Observatory, Karl-Schwarzschild Straße 2, D-85748 Garching bei München, Germany 22institutetext: Astronomical Institute, University of Amsterdam, Kruislaan 403, NL-1098 SJ Amsterdam, The Netherlands 33institutetext: South African Astronomical Observatory, P.O.Box 9, 7935 Observatory, South Africa 44institutetext: European Southern Observatory, Casilla 19001, Santiago 19, Chile 55institutetext: Institut d’Astrophysique de Paris, 98bis Boulevard Arago, F-75014 Paris, France 66institutetext: ISO Science Operations Centre, Astrophysics Division of ESA, Villafranca del Castillo, P.O.Box 50727, 28080 Madrid, Spain
Obscured Asymptotic Giant Branch stars in the Magellanic Clouds III. New IRAS counterparts††thanks: based on observations collected at the European Southern Observatory, La Silla, Chile (proposal ESO 56.E-0681)
Abstract
We have searched for near-infrared stellar counterparts of IRAS point sources in the Large Magellanic Cloud (LMC), in J- and K-bands. This resulted in the detection of 21 counterparts, of which 19 are new discoveries. Using colour–magnitude and colour–colour diagrams, we identify 13 Asymptotic Giant Branch (AGB) stars with thick circumstellar dust envelopes, 7 possible early post-AGB stars or stars recovering from a thermal pulse, and 1 red supergiant or foreground star. For 10 of the IRAS targets we do not succeed in detecting and/or identifying a near-infrared counterpart. We serendipitously detect 14 other red sources, of which 2 are known Long Period Variables, and a few galaxies. The near-infrared and optical colours of the galaxies may indicate considerable interstellar extinction through the LMC, as much as 2–4 mag. The relative number of AGB carbon stars over oxygen stars is shown to decrease as the luminosity increases. Yet amongst the faintest mass-losing AGB stars oxygen-rich stars still exist, which puts constraints on current convection theories that predict the occurrence of third dredge-up and Hot Bottom Burning. We investigate the nature of some LMC stars that have infrared properties very similar to suspected Galactic post-AGB stars.
keywords:
Stars: mass loss – Stars: AGB and post-AGB – dust, extinction — Magellanic Clouds – Infrared: galaxies — Infrared: stars1 Introduction
Population studies of Asymptotic Giant Branch (AGB) stars in the Large Magellanic Cloud (LMC) have led to a number of interesting results, using the advantage of its known distance. The period–luminosity relation for Mira variables was deduced from photometric monitoring of Long Period Variables (LPVs) in the LMC (Feast et al. 1989). Objective prism survey studies of the LMC showed a clear lack of carbon stars amongst the most luminous AGB stars (M mag; see Iben 1981 for a review). These studies have been largely based on samples of optically visible AGB stars (e.g. Blanco et al. 1980; Cohen et al. 1981; Westerlund et al. 1981).
Stars near the tip of the AGB experience mass-loss rates as high as M⊙ yr-1, giving rise to circumstellar envelopes (CSEs) in which dust forms, making them optically thick at optical wavelengths. Hence these AGB stars may only be observable at infrared (IR) wavelengths and were missed in earlier studies. Samples of candidate obscured AGB stars in the LMC have only recently become available (Reid 1991; Wood et al. 1992; Zijlstra et al. 1996). The AGB nature of some of these stars still needs to be confirmed, and their (circum-)stellar properties are yet to be explored in detail. The small existing samples should be extended both in number and in (circum-)stellar parameter space, to allow a population study of mass-losing AGB stars in the LMC.
In paper I (Loup et al. 1997) we constructed an IRAS-selected sample of AGB and post-AGB star candidates. In paper II (Zijlstra et al. 1996) we confirmed the AGB nature for a subsample thereof, on the basis of their bolometric luminosities and their near-IR (NIR) and IRAS colours. We also showed that the chemical type — oxygen or carbon star — may be deduced from the position of a mass-losing AGB star in the K–[12] versus H–K diagram. Considering the difficulty of obtaining spectra of these stars, the IR colour diagnostics are a powerful tool in determining the nature of the IR stars (e.g. van der Veen & Habing 1988; Guglielmo et al. 1993; Le Bertre 1993; Le Sidaner & Le Bertre 1994; Loup & Groenewegen 1994).
Here, in paper III of our series on the study of obscured AGB stars in the Magellanic Clouds, we present the results of a NIR search for counterparts of IRAS point sources in the direction of the LMC, aiming at enlarging the sample of known obscured AGB stars in the LMC. After classifying the stars as being mass-losing AGB stars, or not, we briefly comment on their properties. We discuss not only the AGB stars, but also the nature of other positive identifications, and serendipitous detections. Amongst them are stars that may be explained as being in the post-AGB phase, and we compare their properties with those of a sample of IRAS-selected post-AGB star candidates in the Milky Way. We also find a few galaxies, which may be used as probes to measure the interstellar extinction inside the LMC.
2 Observations
2.1 Sample

For our search for NIR counterparts, we reduced the list of nearly 200 best-candidate sources from paper I to a list of 68 sources, excluding stars that were studied in paper II (except for one source). Our selection criteria are either IRAS flux densities , or and Jy. Limited by the available observing time, we finally observed 31 sources. They were selected mainly amongst the sources that were relatively bright at 12 m, had red [12]–[25] colours, and were not affected by cirrus at 60 m. We adopt [12] and [12]–[25], with and the flux density in Jy in the IRAS 12 and 25 m bands, respectively (IRAS Explanatory Supplement 1988). In the IRAS [12] versus [12]–[25] magnitude–colour diagram shown in Fig. 1, these 31 sources are represented by shaded circles, whereas the remaining 37 sources are plotted as open circles. Several sources coincide in this diagram, because of the discrete values for the IRAS flux densities. The diagram shows that we mostly selected the brighter and slightly redder sources. We also plotted the AGB star candidates (dots) and red supergiants (crosses) from paper II. The present sample is fainter at 12 m and has a redder [12]–[25] colour on average than the AGB star candidates from paper II, that are themselves fainter at 12 m and have redder [12]–[25] colours than the supergiants.
2.2 J and K-band imaging photometry
We observed on the clear nights 1/2 and 2/3 January 1996, using the NIR camera IRAC2 at the ESO/MPI 2.2m telescope at La Silla, Chile. Lens C was chosen to cover a field of view of , with a pixel scale of . This combines the advantages of a large field of view and a reasonable sampling of the point spread function for doing photometry. For each IRAS point source field we did a sequence of 12 images in the K-band filter, each consisting of ten 3-second exposures, shifted by in right ascension with respect to the previous image. We repeated this procedure backwards, using the J-band filter. The search is deepest in the centred at the IRAS point source. We compared the IRAC2 fields with the Digitized Sky Survey (http://archive.eso.org/dss/dss), to determine the actual field centres. The absolute pointing of the telescope was found to be accurate to about , from a comparison of the IRAC2 field centres and the IRAS positions used to point the telescope.
We constructed frames that represent a good approximation of the background emission, by median-averaging the shifted images within each sequence, rejecting the brightest pixels to avoid contamination by stars. The background-subtracted images were flat-field corrected using flatfields obtained by taking an image of a screen in the dome, illuminated by a lamp dedicated for this purpose, and subtracting a similar image with the lamp off. The individual images were shifted to bring the position of the IRAS point source back in the centre, by integer number of pixels to ensure flux conservation. Finally these images were added together. In this way, we could detect stars down to limiting magnitudes of mag, and mag. The limiting magnitude varied from field to field by about a magnitude, mainly due to differences in the background.
The standard stars were observed by taking an image consisting of an average of thirty 0.6-second exposures, and another image shifted by . Their difference yields a background-subtracted frame, which we then flat-field. The standard stars were observed regularly during the night, covering the same air masses as the LMC.
The J and K-band images were blinked to identify the J–K reddest sources. On these, circular aperture photometry was done with an increasing aperture radius, to create a radial magnitude profile of the star. The same was done for the standard star. From the differential magnitude profile the magnitude of the program star can be estimated, as well as its accuracy. The standard stars used are HD38150 (J mag, K mag), SA94–702 ( GSC 00048–00918; J mag, K mag), and HD52467 (J mag, K mag). These magnitudes are in the SAAO system (cf. Carter 1990), and the IRAC2 magnitudes have been converted to the SAAO system using relations derived by Lidman (1995) on a single test night:
| (1) |
The 1- errors are 0.012 and 0.015 on the coefficients for the JIRAC2 and KIRAC2 magnitudes, respectively. The conditions during the observations were photometric. Extinction corrections were found to be 0.05 mag air-mass-1 in the J-band, and 0.03 mag air-mass-1 in the K-band on the first night, and twice as large on the second night. The relative humidity, dome temperature, and seeing were about 60—70%, C, and 0.7—0.8′′ on the first night, and about 40—60%, 15—12∘C, and 0.7—1′′ on the second night.
2.3 BVRi-band imaging photometry
We observed on the clear night 24/25, and the partially cloudy night 30/31 December 1996, using the direct imaging camera at the Dutch 0.9m telescope at La Silla, Chile.
On the first night, we imaged two fields centred on the galaxies that we detected in the NIR close to the IRAS point sources LI–LMC0603 and LI–LMC1818 (see below). The night was photometric, although the Moon was close to opposition. We took six images in the Bessel B-band, and three images in the Bessel R-band, all 200 seconds integration time per frame. Stellar images on these frames had FWHM of typically 1.1′′–1.4′′. The images were calibrated by stars in the Landolt (1992) standard star field SA98 that were observed close in time and airmass to the galaxy fields. Hence the B and R magnitudes are on the photometric systems of Johnson and Kron-Cousins, respectively. We obtained integrated magnitudes for the galaxies and the few redmost stars in the fields, using aperture photometry and applying aperture corrections derived from the much less crowded standard star fields.
On the second night, we measured the bright stellar counterpart (see below) of LI–LMC1821 in the Bessel B, V, and R-bands, and the Gunn i-band. The night was cloudy, and useful photometry could only be obtained by rapidly switching back and forth between the star and Dor (= HR2194), an A0 Main Sequence star of V and B–V mag at 1.5 degree separation, until stable and well-defined magnitudes could be determined. The B, V, and R magnitudes that we obtained for LI–LMC1821 are on the Johnson photometric system, whereas the i magnitude is on the Gunn photometric system. We estimated the Gunn i-band magnitude for Dor to be i mag. Integration times were 0.3, 0.2, 0.2, and 0.5 seconds for BVRi respectively. To avoid problems with shutter delay times for these short integration times, we used the same integration times for both stars, and they were always positioned at the same place on the CCD.
3 Results
3.1 Identification with IRAS sources
| LI–LMC | IRAS | RA(2000) | Dec(2000) | J | K | J-K | S12 | S25 | [12]-[25] | ||||
| positive identifications: AGB stars in the LMC | |||||||||||||
| 0099 | 04518–6852 | 04 51 37.5 | –68 47 32 | 13 | 19.3 | 0.5 | 16.57 | 0.13 | 2.7 | 0.6 | 0.37 | 0.22 | 0.99 |
| 0109 | 04 52 19.9 | –67 22 37 | 29 | 11.61 | 0.01 | 9.13 | 0.01 | 2.48 | 0.01 | 0.22 | 0.22 | 1.56 | |
| 0136 | 04535–6616 | 04 53 45.0 | –66 11 43 | 9 | 22.6 | 0.4 | 15.55 | 0.07 | 7.0 | 0.4 | 0.19 | 0.33 | 2.16 |
| 0180 | 04552–6536 | 04 55 27.7 | –65 31 06 | 33 | 15.94 | 0.04 | 11.69 | 0.02 | 4.25 | 0.04 | 0.15 | 0.22 | 1.98 |
| 0297 | 05003–6712 | 05 00 19.4 | –67 07 53 | 10 | 12.04 | 0.06 | 9.48 | 0.04 | 2.56 | 0.07 | 0.44 | 0.44 | 1.56 |
| 0344 | 05026–6809 | 05 02 21.7 | –68 05 22 | 47 | 20.6 | 0.4 | 12.93 | 0.04 | 7.7 | 0.4 | 0.33 | 0.67 | 2.33 |
| 0603 | 05125–7035 | 05 12 00.4 | –70 32 22 | 4 | 19.0 | 0.2 | 13.99 | 0.04 | 5.0 | 0.2 | 0.41 | 0.44 | 1.64 |
| 0782 | 05187–7033 | 05 18 09.3 | –70 31 15 | 46 | 15.63 | 0.08 | 11.64 | 0.04 | 3.99 | 0.09 | 0.19 | 0.78 | 3.09 |
| 1092 | 05278–6942 | 05 27 23.8 | –69 39 43 | 3 | 20.2 | 0.4 | 14.26 | 0.04 | 5.9 | 0.4 | 0.37 | 0.44 | 1.75 |
| 1198 | 05306–7032 | 05 30 06.1 | –70 30 40 | 4 | 19.8 | 1.0 | 15.88 | 0.04 | 3.9 | 1.0 | 0.30 | 0.33 | 1.66 |
| 1813 | 06025–6712 | 06 02 31.3 | –67 12 47 | 10 | 20.0 | 0.3 | 13.26 | 0.02 | 6.7 | 0.3 | 0.44 | 0.44 | 1.56 |
| 1817 | 06028–6722 | 06 02 44.8 | –67 22 42 | 15 | 18.39 | 0.05 | 12.50 | 0.02 | 5.89 | 0.05 | 0.67 | 0.33 | 0.79 |
| 1818 | 06031–7227 | 06 02 07.2 | –72 27 19 | 12 | 20.5 | 0.3 | 17.30 | 0.17 | 3.2 | 0.3 | 0.52 | 0.56 | 1.64 |
| positive identification: LMC red supergiant or Galactic foreground star | |||||||||||||
| 1821 | 06045–6722 | 06 04 25.2 | –67 23 10 | 6 | 6.9 | 0.1 | 6.4 | 0.1 | 0.5 | 0.1 | 0.44 | 0.33 | 1.25 |
| tentative identifications: post-AGB or thermal pulse stars in LMC | |||||||||||||
| 0326 | 05019–6751 | 05 01 49.0 | –67 47 28 | 20 | 17.19 | 0.07 | 15.74 | 0.06 | 1.45 | 0.09 | 0.26 | 0.44 | 2.13 |
| 0530 | 05 09 40.4 | –69 24 17 | 6 | 13.01 | 0.06 | 11.94 | 0.04 | 1.07 | 0.07 | 0.22 | 0.22 | 1.56 | |
| 0777 | 05185–6806 | 05 18 28.1 | –68 04 05 | 44 | 17.05 | 0.05 | 14.79 | 0.03 | 2.26 | 0.06 | 0.19 | 0.39 | 2.34 |
| 1316 | 05 33 12.5 | –69 42 33 | 45 | 17.11 | 0.07 | 14.89 | 0.03 | 2.22 | 0.08 | 0.19 | 0.22 | 1.72 | |
| 1624 | 05439–6555 | 05 44 07.0 | –65 53 47 | 27 | 19.13 | 0.14 | 16.63 | 0.07 | 2.50 | 0.16 | 0.19 | 0.22 | 1.72 |
| 1721 | 05478–7045 | 05 47 12.5 | –70 44 16 | 10 | 17.80 | 0.05 | 15.09 | 0.04 | 2.71 | 0.06 | 0.26 | 0.44 | 2.13 |
| 1803 | 05588–6944 | 05 58 26.4 | –69 43 35 | 51 | 18.92 | 0.06 | 16.57 | 0.04 | 2.35 | 0.07 | 0.19 | 0.56 | 2.73 |
| NIR non-detections | |||||||||||||
| 0374 | 05039–7002 | 0.15 | 0.56 | 2.99 | |||||||||
| 0671 | 05150–6942 | 0.30 | 0.44 | 1.98 | |||||||||
| 0770 | 0.26 | 0.33 | 1.82 | ||||||||||
| 0918 | 05232–7111 | 0.22 | |||||||||||
| 0937 | 05237–7000 | 0.19 | 0.44 | 2.47 | |||||||||
| 1200 | 0.57 | 0.73 | 1.83 | ||||||||||
| 1232 | 05315–7145 | 0.15 | 0.78 | 3.35 | |||||||||
| 1745 | 05495–7034 | 0.15 | 0.89 | 3.49 | |||||||||
| 1759 | 05509–6956 | 0.48 | 0.78 | 2.09 | |||||||||
| 1768 | 05522–7120 | 0.19 | 0.22 | 1.72 | |||||||||
| field stars | |||||||||||||
| 0297b | 05 00 20.1 | –67 08 47 | 45 | 16.52 | 0.07 | 14.98 | 0.06 | 1.54 | 0.09 | ||||
| 0603b | 05 12 04.5 | –70 33 14 | 53 | 16.43 | 0.07 | 14.80 | 0.06 | 1.63 | 0.09 | ||||
| 0937b | 05 23 26.3 | –69 58 49 | 71 | 11.67 | 0.04 | 10.38 | 0.02 | 1.29 | 0.04 | ||||
| 1198b | 05 30 08.0 | –70 30 47 | 8 | 18.45 | 0.27 | 16.81 | 0.18 | 1.6 | 0.3 | ||||
| 1624b | 05 44 01.8 | –65 54 42 | 42 | 18.09 | 0.06 | 16.24 | 0.05 | 1.85 | 0.08 | ||||
| 1721b | 05 47 11.5 | –70 43 50 | 33 | 12.65 | 0.04 | 12.55 | 0.02 | 0.10 | 0.04 | ||||
| 1721c | 05 47 12.4 | –70 44 02 | 20 | 13.98 | 0.04 | 12.82 | 0.02 | 1.16 | 0.04 | ||||
| 1721d | 05 47 11.4 | –70 43 59 | 26 | 15.78 | 0.04 | 15.26 | 0.04 | 0.52 | 0.06 | ||||
| 1818b | 06 02 11.8 | –72 26 41 | 42 | 17.73 | 0.05 | 16.02 | 0.04 | 1.71 | 0.06 | ||||
| 1818c | 06 02 14.5 | –72 27 43 | 30 | 17.77 | 0.04 | 15.83 | 0.06 | 1.94 | 0.07 | ||||
| galaxies | |||||||||||||
| 0603c | 05 12 05.4 | –70 32 04 | 31 | 15.44 | 0.06 | 13.90 | 0.04 | 1.54 | 0.07 | ||||
| 1759b | 05 50 38.5 | –69 55 41 | 59 | 15.40 | 0.05 | 14.44 | 0.04 | 0.96 | 0.06 | ||||
| 1803b | 05 58 17.3 | –69 44 11 | 41 | 17.56 | 0.04 | 15.61 | 0.03 | 1.95 | 0.05 | ||||
| 1818d | 06 02 12.8 | –72 27 36 | 19 | 15.67 | 0.05 | 13.99 | 0.02 | 1.68 | 0.05 | ||||
The positive and tentative identifications, non-detections, serendipitous detections, and galaxies are listed in Table 1, together with the IRAS flux densities and NIR magnitudes, where applicable. The numbers of the stars refer to the LI–LMC numbers in the Schwering & Israel (1989, 1990) catalogue of IRAS point sources in the direction of the LMC. A suffix b, c, or d was added in the case of field stars or galaxies, neither of which were considered to be the counterpart of the quoted LI–LMC source. Positive and tentative identifications were found by first selecting the object in the field of view with the reddest J–K colour. Stars with J–K mag were considered to be the counterpart of the IRAS source, as no two such red objects ever appeared in the same field of view. In the absence of objects with J–K mag, objects were considered to be the counterpart of the IRAS source, if they either had J–K mag (i.e. cool and/or reddened stars, see e.g. Bell 1992) or were very bright (e.g. LI–LMC1821), and not too distant from the position of the IRAS source (i.e. within ). The counterparts with IR colours similar to those of mass-losing AGB stars have been enumerated under positive identifications, as this can be considered a confirmation of their identification with the IRAS source. The other counterparts have been enumerated under tentative identifications, and probably are stars with detached CSEs.
LI–LMC0109 was first detected in November 1995, using the NIR photometer at SAAO. IRAS05003–6712 was already known to be a mass-losing AGB star in the LMC (paper II). LI–LMC0530 is identified with SHV0510004–692755, an LPV with a period of 169 days (Hughes & Wood 1990, who measured J mag and K mag). We identify LI–LMC1721b with SHV0547489–704450, an LPV with a period of 264 days (Hughes & Wood 1990, who measured J mag and K mag): LI–LMC1721 is not associated with this LPV, because the NIR counterpart that we detect for this IRAS source is much redder than the LPV. The same is true for LI–LMC1721c, whereas LI–LMC1721d is too faint to be the LPV. We identify LI–LMC0937b with SHV0523536–700128, an LPV with a period of 381 days (Hughes & Wood 1990, who measured J mag and K mag). The IRAS source LI–LMC1759 lies at the edge of a small open cluster of perhaps a dozen stars within diameter, and may therefore not be related to any individual star. The galaxies are discussed below.
3.2 Serendipitous detections

We have calculated the separations of the IRAS point sources and the NIR sources detected with IRAC2 (Fig. 2: accumulated starting at infinity, and normalised to the total number of sources). The IRAS position is generally accurate to 5–15 arcsec, depending mainly on the 12 m flux level, but can be off by more than half an arc-minute (paper II).
The reddest sources with J–K (bold line) are undoubtedly the IRAS counterparts. The combined area of our 31 fields covers square degrees. The area of the LMC covered by the selection in paper I measures square degrees. Only if there were of the order of such NIR-red sources would one expect to have detected one serendipitously. There are of the order of IRAS detected (post-)AGB star candidates (paper I). Hence the population of stars with J–K that are not detected by IRAS would have to be at least as many as the IRAS-detected stars in the LMC. The number of planetary nebulae (PNe) in the LMC is estimated at 1100 (Pottasch 1984). The PN lifetimes of years are very similar to the lifetimes of the mass-losing AGB phase (less than years). Assuming that all mass-losing AGB stars will eventually form PNe, we estimate the number of mass-losing AGB stars in the LMC to be at most, arguing against the possibility of a population of LMC stars with J–K.
The bluer sources (J–K) that we consider as positive or tentative identifications (thin line in Fig. 2) could be contaminated by NIR stars that are not associated with the IRAS source. But these cannot be many, as seen from the similarity of the separation distribution to that of the reddest sources. The serendipitously detected NIR sources (field stars) and the galaxies have very similar separation distributions, much broader than the separation distributions of the positive identifications. This is indicative of their not being the IRAS counterpart.
A field of view of (the deep area only) implies an expected mean separation of for a serendipitous detection. The mean separation for our serendipitous detections is , and for the galaxies. We suspect that the detection probability near the edges is somewhat lower. Essentially all our detections are situated in the deep area. The mean separation is for the reddest, and for the bluer positive and tentative identifications. Replacing 2 or 3 of the reddest stars with separations of by the same number of stars but with separations of , we generate a separation distribution with a mean of . Hence we expect there may be 2 or 3 serendipitous detections in the group of positive and, more likely, tentative identifications with J–K. This is too small to affect the conclusions that we reach in the present study.
3.3 Galaxies as a probe of the interstellar extinction inside the LMC
We discovered a few galaxies, which are probably not related to the IRAS point sources. Since the galaxies are located behind the LMC, they could, in principle, be used as probes of the interstellar reddening through the LMC. If the J–K colour excess of mag is due to extinction by dust inside of the LMC, a visual extinction of A mag is indicated; the extinction through the entire LMC would vary between A and A mag. This could have severe consequences for the observation of stars inside of the LMC. Although Oestreicher et al. (1995) showed the foreground reddening towards the LMC to be only A on average, stars inside the LMC could suffer from visual extinction of a few magnitudes.
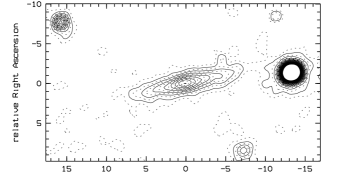
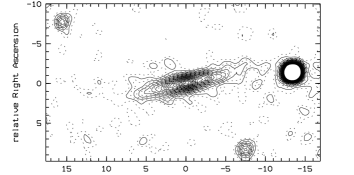
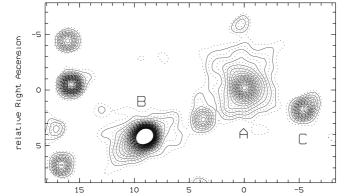
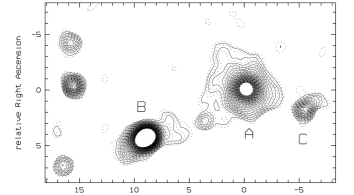
Are the measured colours of the galaxies intrinsic to them, or have they been severely affected by interstellar reddening through the LMC? The intrinsic colours of a galaxy depend on its kind. The magnitudes for the galaxies approximately represent the total integrated light. There is no sign of steep colour gradients, although the bulges or nuclei appear somewhat redder. LI–LMC1818d (Fig. 3) is a bright edge-on spiral galaxy. LI–LMC0603c (Fig. 4) is a face-on spiral galaxy (A) interacting with another galaxy (B), and possibly with a third galaxy (C). All other objects in the images of LI–LMC1818d and LI-LMC0603c are unresolved. LI–LMC1759d is probably a spiral galaxy seen under a small inclination angle, but its position close to the edge of the field severely degraded the quality of its image. LI–LMC1803b is small and barely resolved.
Normal galaxies are confined to a colour J–K 0.8—0.9 mag (e.g. Glass 1984; Silva 1996). Only LI–LMC1759d has a colour consistent with a normal galaxy. LI–LMC1818d may suffer from extinction by dust in its disk because of its edge-on orientation, but the red colour of the near-face-on LI–LMC0603c cannot be explained easily by extinction inside of a normal galaxy.
Galaxies with anomalous IR colours include emission line galaxies. Whitelock (1985b) presented NIR data on a sample of thirteen IRAS galaxies, probably H ii galaxies. Their mean J–K colour was 1.25 mag, with a standard deviation of only 0.13 mag. But the J–K colours of our reddened galaxies are still consistent with the reddest H ii galaxies, while both Seyfert 1 and 2 galaxies can reach J–K colours in excess of 2 mag (Glass & Moorwood 1985; Almudena et al. 1996; Kotilainen & Ward 1994). Active galaxies usually have strong colour differences between the nucleus and the rest of the galaxy, something which we do not see in our galaxies.
There is less doubt about the question whether our galaxies could be the counterparts of the IRAS sources in the field. The large distances between the galaxies and the IRAS positions and/or the presence of a NIR-redder point source in the field already suggest that the detection of the galaxies was a mere coincidence. Also, the mid-IR colours of galaxies detected by IRAS are different from those of our sources. The IRAS galaxies discussed by Whitelock (1985b) have IRAS colours typical of cold dust, with S60/S25 ratios . This would have lead to 60 m flux densities for our IRAS sources of —6 Jy, whereas the measurements indicate they can only be Jy at most. Whitelock’s galaxies have K magnitudes of —12 mag, which is considerably brighter than our galaxies, whereas their IRAS 25 m flux densities are comparable. Hence we cannot exclude the possibility that our reddened galaxies have mid-IR excess emission below the sensitivity of IRAS, but they are not the counterparts of the IRAS sources.
| LI–LMC | RA(2000) | Dec(2000) | R | B–R | remarks |
|---|---|---|---|---|---|
| 0603b | 05 12 04.5 | -70 33 14 | 18.86 0.04 | 3.4 0.9 | NIR-red star |
| 0603c | 05 12 05.4 | -70 32 04 | 17.50 0.02 | 2.30 0.12 | face-on NIR galaxy |
| 0603d | 05 11 51.5 | -70 33 32 | 15.45 0.02 | 5.06 0.17 | red star outside IRAC2 field |
| 0603e | 05 12 23.4 | -70 33 05 | 15.26 0.02 | 5.01 0.11 | red star outside IRAC2 field |
| 1818b | 06 02 11.8 | -72 26 41 | 19.49 0.06 | 3.7 1.5 | NIR-red star |
| 1818c | 06 02 14.5 | -72 27 43 | 19.62 0.08 | 2.7 0.4 | NIR-red star |
| 1818d | 06 02 12.8 | -72 27 36 | 17.77 0.03 | 2.44 0.24 | edge-on NIR galaxy |
| 1818e | 06 01 54.0 | -72 27 04 | 16.78 0.02 | 2.47 0.10 | galaxy outside IRAC2 field |
The B and R-band photometry for the red sources in the fields of LI–LMC0603 and LI–LMC1818 is presented in Table 2. The stars that we identified as the NIR counterparts of the IRAS point sources LI–LMC0603 and LI–LMC1818 were not detected down to mag in the R-band. The other NIR-red objects do indeed have optically red counterparts, both the stars and the galaxies. Moreover, we discovered two very red stars in the Dutch telescope field of LI–LMC0603c, and a red galaxy in the Dutch telescope field of LI–LMC1818d, all three which are outside the corresponding IRAC2 fields. The B–R colour of mag for the two red stars LI–LMC0603d and LI–LMC0603e implies severe inter- or circumstellar extinction (Whitelock et al. 1996). The red B–R colour of galaxy LI–LMC1818e is remarkably similar to that of the galaxy LI–LMC1818d. Active galaxies are often optically blue (Véron-Cetty & Véron 1996 adopt B–R = 0.57). They can be optically red, though, as is the case for IRAS galaxies (P. Véron, private communication; see also Duc et al. 1997).
We have taken the Lauberts-Valentijn ESO catalogue of galaxies (Lauberts & Valentijn 1989) to investigate the variation in galaxy B–R colours across the sky in the vicinity of the LMC. We had to sample in four square degree bins in order to obtain useful statistics. We identified a region of 64 square degrees centred at Right Ascension and Declination, that was relatively well populated (148 galaxies), and that appeared to be representative for the colours of galaxies unaffected by extinction through the Magellanic Clouds system. This region yielded a mean B–R mag, with minimum and maximum B–R of 0.70 and 1.38 mag respectively. We can compare this to the bins containing our galaxies LI–LMC0603c and LI–LMC1818d. Each of these bins contained one galaxy from the above mentioned catalogue. Although this is statistically very poor, it is interesting to note that the galaxy near LI–LMC0603c has B–R = 1.74 mag, and the galaxy near LI–LMC1818d has B–R = 1.44 mag, both considerably redder than the estimated typical colour. Comparing the B–R colours of the galaxies LI–LMC0603c and LI–LMC1818d with the canonical value of B–R, we arrive at extinctions of mag.
If we compare the positions of our galaxies with the dust column density maps by Schwering (1989), we notice that the dust distribution in the LMC is rather patchy as compared to the SMC. Two of our reddened galaxies are situated at the East side. Although they lie outside of the area covered by the dust map, it is at the East side that there appears to be a massive dust complex. Some of the serendipitously discovered red stars may thus be normal stars, situated behind a local, but large amount of dust in the LMC. Alternatively, they may be the nuclei of normal galaxies as seen through the LMC. In that case, the dust causing the reddening of the galaxy colours may be situated behind the main body of the LMC, leaving the colours of the stars in the LMC unaffected.
The colours and morphologies of the galaxies, the fact that we detect only a few galaxies of which most are red, and the presence of other red objects in their projected vicinities all provide circumstantial evidence for severe interstellar extinction inside or behind the LMC. However, it is based on very little data, and should be confirmed by the systematic study of the colours of galaxies seen through the LMC.
4 The nature of the IRAS counterparts


In this section, we classify the IRAS counterparts as mass-losing AGB stars that are oxygen rich (O), carbon rich (C), or that are not distinguishable between oxygen stars and carbon stars (OC). We argue that some of the stars may be post-AGB or thermal pulse stars (post/TP). The arguments used in classifying the stars are explained below, and the results are tabulated in Table 4.
4.1 Chemical classification from colours and magnitudes
4.1.1 Galactic comparison sample
In paper II we show how in a K–[12] versus H–K diagram carbon stars are distinguished from oxygen stars. A similar diagram can be made using J–K. In Fig. 5 we present the K–[12] versus J–K diagnostic diagram, for the carbon stars (Fig. 5a) and the oxygen stars (Fig. 5b) from the Galactic sample described in paper II. It is clear that in the Milky Way the K–[12] versus J–K diagram can also be used to separate carbon stars from oxygen stars. The Galactic carbon star sequence (dotted straight line) is described by the empirical relation
| (2) |
The Galactic oxygen star sequence (solid curved line) approximately satisfies an infinite series of the form
| (3) |
There is a hint a secondary sequence of oxygen stars, indicated by the dashed line in Fig. 5b. Later we discuss the stars at this side of the principal sequence in the K–[12] versus J–K diagram in more detail. From now, we assume that there be no substantial differences between the K–[12] versus J–K diagrams for mass-losing AGB stars in the Milky Way and in the LMC.
4.1.2 LMC sample


The K–[12] versus J–K diagram for the stars of the present sample in the direction of the LMC is given in Fig. 6, together with a diagram of the K-band magnitudes versus J–K. The sequences we have drawn in the latter diagram are estimated from the positions of AGB stars and red supergiants in the LMC as compiled by Loup & Groenewegen (1994). LMC red supergiants and foreground stars are predominantly occupying a linear sequence, approximated in Fig. 6a by:
| (4) |
Mass-losing AGB stars in the LMC follow the curved sequence towards red J–K colours, approximated in Fig. 6a:
| (5) |
Using the K–[12] versus J–K diagram, we can classify several stars as being mass-losing AGB stars either on the oxygen star sequence (solid), or on the carbon star sequence (dotted), with the carbon stars to be found exclusively amongst the optically thickest sources. But there are several stars that have too large a 12 m excess for their J–K colour, or alternatively are too blue in J–K for their 12 m excess to be on the AGB. Of these, LI–LMC1821 is far too bright in the K-band to be an AGB star in the LMC, and it is probably a foreground star. Another peculiar source is LI–LMC0530, which lies on the Loup & Groenewegen (1994) sequence at a blue J–K colour. We will come back to this source later. The remaining six outliers are all faint in the K-band, and five of them are redder than J–K. Up to three of the stars with lower limits to their J–K colours might be similar to the group of six outliers as well. The field stars are distributed over a larger range of K-band magnitudes, and like the galaxies they are all bluer than J–K. This suggests that the outliers and the field stars are of different nature.
Another way of separating AGB carbon stars from AGB oxygen stars is the J–K versus [12]–[25] colour–colour diagram. For this purpose, we have estimated the carbon star and oxygen star sequences from Le Bertre (1993) and Le Sidaner & Le Bertre (1994). The average carbon star sequence may be approximated by:
| (6) |
The average oxygen star sequence may be approximated by:
| (7) |
The J–K versus [12]–[25] diagram for the stars of our sample is given in Fig. 7, together with diagrams of the K–[12] colours and the 12 m magnitudes versus [12]–[25]. For the errors on the IRAS flux densities we have adopted formal values of 1 Jy. The J–K versus [12]–[25] diagram does not work well for our sample mainly because the lower limits to the J–K colours of several stars allow these stars to lie either on the oxygen star sequence (solid), or on the carbon star sequence (dotted). The outliers of the K–[12] versus J–K diagram have relatively blue J–K colours. Alternatively they may be characterised by relatively cool dust envelopes because of their relatively red [12]–[25] colours. From the [12] versus [12]–[25] diagram it appears that the IRAS sources for which no counterpart was found (triangles) may have cooler dust envelopes and/or may experience less severe mass loss, but these indications are very marginal (see also paper II). We also note that if the counterpart would not have been particularly red or bright as compared to the other stars in the field, we may have failed to recognise the counterpart as such. This may be the case for PNe, which can have blue J–K colours between 0 and 0.5 mag due to strong He i line emission at 1.083 m (Whitelock 1985a).
4.2 Post-AGB star candidates
It is interesting to compare the identified NIR counterparts of the IRAS sources as found in the present study, with the sample from van der Veen et al. (1989: VHG-89). The latter sample consists of a compilation of Galactic objects thought to be in the transition from the AGB to the planetary nebula phase. Their distances and absolute magnitudes are not known, so that we can use this sample in the colour–colour diagrams but not in the colour–magnitude diagrams.

The J–K, K–[12], and [12]–[25] colours are plotted versus each other in Fig. 8 (circles for the present sample, and dots for the VHG-89 sample). The VHG-89 stars have cool dust envelopes, and have larger 12 m excesses for their J–K colours than would be reconcilable with mass-losing AGB stars. The six outliers of the present sample roughly overlap with the VHG-89 sample. We classify the six outliers therefore tentatively as post-AGB stars. They would be related to the VHG-89 post-AGB stars with relatively warm dust envelopes, and either have relatively large 12 m excesses or be optically thick in the K-band. We cannot exclude that one or more of the LMC post-AGB star candidates are actually AGB stars that have recently experienced a thermal pulse (see section Discussion).
4.3 The stellar counterpart of LI–LMC1821
| B | V | R | i | J | K | (Jy) | (Jy) |
|---|---|---|---|---|---|---|---|
| 11.75 0.15 | 10.27 0.06 | 9.04 0.04 | 7.52 0.05 | 6.9 | 6.4 | 0.44 | 0.33 |
The IRAS point source LI–LMC1821 is identified with a bright NIR star. Our BVRi photometry is presented together with the NIR and IRAS photometry in Table 3. The B–V and V–i colours indicate a non-reddened, early-M type spectrum (Iyengar & Parthasarathy 1997). We plot the spectral energy distribution in Fig. 9 (squares), together with an arbitrarily scaled 3000 K blackbody. We also plotted mean fluxes of the M0 (open circles) and M5 (solid circles) giant from Fluks et al. (1994), scaled to a distance of 1.5 kpc. LI–LMC1821 may be a late-K or early-M giant at a similar distance, and a member of the Galactic halo or thick disk population (Robin et al. 1996). Alternatively, it may be a very luminous red supergiant in the LMC, with a bolometric luminosity of M mag. The small IR excess indicates a thin CSE as a result of modest mass loss. The IRAS colours are consistent with a detached CSE (van der Veen & Habing 1988), so that it may be a Galactic post-AGB star, but as the source is not detected at 60 m this is not conclusive. It is surprising that it has not been listed in any stellar catalogue or survey, despite that it is bright at optical wavelengths. It would be interesting to obtain a radial velocity measurement discriminating between membership of the LMC or the Milky Way.
5 Bolometric luminosities

We calculate bolometric luminosities for the stars that we identified as the NIR counterparts of the IRAS point sources. The method for estimating the unobserved part of the spectral energy distribution is based on the average NIR colours for obscured AGB stars, and will be described in a forthcoming paper. The method for obtaining the integrated luminosity under the spectral energy distribution is described in paper II and originally in Whitelock et al. (1994). We adopted a distance modulus to the LMC of (m–M) (Feast & Walker 1987). The results are tabulated in Table 4.
The cumulative luminosity distributions of the different classes of stars are presented in Fig. 10a. In principle we could derive the luminosity distribution by differentiation of the cumulative distribution function. In practice the errors would be huge because of the small number of stars. Instead, we apply Gaussian broadening by replacing each star with absolute bolometric magnitude Mbol,⋆ by
| (8) |
where n to normalise to unity per star. The FWHM of the star has thereby become 0.83 magnitude. Then we take the sum of the luminosity-broadened stars. A scientific motivation for applying the broadening to mass-losing AGB stars is that they are LPVs with bolometric amplitudes of about one magnitude but only observed at a single NIR epoch. The luminosity distributions are presented in Fig. 10b (line types are the same as in Fig. 10a). They represent the distribution over luminosity of the IRAS-detected AGB stars in the LMC, and they are likely to be incomplete, especially at the faint end. We assume that this does not seriously affect the relative distributions of the carbon and oxygen stars. The ratio of the number of carbon stars over the number of oxygen stars as a function of luminosity is derived by dividing the luminosity distribution function of the carbon stars by that of the oxygen stars (Fig. 10c). We have done this for the two extreme cases that all OC stars be carbon stars (dotted) or that all OC stars be oxygen stars (solid). The real luminosity relation of the fraction of carbon stars lies in between these two extremes.
| LI–LMC | Mbol | O | OC | C | post/TP |
|---|---|---|---|---|---|
| 0099 | –5.42 | ||||
| 0109 | –6.28 | ||||
| 0136 | –4.95 | ||||
| 0180 | –5.01 | ||||
| 0297 | –6.36 | ||||
| 0326 | –5.27 | ||||
| 0344 | –5.82 | ||||
| 0530 | –5.55 | ||||
| 0603 | –5.65 | ||||
| 0777 | –4.99 | ||||
| 0782 | –5.50 | ||||
| 1092 | –5.57 | ||||
| 1198 | –5.30 | ||||
| 1316 | –4.83 | ||||
| 1624 | –4.82 | ||||
| 1721 | –5.27 | ||||
| 1803 | –5.13 | ||||
| 1813 | –5.78 | ||||
| 1817 | –6.12 | ||||
| 1818 | –5.89 |
6 Discussion
6.1 AGB stars

The AGB stars that we (re-)discovered have thick CSEs according to their large J–K and K–[12] colours. Le Sidaner & Le Bertre (1996) derive an empirical relation between the continuumline optical depth of an oxygen-rich CSE at 10 m and its J–K colour:
| (9) |
Apart from the foreground star LI–LMC1821 and the object LI–LMC0530, the positive identifications between NIR and IRAS sources have J–K between 2.22 and more than 7.7 mag, indicating optical depths at 10 m in the range 0.6—5 or more. All serendipitous detections have J–K2 mag, indicating small optical depths. Because we could not detect all stars in the J-band, the K–[12] colour is a better tool for studying the optical depth of the obscured AGB stars. Le Sidaner & Le Bertre (1996) derive an empirical relation between the optical depth of the CSE at 10 m and the K–[12] colour:
| (10) |
Our obscured AGB stars would have optical depths between 0.6 and 45. Post-AGB stars would not satisfy both the J–K and K–[12] relations for the optical depth, as these two relations define a path in the K–[12] versus J–K diagram, that is unique to the obscured AGB stars:
| (11) |
It is clear from Fig. 11 that Le Sidaner & Le Bertre give a sequence for oxygen-rich obscured AGB stars which is reasonably consistent with our oxygen star sequence. We note that they corrected the IRAS 12 m fluxes for the spectral slope, assuming blackbody temperatures between 300—2000 K. The colour correction factor then ranges between about 0.92 and 1.38 respectively. This makes their K–[12] colours change by mag in the case of a 300 K blackbody, and 0.35 mag in the case of a 2000 K blackbody. As the stars with thick CSEs generally have the lower blackbody temperatures, the difference between the Le Sidaner & Le Bertre track and our oxygen star sequence in the K–[12] versus J–K diagram would only be appreciable at the smallest J–K, and only a few tenths of a magnitude at most.
The most luminous star in our sample has a bolometric magnitude M mag, a factor of two fainter than the theoretical AGB limit as derived from the Chandrasekhar limit for the core mass and the core mass-luminosity relation from Paczyński (1971). The mass-losing AGB star sample of paper II spanned the luminosity range between M and mag. Our new sample consists of fainter stars on average, but with M mag our faintest star is not fainter than those of paper II.
Carbon stars are more numerous at fainter luminosities relative to oxygen stars. The two brightest stars have oxygen rich CSEs, but the brightest carbon star, with M mag, is not much fainter than these two oxygen stars. On the other hand, the faintest star is a carbon star, but the faintest oxygen star has the same M mag. Hence we conclude that we do not detect a luminosity regime in which the mass-losing AGB stars are exclusively either carbon stars or oxygen stars.

This could mean that luminous AGB stars are prevented from becoming carbon stars, starting from luminosities as low as M mag. Hot Bottom Burning (HBB) may be responsible for this, as the inner boundary of the convective mantles of the more massive AGB stars becomes sufficiently hot for CN processing to occur (Sugimoto 1971; Iben 1975; Scalo et al. 1975). The co-existence of oxygen and carbon stars over a large range of luminosity may be explained as a consequence of a spread in metallicity. Mass-losing oxygen stars would be metal poor and experience HBB at M mag, whereas mass-losing carbon stars would be more metal rich and not experience HBB at M mag. A thorough discussion of the luminosity distribution function and mass-loss rates of the mass-losing AGB stars in the LMC is postponed to the next paper in this series, in combination with the sample of paper II.
6.2 Future searches for mass-losing AGB stars
We have been successful in detecting NIR counterparts in approximately two out of every three cases. Of these, approximately two out of every three cases turned out to be mass-losing AGB stars. Of these, approximately one out of every two cases was too faint to be detected in the J-band. Would it still be worthwhile to search for NIR counterparts of the remaining 37 IRAS sources? Current attempts to find NIR counterparts may in some cases already be limited by the ground-based NIR searches rather than by the IRAS mid-infrared detections. The ISO mission is expected to yield an extensive data base of new mid-infrared point sources. If ISO will detect bolometrically fainter stars exhibiting similar mass-loss rates to those of the obscured stars which are IRAS counterparts, then it will be difficult or impossible to detect their NIR counterparts with presently available ground-based instruments. However, if it turns out that (nearly) all of the new ISO detections have NIR counterparts, it will demonstrate that bolometrically fainter stars exhibit lower mass-loss rates.
6.3 Post-AGB stars
To investigate further the nature of the suspected post-AGB candidates in our sample, we have taken a closer look at the VHG-89 sample. They classify their post-AGB candidates into classes i, ii, iii, iva, and ivb, based on the shape of the infrared spectral energy distribution. The higher the class, the more evolved the post-AGB object: class i is characterised by warm dust completely obscuring the underlying cool star, while in later classes the dust shell becomes detached, exposing the underlying, increasingly hotter star. They also argued that classes i and ii result from more massive stars than the later classes. For each class of stars in the VHG-89 sample we have calculated the mean and standard deviation of the J–K, K–[12], and [12]–[25] colours. We drew boxes in the colour–colour diagrams, centred at the mean colours and having sides measuring two times the standard deviations of the colours. In this way we obtain a schematic picture of the positions of the VHG-89 classes in the colour–colour diagrams (Fig. 12). Indeed, the dust becomes cooler (larger [12]–[25] colour) and optically thinner (smaller J–K) with increasing class. The early classes with obscured stars generally have larger K–[12] and/or larger J–K than do the optically visible stars from class iv.
The LMC post-AGB star candidates could be identified with the VHG-89 classes ii and iii. The dust of the LMC stars may be warmer than that of similar stars in the Milky Way if the dust-to-gas ratio in CSEs of LMC stars is smaller, permitting stellar radiation to permeate farther out into the CSE, thus heating the dust to higher temperatures. Also the water abundance may be smaller in the LMC, causing the oxygen-rich CSEs to cool less efficiently. Similarly, lower CO and/or HCN abundances may cause warmer carbon-rich CSEs. This would result in somewhat smaller [12]–[25] in the LMC than in the Milky Way. The colours of the LMC post-AGB star candidates are indeed similar to the VHG-89 stars with relatively warm dust. The LMC post-AGB star candidates may have slightly smaller J–K colours because their CSEs are optically thinner due to the lower dust-to-gas ratio, but this could also be explained by selection effects: three of our newly identified IR stars with large K–[12] colours have lower limits to their J–K colours that would still permit them to be post-AGB candidates. On the other hand, the VHG-89 sample is constructed with a blue cut-off at [12]–[25] = 2 mag, selecting against the bluemost sources.

We compared the luminosities of the LMC post-AGB star candidates to those of the five R Coronae Borealis (RCB) stars known in the LMC (Alcock et al. 1996), which are also believed to be post-AGB stars, and to the luminosities of PNe in the LMC. The latter we took from Dopita & Meatheringham (1991), Zijlstra et al. (1994), and Dopita et al. (1997). For some of these PNe we know whether they result from an oxygen- or carbon-rich AGB star. The luminosity distributions are presented in Fig. 13. We note that we do not have complete samples of any of the type of objects shown. The distributions of the post-AGB star candidates are only shown down to M mag, since this is approximately the detection limit of the combined IRAS-IRAC2b search. The distributions of the post-AGB stars, RCB stars, and PNe are very similar, all dropping steeply from M to M mag. In fact, the only object more luminous than M mag is the unusual PN SMP-83 (Dopita et al. 1993).
The PNe for which the C/O ratio is known can be used to derive the distributions of the oxygen- and carbon-rich PNe in the LMC, and their ratio (Fig. 13c). From this we conclude that the chemical composition of the PNe is consistent with the chemical composition of the present small sample of new mass-losing AGB stars.
We note that some of the PNe and two of the RCB stars in the LMC have been detected by IRAS at 12 m at a level of 0.1—0.2 Jy (Zijlstra et al. 1994; Moshir et al. 1992; Alcock et al. 1996), indicating that objects are capable of maintaining their 12 m flux after they have left the AGB. Hence the fact that the LMC post-AGB star candidates are detected at 12 m by IRAS does not necessarily imply their post-AGB age. Zijlstra et al. note that the IRAS detected LMC PNe have blue [12]–[25] colours, relative to Galactic PNe. They attribute this to selection effects. The LMC post-AGB star candidates also have blue [12]–[25] colours, relative to Galactic post-AGB star candidates. NIR-optical spectroscopy for the faint, obscured LMC post-AGB star candidates is difficult, but may be possible. If they are indeed post-AGB stars, their spectra are expected to be of intermediate type (A, F, G). However, this would not exclude the possibility that they are binary systems (e.g. Whitelock et al. 1995).
If we assume that, down to a certain lower bolometric luminosity limit we are equally incomplete for the currently available samples of mass-losing AGB stars (combining paper II with this paper), post-AGB stars, and PNe then we can, in principle, estimate their relative lifetimes. It is more difficult to do this compared to the AGB stars that have not been detected by IRAS, because many of them will still evolve significantly in bolometric luminosity. Comparing bolometric luminosity limited samples of IRAS detected and non-detected AGB stars therefore results in comparing different populations of stars, with different main-sequence masses. A synthetic evolution approach is needed to infer the AGB lifetimes for stars of different main-sequence masses (Groenewegen & de Jong 1994). The known PNe have been selected in a different way than the post-AGB and mass-losing AGB stars, because of the different observational properties of these objects. Hence it is not obvious that the currently known sample of PNe is equally incomplete as the currently known samples of post-AGB and mass-losing AGB stars. Amongst the IRAS point sources that remain to be searched for NIR counterparts, there may be a significant number of post-AGB and/or mass-losing AGB stars, in perhaps different relative numbers than those presently observed. There may also be none. Amongst the IRAS point sources that we could not identify with a NIR counterpart, there may be optically visible post-AGB stars, or not. The most we can say is that the currently available data suggest that the mass-losing AGB, post-AGB, and PN stages all have similar lifetimes, for a star with an AGB-tip bolometric luminosities between M and mag, i.e. that has a progenitor mass in the range 2.5–4 M⊙ (Vassiliadis & Wood 1993). More massive stars seem to have post-AGB and PN lifetimes that are considerably shorter than their mass-losing AGB lifetimes.
6.4 Thermal Pulse stars

The suspected secondary sequence in the K–[12] versus J–K diagram for Galactic oxygen stars does have some overlap with the VHG-89 stars, but the latter are mostly found having larger K–[12]. This can be partly due to larger optical depths of the CSEs of the VHG-89 stars, to the extent that the CSE becomes optically thick in the K-band, but it cannot explain the position of the VHG-89 class iv at small J–K. Probably the VHG-89 stars have more massive CSEs, yielding a larger 12 m flux, but these CSEs are detached, yielding small column densities towards the star and hence small J–K. Consequently, stars at the secondary sequence are not expected to evolve directly into stars with larger K–[12]. If the stars from VHG-89 are post-AGB stars, then they are expected to have evolved from large J–K and K–[12], first getting smaller J–K before also getting smaller K–[12]. Hence the secondary sequence may be related to the VHG-89 class i only. The fact that we noticed a secondary sequence, rather than a gradient from the primary sequence into the VHG-89 areas of the K–[12] versus J–K diagram, suggests that the secondary sequence and perhaps the VHG-89 class i are not related to the VHG-89 post-AGB classes ii—iv. We can explain them instead as stars that only temporarily stopped losing mass, possibly as a result of a thermal pulse (TP). They are then expected to return to the AGB and resume heavy mass loss (Zijlstra et al. 1992).
It is difficult to discern a TP star from a post-AGB star, since both experience the same phenomenon: the CSE becomes detached. But at least statistically there are differences to be expected, that can be observed in the near- and mid-IR: the K–[12] is expected to be statistically larger for a post-AGB star than for a TP star. There are three reasons for this. First, post-AGB stars shrink while maintaining the same bolometric luminosity, and therefore they must increase in effective temperature. This results in increased heating of the CSE, counteracting at least partly the cooling of the CSE as a result of its increasing distance to the star. TP stars do not change as much in effective temperature, and hence the detaching CSE of a TP star cools more rapidly than that of a post-AGB star. Second, as the effective temperature increases but not the bolometric luminosity, the star will become fainter in the K-band, increasing its K–[12] colour. Although TP stars may have decreased in bolometric luminosity, this is expected to be at most one magnitude (Vassiliadis & Wood 1993). Third, post-AGB stars are more evolved than TP stars. They have experienced mass loss for a longer time span, yielding more massive CSEs and consequently larger 12 m fluxes.
LI–LMC0530 has too small a [12]–[25] colour for its K–[12] colour to be a normal post-AGB star candidate, relative to both the VHG-89 stars and the six LMC post-AGB star candidates discussed above. It is also much brighter in the K-band than the other LMC post-AGB star candidates, which suggests an optically thin CSE. Whitelock et al. (1995) found two stars in the South Galactic Cap that they explained as TP stars, because of their lack of variability. These two stars have J–K and [12]–[25] colours similar to those of LI–LMC0530, but their K–[12] colours are much smaller than that of LI–LMC0530, and even smaller than the secondary sequence in the K–[12] versus J–K diagram. In fact these Galactic TP star candidates are more similar to normal mass-losing AGB stars. This can be understood if they experienced one of their first TPs, before they had built up a massive CSE that yields a significant 12 m excess. LI–LMC0530 seems to take an intermediate position between post-AGB stars and TP stars.
LI–LMC0530 is identified with the LPV SHV0510004–692755: an LPV with an I-band amplitude of 1.24 mag and a period of 169 days. Hughes & Wood (1990) give a spectral type of M6. It obeys the period-luminosity relation for the K-band magnitude perfectly, although bolometrically it is 4—5 times more luminous than the AGB stars that define the period-luminosity relation (Reid et al. 1995). LI–LMC0530 must have been a mass-losing AGB star in the past, because it has a large 12 m excess. It may now be pulsating in a (high) overtone, and maybe it will resume Mira variability and mass loss. If it is a post-AGB star at present, then it must be in a very early post-AGB stage, because its effective temperature has not increased much. But in this case we would expect the star to be obscured by an optically thick CSE. This contradicts its small J–K, unless we invoke a highly aspherical shape of the CSE. We conclude that the nature of LI–LMC0530 is uncertain: it may be an early post-AGB star of class iv, or a star recovering from the effects of one of its last thermal pulses on the AGB. Alternatively, the measured flux at wavelengths shorter than m may have been affected by the presence of another star in the line-of-sight.
7 Summary
Our search for NIR counterparts of IRAS point sources in the direction of the LMC was aimed at finding obscured AGB stars in the LMC: we found 13 of them. The K–[12] versus J–K diagram is shown to be well suited for discriminating between mass-losing oxygen and carbon stars. Comparison between the luminosity distributions of the oxygen and carbon stars suggests that the fraction of carbon stars is smaller at bolometric luminosities around M mag than around M mag. Oxygen and carbon stars co-exist at all luminosities, but the new sample of obscured AGB stars does not include luminosities as bright as M mag. Analysis of the combined sample of known obscured AGB stars in the LMC will be presented in the next paper of this series.
Besides the obscured AGB stars, we found a probable Galactic halo star or very luminous LMC red supergiant. We also found 7 probable IRAS counterparts which have large J–K colours, but not as large as the obscured AGB stars. Comparison with a sample of post-AGB objects in the Milky Way as compiled by van der Veen et al. (1989) suggests that these NIR detections are likely to be post-AGB stars, with luminosities around M mag. We investigated the possibility that they are AGB stars recovering from the occurrence of a thermal pulse. Although this cannot be ruled out completely, we found it difficult to reconcile their NIR and IRAS colours with those of stars in the Milky Way that are suspected to experience this short evolutionary phase.
We also detected several objects with J–K colours larger than for normal stars, but not as large as the IRAS counterparts. They are not related to the IRAS source in the field. Although two of them are identified with known LPVs in the LMC, the remaining few stars may be LMC stars that are reddened by interstellar extinction inside the LMC. This suggestion is supported by the serendipitous detection of a few galaxies with larger J–K colours than normal galaxies, indicating reddening by the LMC corresponding to a visual extinction of a few mag. This would have severe consequences for the study of stars inside the LMC, that are often assumed not to suffer significant interstellar extinction.
Acknowledgements.
We would like to thank Drs. Montserrat Villar-Martín, Rene Mendez, Christopher Lidman, Martin Groenewegen, and Pierre-Alain Duc for discussion on various aspects of our research. We thank the referee Dr. Jeremy Mould for his comments which helped improving the paper. We acknowledge the allocation of Director’s Discretionary Time at the Dutch telescope at ESO/La Silla. We made use of the SIMBAD database, operated at CDS, Strasbourg, France. Jacco queria expresar sus mejores gracias a Montse por haberle contestado si a una pregunta bien profunda.References
- [1996] Alcock C., The MACHO Collaboration, 1996, ApJ 470, 583
- [1996] Almudena A.-H., Ward M.J., Kotilainen J.K., 1996, MNRAS 278, 902
- [1992] Bell R.A., 1992, MNRAS 257, 423
- [1980] Blanco V.M., McCarthy M.F., Blanco B.M., 1980, ApJ 242, 938
- [1990] Carter B.S., 1990, MNRAS 242, 1
- [1981] Cohen J.G., Frogel J.A., Persson S.E., Elias J.H., 1981, ApJ 249, 481
- [1991] Dopita M.A., Meatheringham S.J., 1991, ApJ 367, 115
- [1993] Dopita M.A., Ford H.C., Bohlin R.C., Evans I.R., Meatheringham S.J., 1993, ApJ 418, 804
- [1997] Dopita M.A., Vassiliadis E., Wood P.R., Meatheringham S.J., Harrington J.P., Bohlin R.C., Ford H.C., Stecher T.P., Maran S.P., 1997, ApJ 474, 188
- [1997] Duc P.-A., Mirabel I.F., Maza J., 1997, A&AS (in press)
- [1987] Feast M.W., Walker A.R., 1987, ARA&A 25, 345
- [1989] Feast M.W., Glass I.S., Whitelock P.A., Catchpole R.M., 1989, MNRAS 241, 3751
- [1994] Fluks M.A., Plez B., Thé P.S., de Winter D., Westerlund B.E., Steenman H.C., 1994, A&AS 105, 311
- [1984] Glass I.S., 1984, MNRAS 211, 461
- [1985] Glass I.S., Moorwood A.F.M., 1985, MNRAS 214, 429
- [1994] Groenewegen M.A.T., de Jong T., 1994, A&A 283, 463
- [1993] Guglielmo F., Epchtein N., Le Bertre T., Fouqué P., Hron J., Kerschbaum F., Lépine J.R.D., 1993, A&AS 99, 31
- [1990] Hughes S.M.G., Wood P.R., 1990, AJ 99, 784
- [1975] Iben I., 1975, ApJ 196, 525
- [1981] Iben I., 1981, ApJ 246, 278
- [1988] Joint IRAS Science Working Group, 1988. Beichman C.A., Neugebauer G., Habing H.J., Clegg P.E., Chester T.J. (eds.)Infrared Astronomical Satellite, Catalogs and Atlasses, Explanatory Supplement.
- [1997] Iyengar K.V.K., Parthasarathy M., 1997, A&AS 121, 45
- [1994] Kotilainen J.K., Ward M.J., 1994, MNRAS 266, 953
- [1992] Landolt A.U., 1992, AJ 104, 340
- [1989] Lauberts E., Valentijn E.A., 1989, The Surface Photometry Catalogue of the ESO-Uppsala Galaxies. ESO
- [1993] Le Bertre T., 1993, A&AS 97, 729
- [1994] Le Sidaner P., Le Bertre T., 1994, Ap&SS 217, 145
- [1996] Le Sidaner P., Le Bertre T., 1996, A&A 314, 896
- [1995] Lidman C., 1995, IRAC-2b Report on Test Observations III. ESO internal report
- [1994] Loup C., Groenewegen M.A.T., 1994, Ap&SS 217, 131
- [1997] Loup C., Zijlstra A.A., Waters L.B.F.M., Groenewegen M.A.T., 1997, A&AS (paper I, in press)
- [1992] Moshir M., et al., 1992, Explanatory Supplement to the IRAS Faint Source Survey. edition. JPL, Pasadena
- [1995] Oestreicher M.O., Gochermann J., Schmidt-Kaler T., 1995, A&AS 112, 495
- [1971] Paczyński B., 1971, Acta Astron. 21, 417
- [1984] Pottasch S.R., 1984, Planetary Nebulae. Reidel, Dordrecht, p. 35
- [1991] Reid I.N., 1991, ApJ 382, 143
- [1995] Reid I.N., Hughes S.M.G., Glass I.S., 1995, MNRAS 275, 331
- [1996] Robin A.C., Haywood M., Crézé M., Ojha D.K., Bienaymé O., 1996, A&A 305, 125
- [1975] Scalo J.M., Despain K.H., Ulrich R.K., 1975, ApJ 196, 805
- [1989] Schwering P.B.W., 1989, A&AS 79, 105
- [1989] Schwering P.B.W., Israel F.P., 1989, A&AS 79, 79
- [1990] Schwering P.B.W., Israel F.P., 1990, A catalog of IRAS sources in the Magellanic Clouds. Kluwer, Dordrecht
- [1996] Silva D.R., 1996. In: Minniti D., Rix H.-W. (eds.) Spiral Galaxies in the Near-IR. Springer, Berlin, p. 3
- [1971] Sugimoto D., 1971, Prog. Theor. Phys. 45, 761
- [1988] Van der Veen W.E.C.J., Habing H.J., 1988, A&A 194, 125
- [1989] Van der Veen W.E.C.J., Habing H.J., Geballe T.R., 1989, A&A 226, 108 (VHG-89)
- [1993] Vassiliadis E., Wood P.R., 1993, ApJ 413, 641
- [1996] Véron-Cetty M.-P., Véron P., 1996. A Catalogue of Quasars and Active Nuclei. edition. ESO
- [1981] Westerlund B.E., Olander N., Hedin B., 1981, A&AS 43, 267
- [1985a] Whitelock P.A., 1985a, MNRAS 213, 59
- [1985b] Whitelock P.A., 1985b, MNRAS 213, Short Communication 51p
- [1994] Whitelock P.A., Menzies J.W., Feast M.W., Marang F., Carter B.S., Roberts G., Catchpole R.M., Chapman J.M., 1994, MNRAS 267, 711
- [1995] Whitelock P.A., Menzies J.W., Feast M.W., Catchpole R.M., Marang F., Carter B.S., 1995, MNRAS 276, 219
- [1996] Whitelock P.A., Irwin M., Catchpole R.M., 1996, New Astronomy 1, 57
- [1992] Wood P.R., Whiteoak J.B., Hughes S.M.G., Bessell M.S., Gardner F.F., Hyland A.R., 1992, ApJ 397, 552
- [1992] Zijlstra A.A., Loup C., Waters L.B.F.M., de Jong T., 1992, A&A 265, L5
- [1994] Zijlstra A.A., van Hoof P.A.M., Chapman J.M., Loup C., 1994, A&A 290, 228
- [1995] Zijlstra A.A., Loup C., Waters L.B.F.M., Whitelock P.A., van Loon J.Th., Guglielmo F., 1996, MNRAS 279, 32 (paper II)