[
Evidence of short time dynamical correlations in simple liquids.
Abstract
We report a molecular dynamics (MD) study of the collective dynamics of a simple monatomic liquid -interacting through a two body potential that mimics that of lithium- across the liquid-glass transition. In the glassy phase we find evidences of a fast relaxation process similar to that recently found in Lennard-Jones glasses. The origin of this process is ascribed to the topological disorder, i.e. to the dephasing of the different momentum Fourier components of the actual normal modes of vibration of the disordered structure. More important, we find that the fast relaxation persists in the liquid phase with almost no temperature dependence of its characteristic parameters (strength and relaxation time). We conclude, therefore, that in the liquid phase well above the melting point, at variance with the usual assumption of un-correlated binary collisions, the short time particles motion is strongly correlated and can be described via a normal mode expansion of the atomic dynamics.
pacs:
PACS numbers: 63.50.+x, 64.70.Pf, 61.43.Fs, 62.60.+v]
I INTRODUCTION
Many experimental investigations by Inelastic Neutron (INS) and X-ray (IXS) Scattering techniques, as well as different theoretical and numerical studies have been devoted since more than twenty years to the understanding of the collective dynamics of simple liquids. In particular, the efforts have been focused on those dynamical ranges that go beyond the two limiting cases of single particle (high exchanged momentum, ) and hydrodynamic (low ) regimes. The alkali metals are a typical class of systems considered as a workbench to test the different theoretical approaches developed so far for the dynamics of the liquid state. These systems are known to support well-defined oscillatory modes for the density fluctuations (acoustic-like modes) well outside the strict hydrodynamic region, down to wavelengths of a few inter-particle distances.
From the experimental point of view, it is worth mentioning the pioneering inelastic neutron scattering (INS) experiment by Copley and Rowe [1] in liquid rubidium, while more recently many experimental efforts have been performed aiming to realize more and more accurate experiments: INS investigations have been devoted to liquid cesium [2], sodium [3], lithium [4], potassium [5] and again rubidium [6]. Simultaneously many theoretical and numerical studies have also been reported on the same systems [7, 8, 9, 10, 11, 12, 13, 14]. Among others, one significant advantage of the numerical techniques with respect to INS is the possibility to overcome the experimental restriction, i. e. the limited () accessible region and the simultaneous presence of coherent and incoherent contributions to the INS signal. Moreover, numerical techniques allow to access a wider set of correlation functions while the inelastic scattering experiments basically probe the density-density correlation function.
More recently, the advent of Inelastic X-ray Scattering (IXS) technique [15, 16], opened new possibilities for the experimental determination of the dynamic structure factor in the nanometer wavevector region. In fact, the use of X-rays often allows to extend the accessible exchanged energy region to neutrons (an important merit especially in these systems characterized by a high value of the sound velocity), and to overcome the presence of the incoherent scattering when one is also interested in the collective motion. On the other hand, the resolution demand is particularly severe in this case, and the scattered intensity rapidly decreases on increasing the atomic number of the sample. This complementarity of IXS and INS allowed to improve the comprehension of the microscopic dynamics in alkali metals through a number of experiments performed in the last decade [17, 18, 19, 20, 21, 22, 23, 24].
A basic idea suggested by Molecular Dynamics (MD) simulations [25], and recently demonstrated by IXS in the case of lithium [20, 22], aluminum [23], and sodium [24], is the existence of two different time-scales which drive the viscous decay of the density fluctuations. These two time-scales are believed to reflect two different phenomena. The slower process (whose characteristic time spans from few picosecond to seconds depending on the temperature) is responsible for the highly correlated atomic motion. Its current understanding is provided by the Mode Coupling Theory (MCT) approach, which gives a satisfactory description of a large number of experimental and numerical results obtained in glass forming systems [26]. This process is usually referred to as the (structural) relaxation process. The faster process (characteristic time in the sub-picosecond time range) is less understood, and, in the normal liquid phase, is usually described by un-correlated binary collisions between particles [27].
Recently, theoretical (hard spheres) [28] and numerical (Lennard-Jones) [29] studies on the high frequency dynamics of model monatomic glasses have shown that, even in a harmonic glass, it exists a fast relaxation process. This process shows the typical phenomenology of relaxations, as the sound velocity increases with wavevector , in spite of the fact that all the diffusive degrees of freedom are frozen and the anharmonicity is absent. This findings point towards the association of this relaxation process to the topological disorder [29]: i. e. the dephasing of the different oscillatory components present in the dynamics of the density fluctuations at a given value gives rise to the decay of the correlation functions. If this interpretation is correct, this fast relaxation process should be a general property of disordered systems and, in particular, it must also exists in the liquid phase.
In this Paper, we investigate whether in a simple monatomic liquid it is possible to associate the fast relaxation process to the topological disorder and to improve our understanding of this phenomenon beyond the present belief based on (almost) un-correlated binary collisions. This study compares the dynamical properties of a monatomic system (lithium) in its liquid, supercooled, glassy and crystalline phases obtained by Molecular Dynamics (MD) simulations. The analysis of quantities such as the speed of sound, the acoustic attenuation, and the related relaxation times indicates the existence of the two-relaxation processes in all disordered phases. The slow process, whose relaxation time largely increases approaching the structural arrest (glass transition), effectively behaves as the relaxation. Most importantly, we find that the fast process is always present and its features do not change between the liquid and glass phases. This implies the importance of the topological disorder in this fast dynamics even in the liquid phase. Moreover, it also indicates that even at the short timescale considered the atomic motion is highly correlated and cannot be described by uncorrelated binary collisions.
II MOLECULAR DYNAMICS SIMULATION
We numerically investigated the molecular dynamics of 2000 lithium atoms interacting by the Price-Tosi pseudopotential. This interaction potential has been shown to accurately reproduce both the structural and the dynamical properties [8]. Lithium has been chosen due to the availability of high resolution experimental data on the dynamic structure factor in the liquid phase, which show the existence of the two relaxations processes [22].
The molecular dynamics simulations have been performed in the microcanonical ensamble, utilizing a Verlet algorithm with an integration time fs. The system has been equilibrated at several different temperatures, in a square box with periodic boundary conditions. To make closer contact with the IXS experiments, the numerical densities, i.e. the box dimensions, have been adjusted at each temperature to the experimental values [30], as far as the mass of each atom, chosen as the isotopic mixture corresponding to the natural abundance ( kg). The energy conservation, all over the explored temperature range, was better than few parts in .
The melting temperature of the selected inter-atomic interaction potential is K, in good agreement with the experimental melting point. Below this temperature, the ”MD liquid” can be supercooled avoiding the crystallization, and it attains the structural arrest at K, a value extrapolated from a power law fit of the calculated diffusion coefficient. This value of is consistent with that estimated from the depth of the effective interaction potential well, . In fact, using the relation , valid for the Lennard Jones potential [31], we derive for the Price pseudopotential K. Below it is no longer possible to equilibrate the system, but we can obtain the simulated ”lithium glass” by rapid quenching down to few Kelvin. Further heating of the system up to (but below that) allows to investigate the effect of the anharmonicity in the glassy configuration. We studied the system in the range from 5 K to 1100 K, a region much wider than that accessible in the real system. Indeed, the low and high limits cannot be reached experimentally because of the unavoidable crystallization below or of the high chemical reactivity of the hot liquid. At any of the selected temperatures (above ), we equilibrated the system for few hundreds picoseconds and then we stored the configurations, , in order to calculate the dynamic structure factor, defined as:
| (1) |
For the sake of simplicity, we turned around the calculation of the correlation by making use of the Wiener-Kintchine theorem, that simplify the computation of the dynamic structure factor as:
| (2) |
The numerical resolution , being the acquisition length, was set to ps-1, while the ’free spectral range’ (i.e. the accessible frequency window), where is the time separation of the stored configurations, was set to ps-1. Each at a fixed value was obtained as an average over different statistically independent runs (up to 52 for each temperature) and orientations in the simulation box.
III RESULTS
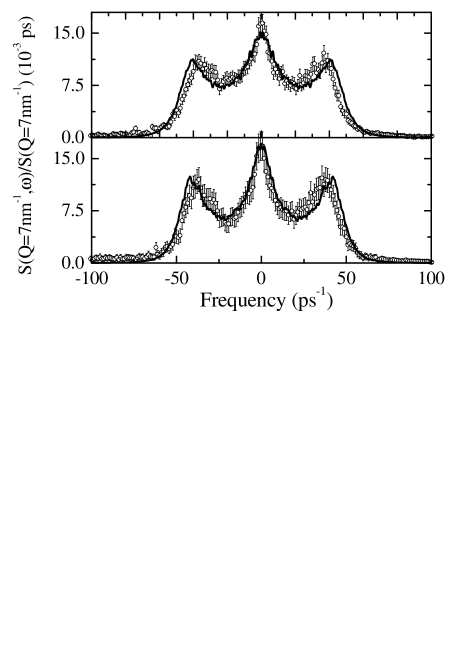
In Fig. 1, we report a comparison of the simulated dynamic structure factor at nm-1 with the corresponding experimental result for those temperatures where data are available (T=475 K and T=600 K).
]
The detailed balance factor has been removed from the experimental data through the relation
| (3) |
where the suffix c and q indicates the classical and quantum quantities, respectively.
The good agreement between the simulated and the experimental spectra testifies that the adopted potential represents well the lithium system ***The experimental resolutions of the reported spectra are slightly different for the experiment and simulation, in particular: ps-1 and nm-1 FWHM, while ps-1 and nm-1 FWHM. The energy broadening of the spectra for the considered -value is, however, always larger than any resolution effects..
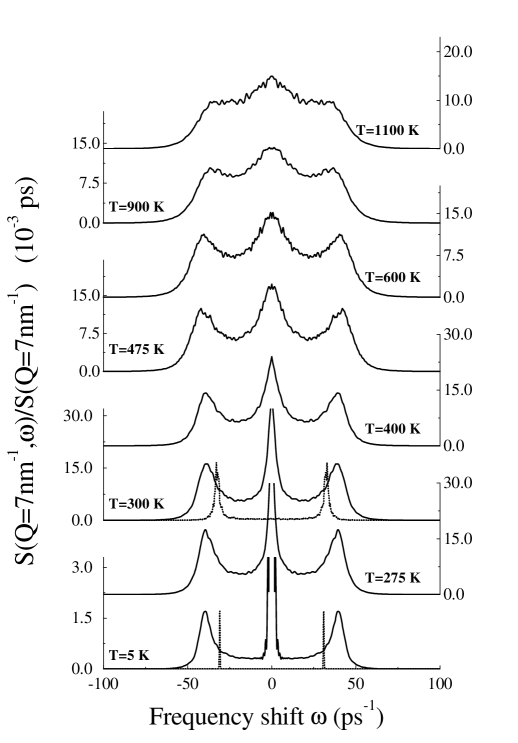
In Fig. 2 we report the temperature dependence of the dynamical structure factor for the same selected value of the momentum transfer, nm-1.
The temperature dependence of the spectra reported in Fig. 2 shows two apparently opposite behaviors; on one side the central line -or Mountain peak in the terminology of the glass transition phenomenology- gets narrower with decreasing temperature and its width -related to the inverse of the relaxation time - becomes negligible at the glass-transition, thus indicating the structural arrest (i. e. a divergent relaxation time). On the contrary the Brillouin component shows a much reduced temperature dependence, and the excitation maintains a significant linewidth even at very low temperature and no remarkable behavior is observed around .
]
It is worth to remember that the width of the Brillouin peaks is a non-monotonic function of , they attain a maximum in the temperature region where , and become negligible when (here is the frequency of the excitation, i. .e. approximately the Brillouin peak position). The origin of the non vanishing width of the Brillouin peak has to be searched in a phenomenon different from the relexation process responsible for the structural arrest (-process).
To investigate the effect of a possible origin (the anharmonicity) of the observed Brillouin linewidth, we report the spectra obtained by MD at 5 and 300 K in the lithium crystal, produced by thermalizing at finite temperature the configuration obtained starting from an ordered (BCC) lattice.
As clearly shown in the figure, and as well known from the experiments, the phonon linewidth in the crystal is completely negligible compared to the disordered phases, indicating that the residual linewidth cannot be attributed to anharmonicity, which, in turn, is expected to be of the same order of magnitude in the ordered and disordered phases.
]
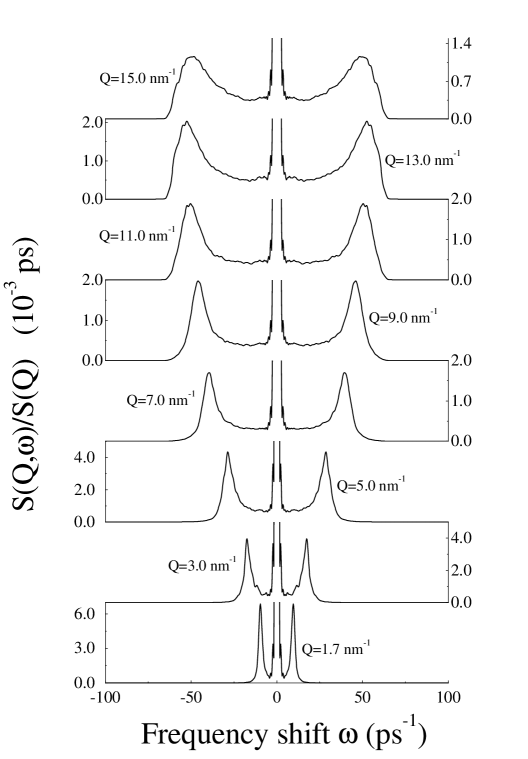
Having excluded the anharmonic origin of the Brillouin linewidth, a possibility lies in the presence of a further relaxation process, that in the system parallels the -process. In order to investigate on such a possibility, an appropriate way can be to study the dynamic structure factor in the glassy phase, where any relaxation effect due to the process is frozen. The dynamic structure factor of a lithium glass, obtained by ”instantaneous” quench from above the melting point, is reported in Fig.3.
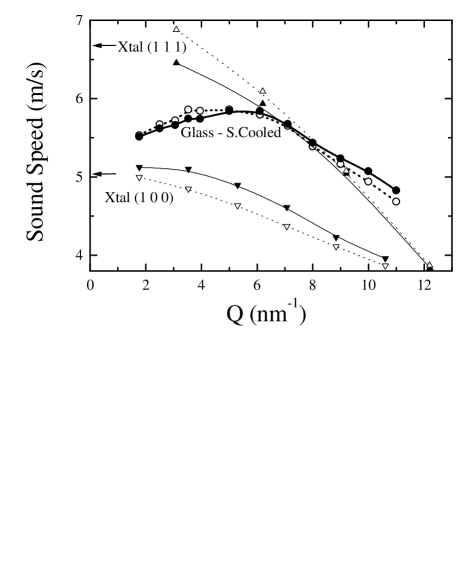
As a demonstration of the presence of such an additional relaxation process, we report the observation of a positive dispersion of the sound velocity below the melting temperature. This effect, also expected to take place at frequencies such that , is shown in Fig. 4, where we report the quantity with the maximum of the current correlation spectra
| (4) |
The existence of a positive dispersion of sound, reproduced by the simulations of the glass and cold liquid phases (it is missing in the crystal), supports the hypothesis of the existence of a second relaxation process.
The qualitative analysis of Fig. 2 per se indicates the presence of at least two relaxation processes governing the high frequency collective dynamics of the considered system: one, strongly temperature dependent, which shows up mostly in the width of the central line, and the other, strongly temperature independent, which gives rise to the width of the inelastic feature. These simulations confirm, therefore, in a much wider temperature range the conclusions provided by the analysis of the IXS data on lithium [22], and extend into the supercooled and glassy phase regions the theoretical predictions of a dynamics ruled by two different time-scales. Particularly interesting is the persistence of the second (fast) relaxation process, which is essentially identical in the liquid and in the glass. This result is somewhat in contradiction with the current belief: in fact, in the liquid the fast dynamical processes has been so far associated to uncorrelated binary collisions, while in the solid the atomic motion is dominated by long range correlations. A quantitative description of this relaxation process may contribute to shed light on this point.
We now quantitatively represent the dynamic structure factor to asses the evolution of the relaxation processes from the liquid down to the supercooled and glassy state. To this purpose, we analyzed our data adopting a model based on the memory function approach, introduced to represent the MD data on alkali metals [32, 33], and recently utilized to interpret the experimental data of liquid lithium [20], aluminum [23] and sodium [24]. Within this framework, the evolution of the density autocorrelation function is described by a memory function trough the Langevin equation:
where
| (5) |
By Fourier transformation, the dynamic structure factor is given by:
| (6) |
The complex memory contains all the interaction details and decays over the characteristic time-scales of the system. The dynamics of a simple liquid can be satisfactorily described by the two time exponentials ansatz [33]:
| (7) |
where the indexes and indicate the usual - (or structural-) and the fast- (or microscopic) process, respectively. We used Eq. (6) as a model function. Its convolution with the simulation resolution has been utilized as a fitting function to the MD spectra:
| (8) |
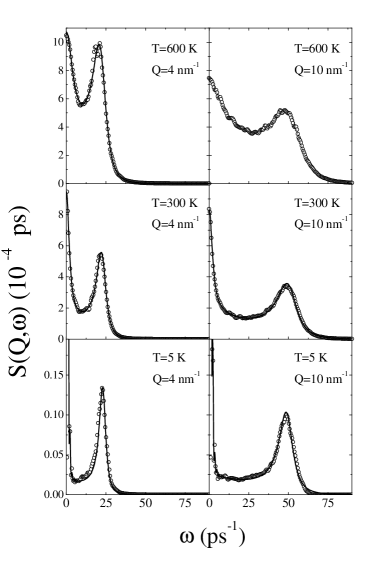
The results of such procedure are shown in Fig. 5, where we report the calculated dynamic structure factors together with their best fitted line-shapes at selected momenta and temperatures.
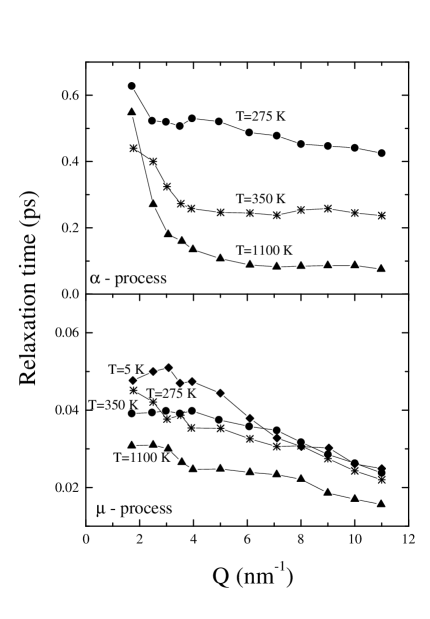
Among the fitting parameters, the relaxation times of the two processes are reported in Fig. 6 as function of the exchanged wavevector and at selected temperatures. At all considered temperatures, the -process shows an almost flat dependence, with an apparent increase below nm-1, an artifact that occurs when the relaxation time is comparable or higher than the inverse resolution, already observed in the analysis of the IXS spectra [22]. The microscopic process shows, instead, an effective slightly decreasing trend. The value of the structural relaxation time at large shows a sharp increase in the supercooled region and upon further cooling. On the contrary, the temperature behavior of the fast microscopic, , process is very different. In fact, it gives a basically -independent relaxation time in any of the considered phases. This figure provides a quantitative account of the qualitative analysis that was derived from the results reported in Fig. 1.
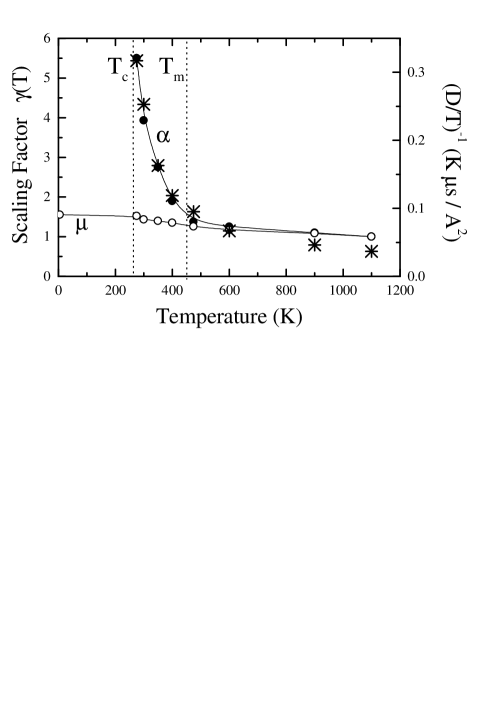
To be more precise in the assessment of the temperature dependence of the relaxation times, once observed that the dependence is similar for each temperature, we defined a -independent temperature coefficient, , through the relation . As arbitrary reference temperature we selected K, and we determined as the scaling factor that minimizes the mean squared differences between each set of data and the set at .
The result of such a procedure, for both the and processes, is reported in Fig. 7. As clearly seen, the relaxation time of the structural process increases about six times between and the lowest available temperature ( K). In the same plot we also report the quantity , being the diffusion coefficient determined in the simulations. As expected, this quantity follows a behavior similar to that of the relaxation time of the -process, thus confirming the validity of its identification with the structural relaxation process. On the contrary, the microscopic relaxation time exhibits a small variation in the whole temperature range with a total change of only 50% of the value at , and without any noteworthy behavior around . This demonstrates that the fast relaxation process is the same from the hot liquid down to the glass.
IV DISCUSSION AND CONCLUSIONS
In the present paper, we have shown how the dynamics of a simple monatomic system can be described in terms of two viscous relaxation processes in a range of temperature covering all disordered phases: the hot liquid, the supercooled liquid and the glass. Few comments concerning the physical origin of these two processes are in order. By its strong temperature dependence and by the close relation with the temperature dependence of the diffusion coefficient, the slower relaxation process is unambiguously identified as the process, i. e. the process that drives the glass transition in those systems capable to sustain strong under-cooling. More interesting are the indications obtained from the analysis of the faster process. The comparison between glass and crystal, the equivalence of the fast relaxation process in the liquid and in the glass, and the consistency between the simulation and experimental results in the liquid, are all indications that the origin of this process must be searched into something that is common between liquid and glass, but not existent in the crystal. On the considered fast time scale, which corresponds to values of fractions of ps, one can consider all diffusion processes in the liquid frozen, and on this snap-shot time-scale one can consider that the liquid and the glass are not only topologically, but also dynamically equivalent. Along this line, one is then driven to conclude that -similarly to what has been found in other model glasses [29]- also in the liquid this fast relaxation process is intimately related to the topologically disorder, while anharmonicity and/or dynamical effects play only a secondary role. The way in which the disorder can produce the phenomenology of a ”relaxation process” -also in the harmonic limit- is as follows. On a general ground, a relaxation process can be pictured as the macroscopic manifestation of microscopic phenomena associated with the existence of channels by which the energy stored in a given ”mode” relaxes towards other degrees of freedom. The spectrum of the density fluctuations, , through the fluctuation-dissipation relation, reflects the time evolution of the energy initially stored (=) in a plane wave of wavelength . As the plane wave is not an eigenstate of the disordered system, at there will be a transfer of amplitude from this plane wave towards other plane waves with different values. This process is controlled by the difference between the considered plane wave and the true normal modes of the topologically disordered glassy structure. This energy flow takes place on a specific time scale , and gives rise to the observed relaxation process phenomenology. The depicted scenario is in contrast with a description of the fast relaxation process in terms of (more or less correlated) binary collisions. Indeed, according to the usual description, the collision between two atoms -at a given position in space and at a given time - are not correlated with the dynamics of the atoms far away from , and with the dynamics of the colliding atoms at time larger than . In this view acts a the correlation time of the local dynamics. On the contrary, according to the present description, the dynamic of the whole system is strongly correlated -and described in term of normal modes of vibration- up to a time of the order of , and indicates the decorrelation time for the specific plane waves, not for the dynamics.
The common origin of the fast process in the liquid and in the glass, and its association to the disorder, poses against its interpretation in terms of kinetic processes such as “binary collisions”. In this sense, the idea that all the binary processes are contained in the short time dynamics ( region), while the correlated motion is fully described by the process has to be revised.
V ACKNOWLEDGEMENTS
The authors gratefully acknowledge U. Balucani for countless discussions on the origin of the microscopic relaxation: the realization of this paper is also due to his severe and constructive criticism. R. Di Leonardo, D. Fioretto, F. Sciortino and P. Tartaglia are also acknowledged. T.S. is finally grateful to W. Goetze for the encouragement that originated from the time spent discussing on the subject of this paper.
REFERENCES
- [1] J. R. D. Copley and M. Rowe, Phys. Rev. A, 9, 1656 (1974).
- [2] T. Bodensteiner et al. Phys. Rev. A, 45, 5709 (1992.
- [3] C. Morkel and W. Glaser, Phys. Rev. A 33, 3383 (1986); A. Stangl, C. Morkel, U. Balucani and A. Torcini, J. Non-Cryst. Solids 205-207, 402 (1996).
- [4] P. Verkerk et al., Physica B 180 & 181, 834 (1992).
- [5] A. G. Novikov et al., Physica B 228, 312 (1996).
- [6] P. Chieux, J. Dupuy-Philon, J. F. Jal and J. B. Suck, J. Non Cryst. Solids 205-207, 370 (1996).
- [7] U. Balucani, A. Torcini and R. Vallauri, Phys. Rev. A 46, 2159 (1992) and Phys. Rev. B 47, 3011 (1993).
- [8] A. Torcini, U. Balucani, P. H. K. de Jong and P. Verkerk, Phys. Rev. E 51, 3126 (1995).
- [9] S. Kambayashi and G. Kahl, Phys. Rev. A 46, 3255 (1992).
- [10] M. Canales, L. E. Gonzalez and J. A. Padrò, Phys. Rev. E 50, 3656 (1994).
- [11] J. Casas, D. J. Gonzalez and L. E. Gonzalez, Phys. Rev. B 60, 10094 (1999).
- [12] J. Casas, D. J. Gonzalez, L. E. Gonzalez and M. Silbert, Jorn. Non Cryst. Solids 250, 102-106 (1999).
- [13] K. N. Pathak, S. Ranganathan, R. E. Johnson, R. K. Sharma, K. Tankeshwar, Phys. Rev. E 57, 6195-6197 (1998).
- [14] R. M. Yulmetyev, A. V. Mokshin, P. Hanggi and V. Yu. Shurygin, Phys. Rev. E 64, 057101 (2001).
- [15] R. Verbeni, F. Sette, M. Krisch, U.Bergman, B. Gorges, C. Halcoussis, K. Martel, C. Masciovecchio, J. F. Ribois, G. Ruocco and H. Sinn, J. Of Synchrotron Radiation, 3, 62 (1996).
- [16] C. Masciovecchio, U. Bergman, M. Krisch, G. Ruocco, F. Sette and R. Verbeni, Nucl. Inst. and Meth., B-111, 181 and B-117, 339 (1986).
- [17] E. Burkel, 1991, ”Inelastic Scattering of X-rays with very high Energy Resolution”, Springer Verlag, Berlin.
- [18] H. Sinn, F. Sette, U. Bergmann, Ch. Halcoussis, M. Krisch, R. Verbeni and E. Burkel, Phys. Rev. Lett. 78, 1715 (1997).
- [19] W.C. Pilgrim, S. Hosokawa, H. Saggau, H. Sinn, E. Burkel, J. Non Cryst. Solids 250-252, 96 (1999).
- [20] T.Scopigno, U. Balucani, G. Ruocco, F. Sette, Phys. Rev. Lett. 85, 4076 (2000).
- [21] T. Scopigno, U. Balucani, A. Cunsolo, C. Masciovecchio, G. Ruocco, F. Sette and R. Verbeni, Europhys. Lett. 50, 189 (2000).
- [22] T. Scopigno, U. Balucani, G. Ruocco and F. Sette, Journal of Physics C 12, 8009 (2000).
- [23] T.Scopigno, U. Balucani, G. Ruocco, F. Sette, Phys. Rev. E 63, 011210 (2001).
- [24] T.Scopigno, U. Balucani, G. Ruocco, F. Sette, Phys. Rev. E 65, 031205 (2002).
- [25] U. Balucani, M. Zoppi ”Dynamics of the liquid state”, Clarendon Press, Oxford, (1983).
- [26] W. Gotze, Journal of Physics C 11, A1 (1999) and H.Z. Cummins, Journal of Physics C 11, A99 (1999).
- [27] L. Sjogren, Phys. Rev. A 22, 2866 and 2883 (1980).
- [28] W. Gotze and M.R. Mayr, Phys. Rev. E 61, 587 (2000).
- [29] G. Ruocco et al. Phys. Rev. Lett. 84, 5788 (2000); cond- mat/0001030.
- [30] ”Handbook of Thermodynamic and Transport Properties of Alkali Metals”, (Ohse et al., ed.) Blackwell Scientific Publications, pag. 735 (1985).
- [31] L. Angelani et al. Phys. Rev. Lett. 85, 5356 (2000).
- [32] H. Mori, Prog. Theor. Phys., 33, 423, (1965).
- [33] D. Levesque, L. Verlet and J. Kurkijarvi, Phys. Rev. A 7, 1690 (1973).