Is U3Ni3Sn4 best described as near a quantum critical point?
Abstract
Although most known non-Fermi liquid (NFL) materials are structurally or chemically disordered, the role of this disorder remains unclear. In particular, very few systems have been discovered that may be stoichiometric and well ordered. To test whether U3Ni3Sn4 belongs in this latter class, we present measurements of the x-ray absorption fine structure (XAFS) of polycrystalline and single-crystal U3Ni3Sn4 samples that are consistent with no measurable local structural disorder. We also present temperature-dependent specific heat data in applied magnetic fields as high as 8 T that show features that are inconsistent with the antiferromagnetic Griffiths’ phase model, but do support the conclusion that a Fermi liquid/NFL crossover temperature increases with applied field. These results are inconsistent with theoretical explanations that require strong disorder effects, but do support the view that U3Ni3Sn4 is a stoichiometric, ordered material that exhibits NFL behavior, and is best described as being near an antiferromagnetic quantum critical point.
pacs:
72.15.Qm, 61.10.Ht, 71.23.-k, 71.27.+aI Introduction
U3Ni3Sn4 displays characteristic non-Fermi liquid behavior (NFL).Shlyk et al. (1999) For instance, the low-temperature magnetic susceptibility diverges as , the leading coefficient for the electronic term in the specific heat varies as , and the resistivity varies as . Such behavior is at odds with the standard Fermi liquid (FL) description ( const., ) of Landau.Landau (1957) The present study attempts to differentiate between the applicability of various theoretical models describing NFL behavior in this system by searching for the presence of local lattice disorder and measuring how the electronic part of the specific heat is affected by applied magnetic fields.
Current models describing NFL behavior fall into a few general classes, including those that invoke close proximity to a zero-temperature phase transition, competition between interactions such as Ruderman-Kittel-Kasuya-Yosida (RKKY) and Kondo effects, and those that include magnetic-interaction disorder. For instance, non-Fermi liquid behavior in the high-temperature superconductors and in some of the heavy fermion systems has been postulated to be due to the proximity of these systems to a zero-temperature magnetic phase transition.NFL We will refer to such models as anti- or ferromagnetic quantum critical point (AF-QCP or FM-QCP) models. Indeed, a number of -electron compounds and alloys have been described as near a QCP, based on the entry of a system into a magnetic phase with increasing applied pressure or via chemical substitution (“chemical pressure”).Stewart (2001) MillisMillis (1993) and othersIoffe and Millis (1995); Moriya and Takimoto (1995); Lonzarich (1997); Coleman (1999) have developed the theory of critical fluctuations at temperatures above such a magnetic/non-magnetic QCP, building off earlier work by Hertz.Hertz (1976) The proximity of a magnetic phase is not necessary to obtain an NFL state, however. For instance, a multichannel Kondo modelNozières and Blandin (1980) also exhibits non-Fermi liquid properties. In addition, even though these theories all use a single magnetic interaction strength between the and the conducting electrons (as opposed to a distribution), the first-discovered NFL systems also contain some form of lattice disorder, usually in the form of chemical substitution. This raises the possibility that lattice disorder plays an important role in NFL physics. In fact, a broad distribution of effective moments has been observed in several systems (for instance, CeRhRuSi2Graf et al. (1997) and UPdCu4Bernal et al. (1995)). These facts prompted researchers to consider the role of “magnetic interaction disorder” as a microscopic origin for non-Fermi liquid effects. One simple theory utilizes only Fermi liquid concepts with a distribution of Kondo interactions, and is known as the “Kondo disorder model” (KDM).Bernal et al. (1995); Miranda et al. (1996) Other models that consider disorder in the vicinity of a zero-temperature fixed point are known as Griffiths’ phase models (note that the KDM is also a Griffiths’ phase model, but is not usually classified as such). These include the Griffiths’-McCoy singularities that occur in a disordered Kondo system, but whose properties mainly derive from local antiferromagnetic RKKY interactions within only a few clusters.Castro Neto et al. (1998); Castro Neto and Jones (2000) Another possible origin of a Griffiths’ phase occurs when disorder-induced Anderson localization occurs in the vicinity of a metal-insulator transition.Miranda and Dobrosavljević (2001) To clarify the discussion, we will refer to the former model as the antiferromagnetic Griffiths’ phase, or AF-GP, and to the latter model as the metal-insulator-transition Griffiths’ phase, or MIT-GP.
Although most known NFL materials have some intrinsic disorder, a few have recently been identified that appear to be stoichiometric and structurally well-ordered at ambient pressure. Some examples include YbRh2Si2,Trovarelli et al. (2000) CeNi2Ge2,Grosche et al. (2000) CeCoIn5Petrovic et al. (2001) and U3Ni3Sn4.Shlyk et al. (1999) Although some of the physical properties of these systems agree with those predicted by the QCP model proposed by Millis,Millis (1993) none of these materials display properties that completely agree with it. In addition, it is difficult to uniquely differentiate between “pure” QCP models and Griffiths’ phase models, especially since the Griffiths’ models have critical exponents that depend upon the degree of disorder in a way that is presently impossible to quantitatively relate to experimental measures of disorder.Castro Neto (2002)
Careful consideration of the disorder-based and the pure QCP models involves comparisons both of electronic and magnetic properties to theory, and thorough characterization of the degree of structural and magnetic order of the samples. The U3Ni3Sn4 situation is complicated by the fact that U3Ni3Sn4 has been shown to have a Fermi liquid ground state below about 0.4-0.5 K, with NFL behavior occurring above this crossover region.Shlyk et al. (2000) Regardless, in the NFL region, the electrical resistivity goes as .Shlyk et al. (1999) This dependence is roughly consistent with the AF-QCP result of , if one allows for the possibility, as discussed in Ref. Coleman, 1999, that the non-Fermi liquid regions of the Fermi surface only occupy so-called “hot lines” where magnetic scattering dominates, and that the rest of the Fermi surface constitutes a Fermi liquid regime that could dominate the conductivity. The experimental magnetic susceptibility diverges as , although the lowest measured temperature is 2 K. AF-QCP systems should vary as , with , such as in the case of CeCu5.9Au0.1.A. Schröder et al. (1998) The U3Ni3Sn4 data can also be fit with this form, although the accuracy of the final result () is limited by the measured temperature range. In any case, the magnetic susceptibility data can also be interpreted as consistent with the AF-QCP. The electronic part of the specific heat is also consistent with the AF-QCP, varying as as . Alternatively, these results can be self-consistently explained with an AF-GP phaseCastro Neto et al. (1998); Castro Neto and Jones (2000) and a critical exponent of , which produces comparably good fits to the data.Shlyk et al. (2000) In addition, these data are qualitatively consistent with the two-channel Kondo modelCox (1987); Cox and Zawadowski (1998); Jarrell et al. (1996, 1997), although fits using this model require an unrealistically high spin-fluctuation energy.Shlyk et al. (1999) Comparisons to the KDM are not favorable either, since the KDM predicts logarithmic divergences of the magnetic susceptibility and specific heat and a linear temperature dependence of the electrical resistivity, all of which are clearly at odds with the experimental data. In addition, measurements at applied pressures up to 1.8 GPaEstrela et al. (2001) indicate that the low-temperature FL ground state of U3Ni3Sn4 extends to higher temperatures with increasing pressure. A scaling analysis of the FL/NFL crossover temperature as a function of applied pressure strongly implies a magnetic critical point at a negative-pressure that has been estimated at GPa.
Although the measured properties of U3Ni3Sn4 do not clearly support any of the various NFL models, there is little evidence to suggest that any disorder exists in this system, which is inconsistent with both the KDM and Griffiths’ phase models in spite of their agreement with thermal and magnetic data. In particular, single crystals of the material form, and x-ray diffraction studies of available crystals show the material to be consistent with the nominal stoichiometry. Moreover, the residual resistivity is as low as 7 cmShlyk et al. (1999). Nevertheless, some forms of lattice disorder can be difficult to detect using standard diffraction techniques. For instance, if disorder occurs in a non-periodic fashion, such as in amorphous regions or very small domains, only a local structural probe such as x-ray absorption fine-structure (XAFS) or pair-distribution function (PDF) analysis of powder diffraction data will be sensitive to it. In addition, no temperature dependent structural studies have been performed, and disorder broadening of the mean-squared displacement parameters (Debye-Waller factors) can easily be confused with large vibrational amplitudes. Therefore, we have undertaken a direct test of the degree of structural order in U3Ni3Sn4 using XAFS spectroscopy. Although some technical issues limit the accuracy of the estimated maximal disorder levels as detailed below, our measurements are consistent with no disorder within experimental error, for both single crystals and polycrystals, based on temperature dependent data from all three investigated absorption edges.
As implied above, merely having the lattice be (measurably) well ordered may not rule out magnetic interaction disorder. Since the Griffiths’ phase models only require very few clusters to be dominated by one of the competing interactions, such clusters may only have a negligible effect on the average lattice disorder in a real material. In addition, some heretofore more subtle Kondo disorder mechanism may still be applicable (for instance, if large fluctuations in the conduction electron density of states accompany fluctuations in the hybridization strength in the presence of lattice disorderCox (2002)). In any case, the AF-GP model makes quantitative predictions regarding the magnetic field dependence of certain properties, including the specific heat. Below we compare such measurements to the AF-GP predictions and find they are inconsistent. Instead, we find these data are more consistent with the presence of a low-lying magnetic phase.
The rest of this paper is organized as follows. The XAFS measurements are described in Sec. II, including a description of the sample preparation and the XAFS technique. Sec. III relates the results from the measurements of specific heat as a function of temperature and applied field. All of these results are discussed in relation to the various NFL theories in Sec. IV, and the final conclusions are summarized in Sec. V.

II XAFS measurements
II.1 Background
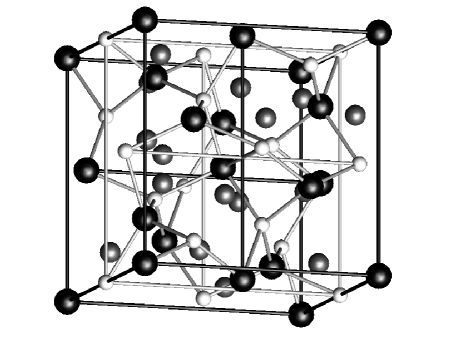
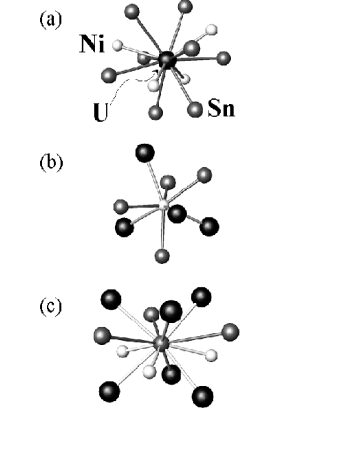
U3Ni3Sn4 crystallizes into a structure, in the space group with the room-temperature lattice parameter 9.3524 Å and a position parameter =0.082 describing the Sn (16) site (Fig. 1).u (33) The near-neighbor shells are fairly well separated (Fig. 2). For instance, U has 4 nearest-neighbor Ni’s at 2.86 Å, followed by 8 Sn neighbors at 3.24 Å. Ni has 4 Sn neighbors at 2.61 Å and 4 U neighbors at 2.86 Å. Sn has 3 Ni neighbors at 2.61 Å, followed by 6 U neighbors at 3.24 Å, and 3 Sn neighbors at 3.50 Å.
II.2 Experimental
Three of the samples are polycrystalline with nominal stoichiometries U3.0Ni3.0Sn4.0, U2.9Ni3.0Sn3.9, and U3.0Ni3.1Sn3.9. Two single-crystal samples were also measured with nominal stoichiometries of U3.0Ni3.0Sn4.0 and U2.9Ni3.0Sn3.9. The stoichiometries of the single crystals has been confirmed by single-crystal x-ray diffraction measurements and are, in fact, the same samples as those reported in Ref. Shlyk et al., 1999. Polycrystalline sample stoichiometries are only nominally based on the composition of the starting materials. However, we believe they are accurate given that the sample weight losses from arc melting were always the order of a few tenths of a percent or less, and could be entirely attributed to a tendency for sample boules to spall on the surface or shatter when first struck with the arc discharge. Uranium has an extremely low vapor pressure during arc melting, and noteworthy weight losses of Sn or Ni material were not observed at any composition near the desired stoichiometry.
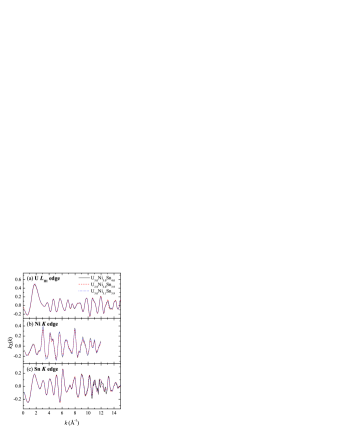
All XAFS data were collected on beam lines 4-1 and 4-3 at the Stanford Synchrotron Radiation Laboratory (SSRL) using half-tuned Si(220) double monochromator crystals. Samples were placed into a LHe flow cryostat. Polycrystalline samples were ground into a fine powder under acetone, passed through a 40 m sieve and brushed onto scotch tape, with stacked layers such that the total thickness of each transmission sample corresponded to a change of about one absorption length at each measured edge. Data for the polycrystals were collected at various temperatures between 20 K and 300 K at the U and Sn edges in transmission mode, and at the Ni edge in fluorescence mode using a 4-pixel Ge detector.Bucher et al. (1996) Single crystal data were collected at 20 K at the U and the Sn and Ni edges in fluorescence mode. Several scans were obtained for each sample at each edge and temperature, and were fit separately to crosscheck the error estimates. Dead-time and self-absorptionBooth (1996) corrections were applied to the fluorescence data.
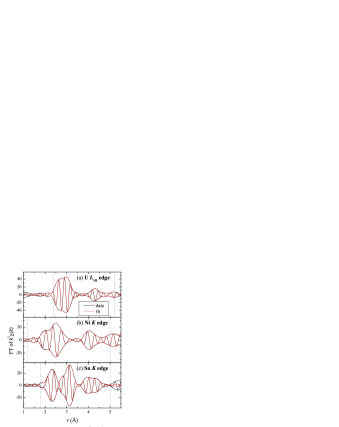
Data were reduced and fit in position-space using the RSXAP package.Hayes and Boyce (1982); Li et al. (1995); RSX In particular, the XAFS function is defined as , where is the absorption coefficient as a function of the photoelectron wave vector , and is the so-called “embedded atom” background absorption that is proportional to the number of generated photoelectrons. The wave vector is defined as . The photoelectron threshold energy is defined arbitrarily as the energy at the half-height of the edge, and is allowed to vary in subsequent fits. Examples of the data are shown in Fig. 3 for the polycrystalline samples. Data on single crystals are similar, both in quality and quantity.
The scattering amplitudes are all fixed to , where is the nominal number of neighbors in the th shell for the stoichiometric compound, and is the XAFS amplitude scale factor. Each data set was fit with a single value of , assuming full nominal site occupancies. All scattering paths also share a single value of . In the case where multiple temperatures were collected, average values of and were obtained and then held fixed for all temperatures for a given edge. Fixing , and in the final fits drastically reduces the number of fit parameters, but assigns all lattice disorder effects to either the measured bond lengths, , or the Debye-Waller factors, . In particular, the effect of vacancies is placed on the Debye-Waller factors. Measured and values for both the single-crystal and the polycrystalline data are the same within experimental error. Reported error estimates use the larger of either a Monte Carlo estimate of the 1-standard deviation displacements (essentially equivalent to a covariance matrix without having to assume that the statistical- is quadratic near its minimum), or the width of the distribution of parameters obtained by fitting the individual scans at each temperature. Reported errors are generally consistent with those obtained from comparisons to standard compounds, typically 0.005 Å in pair distance and 10-20% in for near neighbors, with the error roughly doubling after about 3 Å.Li et al. (1995)
| U3Ni3Sn4 | U2.9Ni3.0Sn3.9 | U3.0Ni3.1Sn3.9 | ||||||||||||
|---|---|---|---|---|---|---|---|---|---|---|---|---|---|---|
| pair | ||||||||||||||
| U-Ni | 4 | 2.864 | 2.848(3) | 0.0018(2) | -0.0009(4) | 252(5) | 2.848(4) | 0.0019(4) | -0.0004(5) | 282(2) | 2.848(3) | 0.0019(2) | -0.0005(5) | 259(4) |
| U-Sn | 8 | 3.237 | 3.228(2) | 0.0011(2) | -0.0006(3) | 241(1) | 3.226(4) | 0.0009(2) | -0.0009(3) | 231(1) | 3.226(3) | 0.0009(2) | -0.0007(3) | 233(1) |
| U-U | 8 | 4.374 | 4.36(1) | 0.0016(3) | -0.0005(3) | 164(6) | 4.355(5) | 0.0014(2) | -0.0005(3) | 173(2) | 4.355(3) | 0.0014(2) | -0.0000(3) | 169(3) |
| U-Ni | 2 | 4.676 | 4.67(1) | 0.0015(3) | 4.67(1) | 0.0022(6) | 4.67(1) | 0.0022(4) | ||||||
| Sn-Ni | 3 | 2.609 | 2.604(3) | 0.003(1) | 0.001(1) | 420(15) | 2.597(3) | 0.0027(2) | -0.0003(2) | 349(4) | 2.599(3) | 0.0027(2) | 0.0008(3) | 359(3) |
| Sn-U | 6 | 3.237 | 3.223(5) | 0.0006(4) | -0.0017(5) | 202(12) | 3.232(7) | 0.0016(2) | -0.0004(2) | 246(2) | 3.228(3) | 0.0012(2) | -0.0004(2) | 273(5) |
| Sn-Sn | 3 | 3.497 | 3.50(3) | 0.003(3) | -0.003(3) | 172(17) | 3.500(4) | 0.004(1) | -0.000(1) | 245(6) | 3.496(3) | 0.0017(5) | -0.0001(6) | 250(20) |
| Sn-Sn | 2 | 4.050 | 3.98(3) | 0.003(3) | 4.03(1) | 0.01(1) | 4.02(1) | 0.0024(7) | ||||||
| Sn-Ni | 3 | 4.232 | 4.25(3) | 0.002(1) | 4.16(5) | 0.01(1) | 4.22(1) | 0.005(2) | ||||||
| Sn-Sn | 6 | 4.594 | 4.60(3) | 0.002(1) | 4.598(4) | 0.0034(3) | 4.596(3) | 0.0023(2) | ||||||
| Ni-Sn | 3 | 2.609 | 2.588(4) | 0.0017(4) | -0.0004(5) | 347(10) | 2.585(6) | 0.0014(3) | -0.0007(3) | 334(10) | 2.587(4) | 0.0017(6) | 0.0003(6) | 353(4) |
| Ni-U | 3 | 2.864 | 2.850(6) | 0.0028(6) | 0.0003(7) | 252(7) | 2.850(8) | 0.0023(5) | -0.0005(5) | 234(7) | 2.853(6) | 0.002(1) | -0.0005(9) | 234(4) |
| Ni-Sn | 3 | 4.231 | 4.24(1) | 0.0005(9) | 4.26(1) | 0.000(2) | 4.25(2) | 0.004(3) | ||||||
| Ni-Ni | 3 | 4.374 | 4.35(1) | 0.001(1) | 4.35(1) | 0.000(1) | 4.37(1) | 0.001(2) | ||||||
| Ni-U | 3 | 4.676 | 4.70(5) | 0.005(7) | 4.70(3) | 0.003(4) | 4.70(3) | 0.003(2) | ||||||
II.3 Results
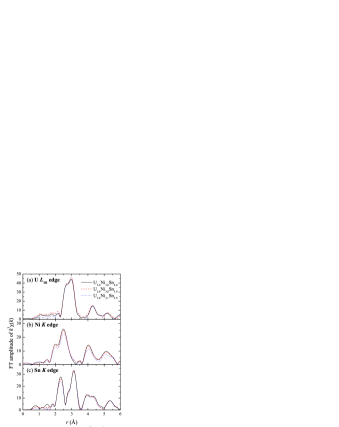
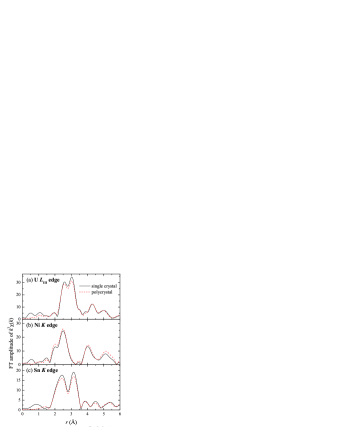
Figures 4 and 5 show the Fourier transforms (FT) of . Peaks in the FT’s correspond to near-neighbor pairs distances in the local structure. Although these functions are closely related to the radial distribution function, there are some important differences. For instance, constructive/destructive interference can occur (the functions have real and imaginary parts), the scattering profiles are not Gaussian, and phase shifts occur that place the peaks at distances in the FT’s that are shorter than in the structure by an amount related to the species of absorber and backscatterer. All of these complications are included in the detailed fits below. Transmission data were collected out to a Å, and fluorescence data were collected out to a Å. Fig. 5 shows a comparison between the single-crystal and polycrystalline data for the U3.0Ni3.0Sn4.0 samples using the same transform ranges.
There are visible differences between the various data sets for a given edge. In particular, the Ni and Sn -edge data on the polycrystalline U3.0Ni3.1Sn3.9 sample consistently show a reduced amplitude compared to U3.0Ni3.0Sn4.0 at all temperatures, consistent with some disorder or the presence of an amorphous phase containing those elements. Although these differences are above the signal to noise, it is not possible to discern their exact cause from the fit results listed below. Differences between the polycrystalline and the single-crystal data (Fig. 5) are similar in magnitude, but complications with analyzing single-crystal data, such as dead-time and self-absorption corrections, are very likely the cause.
The basic procedure used here for searching for lattice disorder is to carry out fits assuming the nominal structure, then examine certain parameters for signs of disorder. In the fits, each distinct scattering shell in the nominal structure out to about 4.7 Å is used at each edge. Fit results to the data from the polycrystalline samples are reported in Table 1, and are compared to results from diffraction measurements. The fit quality is very high; examples are shown in Fig. 6. Although all the polycrystalline data were collected as a function of temperature, we only show the fit results for the coldest measured temperature. No significant changes in the fit parameters occur with temperature, except that the Debye-Waller factors increase in a manner consistent with the correlated-Debye modelCrozier et al. (1988) plus a temperature-independent offset . Such offsets can be used as indicators for non-thermal disorder (a prime example occurs in the colossal magnetoresistance manganese perovskitesBooth et al. (1998a)). Results for the correlated-Debye temperature and are shown in Table 1. We see no evidence for values inconsistent with zero disorder. Note that the preponderance of small, negative values of are unphysical and likely due to small underestimates of .
Fit results to the single-crystal data were found to be the same as results from the polycrystalline data within the error estimates, and so are not reported here. No evidence for lattice disorder is observed, as exemplified by the consistently low values of the nearest-neighbor ’s for the low temperature fits.
Finally, we consider the possibility of site interchange, or site/anti-site disorder. This possibility is very remote, however, given the big differences in the radii of the atoms involved, except for Sn/U interchange (covalent radii are 1.42 Å, 1.15 Å, and 1.41 Å for U, Ni and Sn, respectively). Unfortunately, fitting the Sn and U XAFS data including some U/Sn interchange gives only a broad result: %, where is the percentage of Sn sitting on U (12) sites. Fits including U/Ni and Sn/Ni site interchange were similarly imprecise. The principal difficulty in using XAFS (or diffraction, for that matter) to measure between two atomic species is the correlation between and the Debye-Waller factors for each site. If is sufficiently large, some of that uncertainty is removed. This unfortunate situation is best illustrated by looking at the polycrystalline data in Fig. 4. These various samples have different stoichiometries, and obvious systematic differences in the XAFS Fourier transforms are visible that certainly are at least partially due to the various ”site interchanges.” However, they all fit a 334-type stoichiometry well (Table 1). In any case, since there are no easily visible peaks corresponding to, say, the Sn site in the U data (Figs. 4, 5), we conclude that there is probably even less site interchange than allowed for by the upper limits reported above. This situation is in contrast to that in the UPdCu4 system.Booth et al. (1998b) In any case, the single-crystal diffraction resultsShlyk et al. (1999) should not have produced such high quality fits if much more than 5% of such interchange occurs.
III Field-dependent specific heat measurements
III.1 Experimental
The heat capacity measurements were performed using a Physical Property Measurement System (Quantum Design). The temperature was controlled by a Cernox thermometer. The temperature error is 1% at 4 K and 9 T. The heat capacity software uses Quantum Designs’ “two-” model to measure the heat capacity of the sample. The two- model simulates the effect of heat flowing between the sample platform and sample, and the effect of heat flowing between the sample platform and thermal bath.
III.2 Results
The specific heat of a U3Ni3Sn4 single crystal from the same batch as the XAFS sample was measured between 1.8 and 30 K in applied magnetic fields up to 8 T. These data are shown in Fig. 7, plotted as versus . Here we have already subtracted the hyperfine and lattice contribution according to the specific heat analysis reported previously.Shlyk et al. (2000) Note that although a nuclear Schottky term exists for the Sn atoms in the sample, its effect can be seen to be negligible for this analysis.Shlyk et al. (2000) In zero applied magnetic field the data follow the behavior below 6 K, indicative of the non-Fermi liquid regime. Increasing the applied magnetic field progressively depresses the specific heat so that shows a deviation from square root behavior at lower temperatures. It is expected that tends toward a constant value at temperatures lower than 1.8 K, suggesting the onset of a Fermi-liquid regime. These results strongly imply that the applied fields destroy the magnetic fluctuations due to a nearby antiferromagnetic critical point.
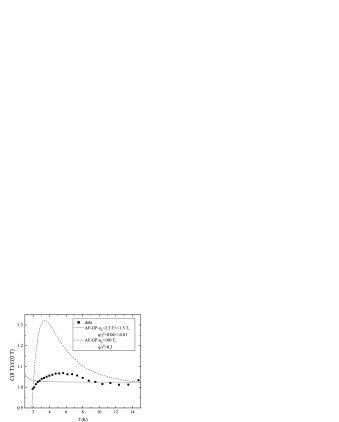
On the other hand, if one plots the data as (Fig. 8), one might interpret the observed peak near 5 K in applied field as arising from a Schottky-like feature. This observation leads to an alternative explanation of these data provided by the AF-GP model.Castro Neto and Jones (2000) In the high-field limit of this model, the specific heat should go as , where is the aforementioned critical exponent from the low temperature and magnetic susceptibility data, is an average effective moment of the antiferromagnetic clusters, and is a constant that is difficult to calculate in the theory and is thus taken as arbitrary. This function has been successfully applied to, for instance, Ce0.05La0.95RhIn5.Kim et al. (2002) However, this analysis leaves open the question of whether the coefficient takes on physically meaningful values, and whether the aforementioned assumption that the data is in the high-field limit is valid. Instead, consider the form for the specific heat at any field given in Ref. Castro Neto and Jones, 2000:
| (1) |
where is the cluster tunneling energy, is the tunneling energy for a single atom, is , and is the percolation exponent. is the magnetic energy of a given cluster, and is given by:
| (2) |
where gives the magnitude of the average moment within a cluster, and for ferromagnetic (antiferromagnetic) interactions. For our data, , the percolation scaling exponent for three dimensions with no magnetic order is , and . The tunneling frequency cutoff is taken as one of only two fitting variables, with the other being , which we apply as a single variable. By taking the ratio (valid at all fields and temperatures), we eliminate the coefficient . Using this form, we find that no combination of fitting variables produces a satisfactory fit. For example, Fig. 8 shows a typical calculation where the parameters were chosen to give a peak in in the vicinity of the observed peak. This “fit” produces far too large a peak compared to the peak in the data. The best fit actually places the Schottky-like anomaly below the observed range with a very small effective moment (1/100 of that from Ce0.05La0.95RhIn5). We therefore conclude that the AF-GP model (as posed) does not describe the physics in U3Ni3Sn4.
IV Discussion
Deviations from the nominal structure in the fit results can occur in a number of ways. First, the measured amplitude reduction factors should be in a range that has been experimentally measured before, since this factor represents inelastic losses and errors in the theoretical backscattering amplitudes that only weakly depend on an individual system. Indeed, our measurements fall within acceptable ranges.Li et al. (1995); Booth et al. (1998b) Second, the temperature dependence of the Debye-Waller factors can be compared to a correlated-Debye model, with large offsets indicative of static (i.e. non-thermal) disorder or distortions. In all cases, we see no abnormally large offsets. Third, the measured pair distances should be reasonably close to those measured by diffraction, which is consistent with our measurements (Table 1). Fourth, various site-interchange possibilities should be considered, such as U sitting on the (nominally) Sn (16c) site. Although these fits are not particularly sensitive to such interchanges, our measurements are consistent with no site interchange. Finally, the results from the single-crystal and the polycrystalline samples are virtually identical. Together with the single-crystal diffraction results,Shlyk et al. (1999) we must conclude that the U3Ni3Sn4 system is structurally well ordered, and is much more ordered than, say, the UPdCu4 system.Booth et al. (1998a); Bauer et al. (2001) Although such crystalline order does not rule out some other source of magnetic-interaction disorder that might be consistent with a Kondo disorder model or a Griffiths phase model, it certainly rules out extensive lattice disorder. In addition, although these structural studies cannot rule out the presence of small amounts of disorder, previous work within the simplest form of the Kondo disorder model has shown that significantly more disorder would have to be present for that model to work (in UPdCu4, for instance, Ref. Bauer et al., 2001 estimates that at least 0.002 Å2 of static disorder is necessary to produce NFL behavior from the KDM).
Even with small, undetected amounts of disorder, Griffiths’ phase models may be capable of describing the physics in this system. In the AF-GP model, for instance, the exact relationship between the required degree of disorder as measured by the number and distribution of antiferromagnetic clusters and the physical properties remains unclear. However, the AF-GP model makes very clear predictions about the evolution of the specific heat with applied magnetic field. We show in Sec. III that these predictions do not describe the observed features. Until more precise, measurable predictions relating disorder to physical properties are obtained, we conclude that disorder presents at best a small perturbation to this system. Of course, some other specific-heat anomaly of unknown origin may be responsible for the observed change in the FL/NFL crossover temperature with field. However, without any possible candidates for such an anomaly, these results leave the AF-QCP theory as the only current alternative.
There are other requirements for an AF-QCP theory, of course. For one, the system must be very near a magnetic/non-magnetic instability. Measurements under applied pressure indicate this instability may exist at a small negative pressure, based on a scaling of the resistivity behavior. We thus expect that if the magnetic phase is antiferromagnetic, an applied magnetic field will also move the system toward a Fermi liquid regime. The data presented in Fig. 7 indicate this system behaves exactly as one expects if the system is near a magnetic/non-magnetic instability, and are therefore qualitatively consistent with models that include antiferromagnetism as a competing interaction.
V Conclusion
In summary, we have measured the local structure around the constituent atoms in U3Ni3Sn4 single crystals and polycrystals as a function of temperature and stoichiometry. These data follow typical Debye-model dependences in the measured pair-distance distribution widths with no static (i.e. non-thermal) offsets. Moreover, the measured local structure agrees well with the previous single-crystal diffraction studies.Shlyk et al. (1999) In addition, the relatively low residual resistivity and all other evidence indicates that this system is structurally well ordered. We also report specific heat data that are clearly inconsistent with the antiferromagnetic Griffiths’ phase model. These data instead suggest a recovery of Fermi liquid behavior under modest applied magnetic fields, qualitatively consistent with the interpretation that applied fields destroy magnetic fluctuations in the vicinity of a quantum critical point. This result is also consistent with work under applied pressure that indicates a negative-pressure QCP.Estrela et al. (2001) Taking all these results together, we have ruled out the simple form of the KDM and the AF-GP theories. In addition, the lack of measurable disorder does not favor other disorder-based theories, such as the MIT-GP. With no indications to the contrary, we conclude that the best current description of U3Ni3Sn4 is that of a system near an antiferromagnetic quantum critical point.
Acknowledgements.
We thank E. D. Bauer, A. J. Millis, E. Miranda, A. H. Castro Neto and D. L. Cox for many useful discussions. This work was partially supported by the Director, Office of Science, Office of Basic Energy Sciences (OBES), Chemical Sciences, Geosciences and Biosciences Division, U.S. Department of Energy (DOE) under Contract No. AC03-76SF00098. Work at the University of Kentucky was supported by the DOE Office of Science, Division of Materials Sciences Grant No. DE-FG02-97ER45653. XAFS data were collected at the Stanford Synchrotron Radiation Laboratory, a national user facility operated by Stanford University of the behalf of the DOE/OBES.References
- Shlyk et al. (1999) L. Shlyk, J. C. Waerenborough, P. Estrela, L. E. DeLong, A. de Visser, and M. Almeida, J. Phys.: Condens. Matter 11, 3525 (1999).
- Landau (1957) L. D. Landau, Sov. Phys. JETP 3, 920 (1957).
- (3) See, for example, articles in Proceedings of the Conference on Non-Fermi Liquid Behavior in Metals, Santa Barbara, California, 1996, edited by P. Coleman, M. B. Maple, and A. J. Millis, J. Phys.: Condens. Matter 8, 9675 (1996).
- Stewart (2001) G. R. Stewart, Rev. Mod. Phys. 73, 797 (2001).
- Millis (1993) A. J. Millis, Phys. Rev. B 48, 7183 (1993).
- Ioffe and Millis (1995) L. B. Ioffe and A. J. Millis, Phys. Rev. B 51, 16151 (1995).
- Moriya and Takimoto (1995) T. Moriya and T. Takimoto, J. Phys. Soc. Jpn. 64, 960 (1995).
- Lonzarich (1997) G. G. Lonzarich, in The Electron, edited by M. Springford (Cambridge University Press, New York, 1997), chap. 6.
- Coleman (1999) P. Coleman, Physica B 259-261, 353 (1999).
- Hertz (1976) J. A. Hertz, Phys. Rev. B 14, 1165 (1976).
- Nozières and Blandin (1980) P. Nozières and A. Blandin, J. Phys. (France) 41, 193 (1980).
- Graf et al. (1997) T. Graf, J. D. Thompson, M. F. Hundley, R. Movshovich, Z. Fisk, D. Mandrus, R. A. Fisher, and N. E. Phillips, Phys. Rev. Lett. 78, 3769 (1997).
- Bernal et al. (1995) O. O. Bernal, D. E. MacLaughlin, H. G. Lukefahr, and B. Andraka, Phys. Rev. Lett. 75, 2023 (1995).
- Miranda et al. (1996) E. Miranda, V. Dobrosavljević, and G. Kotliar, J. Phys. Condens. Matter 8, 9871 (1996).
- Castro Neto et al. (1998) A. H. Castro Neto, G. Castilla, and B. A. Jones, Phys. Rev. Lett. 81, 3531 (1998).
- Castro Neto and Jones (2000) A. H. Castro Neto and B. A. Jones, Phys. Rev. B 62, 14975 (2000).
- Miranda and Dobrosavljević (2001) E. Miranda and V. Dobrosavljević, Phys. Rev. Lett. 86, 264 (2001).
- Trovarelli et al. (2000) O. Trovarelli, C. Geibel, S. Mederle, C. Langhammer, F. M. Grosche, P. Gegenwart, M. Lang, G. Sparn, and F. Steglich, Phys. Rev. Lett. 85, 626 (2000).
- Grosche et al. (2000) F. M. Grosche, P. Agarwal, S. R. Julian, N. J. Wilson, R. K. W. Haselwimmer, S. J. S. Lister, N. D. Mathur, F. V. Carter, S. S. Saxena, and G. G. Lonzarich, J. Phys. Cond. Matt. 12, L533 (2000).
- Petrovic et al. (2001) C. Petrovic, P. G. Pagliuso, M. F. Hundley, J. L. Sarrao, J. D. Thompson, and Z. Fisk, J. Phys.:Condens. Matter 13, L337 (2001).
- Castro Neto (2002) A. H. Castro Neto (2002), private communication.
- Shlyk et al. (2000) L. Shlyk, P. Estela, J. C. Waerenborough, L. E. DeLong, A. de Visser, D. P. Rojas, F. Gandra, and M. Almeida, Physica B 292, 89 (2000).
- A. Schröder et al. (1998) A. Schröder, G. Aeppli, E. Bucher, R. Ramazashvili, and P. Coleman, Phys. Rev. Lett. 80, 5623 (1998).
- Cox (1987) D. L. Cox, Phys. Rev. Lett. 59, 1240 (1987).
- Cox and Zawadowski (1998) D. L. Cox and A. Zawadowski, Adv. Phys. 47, 599 (1998).
- Jarrell et al. (1996) M. Jarrell, H. Pang, D. L. Cox, and K. H. Luk, Phys. Rev. Lett. 77, 1612 (1996).
- Jarrell et al. (1997) M. Jarrell, H. Pang, D. L. Cox, and K. H. Luk, Phys. Rev. Lett. 78, 1996 (1997).
- Estrela et al. (2001) P. Estrela, A. de Visser, F. R. de Boer, T. Naka, and L. Shlyk, Phys. Rev. B 63, 212409 (2001).
- Cox (2002) D. L. Cox (2002), private communication.
- u (33) A displacement parameter =0.082 was obtained, but not reported, in Ref. Shlyk et al., 1999.
- Bucher et al. (1996) J. Bucher, P. G. Allen, N. M. Edelstein, D. K. Shuh, N. W. Madden, C. Cork, P. Luke, D. Pehl, and D. Malone, Rev. Sci. Instrum. 67 (1996).
- Booth (1996) C. H. Booth, Ph.D. thesis, Univ. of California, Santa Cruz (1996).
- Hayes and Boyce (1982) T. M. Hayes and J. B. Boyce, in Solid State Physics, edited by H. Ehrenreich, F. Seitz, and D. Turnbull (Academic, New York, 1982), vol. 37, p. 173.
- Li et al. (1995) G. G. Li, F. Bridges, and C. H. Booth, Phys. Rev. B 52, 6332 (1995).
- (35) eprint http://lise.lbl.gov/RSXAP/.
- Crozier et al. (1988) E. D. Crozier, J. J. Rehr, and R. Ingalls, in X-Ray Absorption: Principles, Applications, Techniques of EXAFS, SEXAFS, XANES, edited by D. Konigsberger and R. Prins (Wiley, New York, 1988), p. 373.
- Booth et al. (1998a) C. H. Booth, F. Bridges, G. H. Kwei, J. M. Lawrence, A. L. Cornelius, and J. J. Neumeier, Phys. Rev. Lett. 80, 853 (1998a).
- Booth et al. (1998b) C. H. Booth, F. Bridges, G. H. Kwei, J. M. Lawrence, A. L. Cornelius, and J. J. Neumeier, Phys. Rev. B 57, 10440 (1998b).
- Kim et al. (2002) J. S. Kim, J. Alwood, D. Mixson, P. Watts, and G. R. Stewart, Phys. Rev. B 66, 134418 (2002).
- Bauer et al. (2001) E. D. Bauer, C. H. Booth, G. H. Kwei, R. Chau, and M. B. Maple, Phys. Rev. B 65, 245114 (2001).