Memory effects on the statistics of fragmentation
Abstract
We investigate through extensive molecular dynamics simulations the fragmentation process of two-dimensional Lennard-Jones systems. After thermalization, the fragmentation is initiated by a sudden increment to the radial component of the particles’ velocities. We study the effect of temperature of the thermalized system as well as the influence of the impact energy of the “explosion” event on the statistics of mass fragments. Our results indicate that the cumulative distribution of fragments follows the scaling ansatz , where is the mass, and are cutoff parameters, and is a scaling exponent that is dependent on the temperature. More precisely, we show clear evidence that there is a characteristic scaling exponent for each macroscopic phase of the thermalized system, i.e., that the non-universal behavior of the fragmentation process is dictated by the state of the system before it breaks down.
pacs:
46.50.+a, 62.20.Mk, 64.60.-iI Introduction
The process of breaking solids into smaller pieces has been the subject of deep thoughts since the time of the Greeks, who tried to understand the building blocks of matter. Not going so far away in time or neither in the area of particle physics, the fragmentation process is still an important problem to study since it is a main issue in current problems in our day-to-day life. For instance, to understand why or how a material breaks is relevant in the development of new technological devices or in geological problems Turcotte86 ; Wittel04 . Because it is such a significant issue, a large number of experiments in fragmentation have been performed in order to collect data of fractures in many types of materials and objects forms Turcotte86 ; Wittel04 ; Oddershede93 ; Meibom96 ; Ishii92 ; Kadono97 . The number of theoretical articles on this topic is no smaller. The main focus of recent studies in this field is based on molecular dynamics (MD) simulations, where the results show an ubiquitous scaling behavior in the distribution of the mass fragments, , with the exponent depending on the dimensionality and initial parameters of the system Oddershede93 ; Meibom96 ; Marsili96 .
The aforementioned experimental and theoretical studies have shown that the mass distribution belongs to the same universality class for large enough input energies when the MD system breaks into smaller pieces Turcotte86 ; Oddershede93 ; Kadono97 ; Inaoka97 ; Katsuragi03 . However, using a molecular dynamics approach Ching et al. Ching99 fragmented an object represented as a set of particles interacting via
the Lennard-Jones potential with the fracture process being induced by
random initial velocities assigned to the particles. The resulting steady-state form found for the cumulative mass distribution displays a typical power-law region, with a non-universal exponent that increases with the total initial energy given to the system. The same behavior has been observed in experimental fragmentation of long glass rods Ching00 and duly interpreted as an indication that the fragmentation process is not a self-organizing phenomenon, contrary to the assumption of Oddershede et al. Oddershede93 s In contrast to the self-organized criticality paradigm where the power law behavior should appear without a control parameter, there is a interesting claim that, in impact fragmentation, criticality could be tuned at a nonzero impact energy Herrmann99 . In this way, the fragment-size distribution should satisfy a scaling form similar to that of the cluster-size distribution of percolation clusters Stauffer , but belonging to another universality class Astrom00 ; Katsuragi03 . From the results of such numerical models
it has been suggested that there exists a critical imparted energy, below which the object to be fragmented is only damaged, and above which it breaks down into numerous smaller pieces. The transition between the damaged to the fragmented states behaves as a critical point, with the fragment size distribution displaying a scaling form similar to that described in percolation theory Stauffer . The same dependence on the impact energy for the fragmented state has been found very recently in another numerical model for the fragmentation of a circular disk by projectiles Behera04 as well as in the experimental fragmentation of shells Wittel04 .
In the present work our aim is to investigate through molecular dynamics simulations the effect of different initial conditions (e.g., temperature and impact energy) on the mass distribution of fragments generated after an “explosion” takes place. One of our goals is to show that the scaling behavior observed in the statistics of mass fragments is non-universal and that this non-universality has a direct correspondence with the state of the system prior to fragmentation process. In Section II we describe the details of the model and simulations. The results are shown in Section III, while the conclusions and some perspectives are presented in Section IV.
II Model
The fragmentation model used here is based on the one described in Refs. Naftaly ; Diehl00 . The initial state of the object to be fragmented is a thermalized configuration generated through a standard molecular dynamics simulation in the microcanonical ensemble. The particles interact with each other through a 6-12 Lennard-Jones pair potential and the system is brought to the desired equilibrium temperature by integration of Newton’s equations of motion Rapaport . A neighbor-list method is applied and periodic boundary conditions are used in all directions. This allows us to simulate up to particles for a single realization of the fragmentation system. The results are then taken from an average of fifty realizations (the direction of the initial velocities for the particles are different for each sample) for a given set of initial conditions, as defined by the value of the temperature, particle density, and energy given to break the MD system apart. This “explosion energy” is specified through the parameter , defined as the ratio between the initial kinetic energy and the initial potential energy of the particle, immediately after the velocities are set according to the equation below
| (1) |
where are the initial velocities and are the initial positions of the particles, obtained in the thermalization stage. The second term in the above equation is responsible for an expansion process that is preceded by an explosive event. The proportionality constant has units of inverse of time and gives a measure of the initial energy imparted to the object. From time zero onward, no energy is added to the system and the particles’ positions and velocities are now calculated considering free boundary conditions. As a result, the system expands and the particles are distributed among clusters (fragments) of different masses. Each particle is considered as a monomeric cluster with unitary mass. There are several definitions for a particle cluster Sator . Here, two particles will belong to the same cluster if they are separated by a distance smaller than an arbitrary cutoff, . The fragments are then classified according to their mass and counted to enable the calculation of the distributions and , both normalized here by the total number of fragments.
III Results
Due to the fluctuations in , it is usually more convenient to work with the cumulative form of the mass distribution defined as Oddershede93
| (2) |
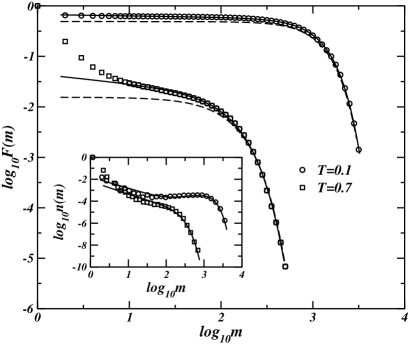
In Fig. 1 we show the behavior of for fixed values of the system density and the parameter , and two different values of the temperature . As can be seen, both distributions display a region of power-law behavior at intermediate values of followed by a typical cutoff due to finite size. From Ref. Diehl02 , the following expression has been proposed to describe the behavior of :
| (3) |
where is a scaling exponent, and and are cutoff parameters. As depicted in Fig. 1 the application of a standard non-linear estimation algorithm to both data sets shows that Eq. (3) fits well the scaling region for intermediate masses as well as the decaying cutoff for large fragment sizes, which is compatible with a stretched exponential behavior. This fitting procedure gives estimates for the scaling exponent that are substantially different, namely, and for and , respectively. There is however a discrepancy between the data and the curve fitted with Eq. (3) at for the region of small fragments. This can be readily explained in terms of the large “evaporation” rates at high values of the temperature – an expected effect that is responsible for the progressive detachment of small clusters from the hull of large and medium fragments after the explosion event. The inset of Fig. 1 shows that the corresponding behavior of the distribution for both values of is also consistent with scaling ansatz Eq. (3), when the parameter used are the same as those obtained for fitting its integral form .
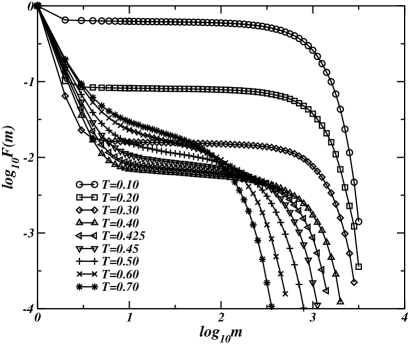
In Fig. 2 we show the profiles of the distribution for several values of the temperature in the range and a fixed value of . When observed in detail, the diversity in shape of for intermediate and large fragment sizes indicate that the fragmentation process must be restricted to a discrete and much smaller number of different classes of behavior than the variation with an entire spectrum of thermalization temperatures could suggest. This fact is quantitatively verified when we observe that, after fitting Eq. (3) to each data set, the scaling parameter can assume one among only three distinct numerical values for the distributions generated at nine different temperatures. In Fig. 3 we show the variation of the cutoff parameter with temperature for . As the temperature increases from , remains approximately constant up to , where it suddenly drops to become again constant, at least up to the maximum value of the temperature we use in our simulations, . This sharp transition in indicates the existence of a “critical” temperature below which a large cluster (i.e., with a size of the order of the system size) can exist.

In Fig. 4 we show the data collapse obtained by rescaling the abscissas of each curve shown in Fig. 3 to its corresponding estimate of the cutoff parameter , as well as rescaling the values to . This results clearly reveal the presence of only three groups of distributions, each one with a characteristic value for the scaling exponent . Such a behavior can be explained with the help of the phase diagram shown in Fig. 5, where the points following the vertical dashed line represent the values of temperature used in our simulations. From this diagram, we readily deduce that the threefold statistics of mass fragments shown in Fig. 4 is a direct consequence of the three distinct phases to which the thermalized objects belonged before they have been broken apart. It is interesting to note that, although the collapses are rather convincing for intermediate and large fragment sizes, the apparent divergence characterizing the statistics of small fragments due to “evaporation” appears to be continuously changing with temperature within each of the three groups of collapsed data.


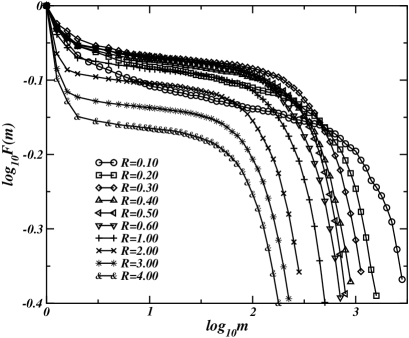
The situation becomes entirely different when we analyze the influence of the energy parameter on the statistics of the fragmentation process. In Fig. 6 we show the distributions computed for MD systems thermalized with temperature , particle density , and for different values of , , , , , , , , , and . From the non-linear fitting of Eq. 3 to each data set we notice that, while the scaling exponent remains approximately constant at , changes significantly with . Precisely, as shown in Fig. 7, the decay of with can be described in terms of a power-law
| (4) |
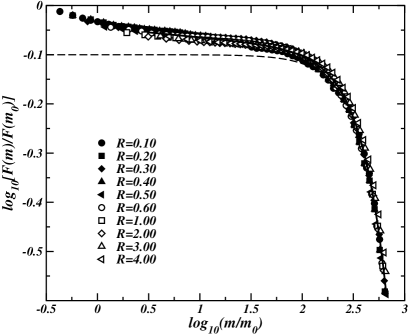
where is a prefactor and the exponent . The parameter is an offset that is related to the competition between the thermal energy of motion and the energy that holds the system together, i.e., the ratio between the kinetic energy and the potential energy just before the velocities are settled according to Eq. 1 and the boundary is lifted. Using Eq. 4 and its estimated parameters to rescale the data presented in Fig. 6, we show in Fig. 8 that the distributions for all values of can be nicely represented by a single data-collapsed curve. Of course, this should only be valid for systems subjected to the same thermalization process, i.e., if and are kept constant.

IV Conclusions
In summary, we performed an extensive study of a two-dimensional fragmentation process through molecular dynamics simulations. Specifically, we have shown how the statistics of the fragmentation process depends on (i) the thermalization temperature of the system before its breakdown, and (ii) the energy imparted to the system to induce fragmentation. In the first case, we verified that the cumulative mass distribution follows a power law for intermediate masses, with an exponent that depends on the region of temperature considered. More precisely, we showed that it is the phase of the thermalized object that is responsible for the difference in these scaling exponents. It means that the process studied here can be rather sensitive to the previous state of the system, although it introduces a significant disturbance from an energetic point of view. As a consequence, fragmentation carries memory. Finally, we turned our attention to the variation of the parameter . Differently to the previous case, we obtained a unique scaling exponent for the cumulative mass distribution for different values of . This result is in good agreement with previous studies in the literature indicating some sort of universal behavior present in fragmentation processes Behera04 .
Acknowledgements.
This work has been supported by CNPq, CAPES and FUNCAP.References
- (1) D. L. Turcotte, J. of Geophys. Res. 91 B2, 1921 (1986).
- (2) F. Wittel, F. Kun, H. J. Herrmann, and B. H. Kröplin, Phys. Rev. Lett. 93, 035504 (2004).
- (3) T. Ishii and M. Matsushita, J. Phys. Soc. Jpn. 61 3474, (1992).
- (4) L. Oddershede, P. Dimon, and J. Bohr, Phys. Rev. Lett. 71, 3107 (1993).
- (5) A. Meibom and I. Balslev, Phys. Rev. Lett. 76, 2492 (1996).
- (6) M. Marsili, and Y.-C. Zhang, Phys. Rev. Lett. 77, 3577 (1996).
- (7) T. Kadono, Phys. Rev. Lett. 78, 1444 (1997).
- (8) H. Inaoka, E. Toyosawa, and H. Takayasu, Phys. Rev. Lett. 78, 3455 (1997).
- (9) F. Kun and H. J. Herrmann, Phys. Rev. E 59, 2623 (1999).
- (10) D. Stauffer and A. Aharony, Introduction to Percolation Theory (Taylor Francis, Philadelfia, 1994).
- (11) J. A. Åström, B. L. Holian, and J. Timonen, Phys. Rev. Lett. 84, 3061 (2000).
- (12) H. Katsuragi, D. Sugino, and H. Honjo, Phys. Rev. E 68, 046105 (2003).
- (13) U. Naftaly, M. Schwartz, A. Aharony, and D. Stauffer, J. Phys. A: Math. Gen. 24, L1175 (1991).
- (14) B. Behera, F. Kun, S. McNamara, and H. J. Herrmann, arXiv:cond-mat/0404057.
- (15) A. Diehl, H. A. Carmona, L. E. Araripe, J. S. Andrade Jr., and G. A. Farias, Phys. Rev. E 62, 4742 (2000).
- (16) A. Diehl, J. S. Andrade Jr., and G. A. Farias, Phys. Rev. E 65, 048102 (2002); J. A. Aström, R. P. Linna, and J. Timonen, Phys. Rev. E 65, 048101 (2002).
- (17) D. C. Rapaport, The Art of Molecular Dynamics Simulation (Cambridge Press, United Kingdom, 1997).
- (18) N. Sator, Phys. Rep. 376, 1 (2003).
- (19) X. Campi, H. Krivine, E. Plagnol, and N. Sator, Phys. Rev. C 67, 044610 (2003).
- (20) F. Kun, and H. J. Herrmann, Phys. Rev. E 59, 2623 (1999).
- (21) X. Campi, H. Krivine, and N. Sator, Physica A 296, 24 (2001).
- (22) E.S.C. Ching, Y.Y. Yiu, and K.F. Lo, Physica A 265, 119 (1999).
- (23) E. S. C. Ching, S. Liu, and K.-Q. Xia, Physica A 287, 83 (2000).