Soft phonons and structural phase transitions in La1.875Ba0.125CuO4
Abstract
Soft phonon behavior associated with a structural phase transition from the low-temperature-orthorhombic (LTO) phase ( symmetry) to the low-temperature-tetragonal (LTT) phase ( symmetry) was investigated in La1.875Ba0.125CuO4 using neutron scattering. As temperature decreases, the TO-mode at -point softens and approaches to zero energy around K, where the LTO – LTT transition occurs. Below , the phonon hardens quite rapidly and it’s energy almost saturates below 50 K. At , the energy dispersion of the soft phonon along in-plane direction significantly changes while the dispersion along out-of-plane direction is almost temperature independent. Coexistence between the LTO phase and the LTT phase, seen in both the soft phonon spectra and the peak profiles of Bragg reflection, is discussed in context of the order of structural phase transitions.
pacs:
74.72.Dn, 71.45.Lr, 61.10.-iI Introduction
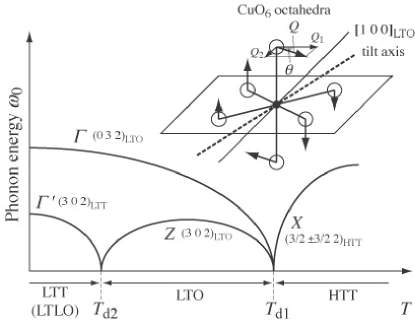
It is well known that La-214 based high- cuprates undergo successive structural phase transitions. On cooling temperature, the second-order phase transition from the high-temperature tetragonal (HTT; ) to the low-temperature orthorhombic (LTO; ) occurs. In some cases, as seen in the La2-xBaxCuO4 (LBCO)Moodenbaugh1988 ; Axe1989 or the La2-x-yNdySrxCuO4 (LNSCO)Crawford1991 systems, further structural phase transitions from the LTO phase to the low-temperature-less orthorhombic (LTLO; ) or to the low-temperature tetragonal (LTT; ) follow the HTT-LTO transition with decreasing temperature. These structural phases can be categorized by the pattern of coherent tilting for CuO6 octahedra. Extensive neutron scattering studies on La2-xSrxCuO4 (LSCO) have revealed that a condensation of zone-boundary soft phonons causes the HTT-LTO structural phase transition, resulting in a staggered tilting of CuO6 octahedraBirgeneau1987 ; Boni1988 ; Thurston1989 . At the HTT-LTO transition, a degenerate pair of TO-phonon at -point wave vectors , associated with the tilting motion of CuO6 octahedra, goes soft and split into two modes at - and -points in the LTO phase. In LSCO system, -point phonon once hardens just below the transition temperature but softens again with decreasing temperature, indicating the structural instability toward the LTO-LTLO or LTO-LTT transitionThurston1989 . Keimer et al. have experimentally shown in La1.65Nd0.35CuO4 that the LTO-LTLO transition is also understood as the ordinary displacive phase transition with the softening of -point phonons, which turns into zone-center phonon in the LTLO phaseKeimer1993 (We call this phonon as -point for the sake of convenience). The summary of the soft phonon behaviors at several structural phases and definitions of order parameter involving {} or {} for the tilting of CuO6 octahedraKimura2004 are schematically shown in Fig. 1.
The relevance between the structural instability and the high- superconductivity has been also studied intensively in these systems. It has been reportedBraden1993 that the evolution of the order parameter of the LTO phase suppressed below in the LSCO of . After that it has been discoveredLee1996 ; Kimura2000 that the softening of -point phonons breaks at in the LSCO of and 0.18. There facts indicate a competition between the LTO-LTLO (or LTO-LTT) structural instability and the high- superconductivity. This competitive relation becomes more apparent in the LBCO and LNSCO systems around 1/8-doping, where the charge stripe
order follows on the LTO-LTT phase transition, resulting in the suppression of superconductivityTranquada1995 ; Tranquada1996 . The motivation of the phonon studies in LBCO system is to clarify the relevance among the low-energy lattice dynamics in the LTT phase, the high- superconductivity, and the charge stripe order.
In the present study, we examined the soft phonon behavior in 1/8-hole doped LBCO for a wide temperature range including the HTT-LTO and the LTO-LTT structural phase transition. Our measurement is a first case which observes the soft phonons associated with the first-order LTO-LTT transition in La-214 system.
II Experimental details
The single crystal of La1.875Ba0.125CuO4 was grown by traveling-solvent floating-zone method. Details in growing the single crystal are described elsewhereFujita2004 . The crystal has a cylindrical shape of which dimension is mm in diameter with 20 mm height. Note that the crystal in the present study is the very same as used in the measurements of spin dynamics related with the charge stripe orderFujita2004 . Diamagnetic susceptibility was measured with SQUID magnetometer, showing no bulk superconductivity down to K. We determined the structural phase transition temperatures for the HTT-LTO (defined as ) and for the LTO-LTT (defined as ) transitions, which is quite sensitive to the Ba concentration in the crystal. Figures 2(a) and (b) are the temperature variations of peak intensities for and Bragg reflections measured with neutron diffraction, which
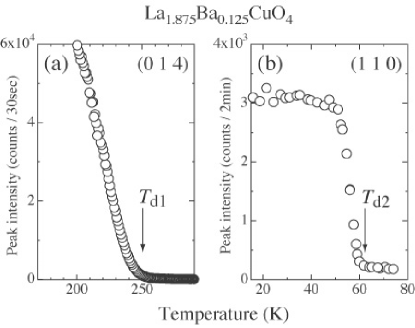
corresponds to the order parameters for the LTO and the LTT phase, respectively. As a result, and were obtained as 250 K and 62 K, respectively, which is almost consistent with the previous resultsAxe1989 . Note that all the Bragg reflections measured at the lowest temperature ( K) had well defined single peak profiles, showing that the crystal structure in the lowest temperature phase is not a orthorhombic but a tetragonal. The lattice parameters obtained at K are Å and Å.
Inelastic neutron scattering measurements of soft phonons were performed at triple-axis spectrometer TOPAN of Tohoku University installed at JRR-3M reactor in Japan Atomic Energy Research Institute (JAERI). The final energy of neutrons was fixed at meV using PG(002) analyzer. The sequences of the horizontal collimations were 40’-30’-30’-60’ and 30’-30’-30’-60’, which yields the energy resolutions of 0.9 meV and 0.8 meV, respectively. A pyrolytic graphite filter and a sapphire cut-off filter were inserted for scattered and incident beam to reduce the higher-order contamination of neutrons. The sample was mounted in the zone. Since the single crystal has twinned domains at the LTO phase, both the and zones are superposed. Throughout this paper, if no specification is given, the reciprocal space is described by the reciprocal lattice unit in the LTO () coordination, of which definitions are consistent with that in the LTT () one. Temperature of the sample is controlled between 16 K and 450 K using 4He-closed-cycle cryostat with high-power heater.
III Results and Discussion
III.1 Soft phonon behavior in wide temperature range
We measured the energy spectra of phonons around , which corresponds to TO-mode at -point in the LTO phase, as a function of temperature and as a function of . All the scans were performed in a constant- mode. Since soft phonons become overdamped in the vicinity of the structural phase transition temperature, we could not obtain a well-defined phonon spectra just at (=-point). Therefore we measured mode and determined the phonon dispersion as a function of temperature.
Typical energy spectra of the phonons at are shown in Fig 4, taken at several temperatures.
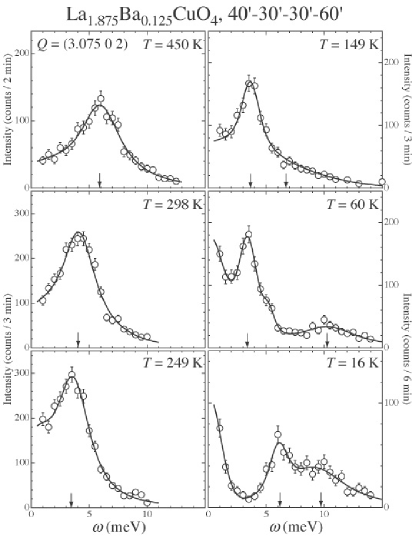
The phonon energy was extracted by fitting the observed spectra with the functions of a dumped harmonic oscillator form and a Gaussian central peak, which convolved with the instrumental resolution. In these fittings, we assumed to be constant within the energy resolution, meaning that the dispersion of phonons was not considered. The solid lines in Fig 4 are the results of fittings, which well reproduce the observed spectra. The arrows in the figures point to the peak positions determined by the fittings. Above ( K), a single phonon peak is clearly seen, which corresponds to the phonon branch from the degenerate -point in the HTT phase. decreases as temperature decreases, indicates that the -point phonon goes soft toward the HTT-LTO phase transtion. Below , in the LTO phase, two phonon peaks appear, showing that the degenerate -point phonon split into a lower energy phonon at -point () and a higher one at -point (). Note that the two phonons are observable simultaneously because of the twinning of and zones in the LTO phase. As seen in the figures, for -point at K increases at K. This indicates that the LTO-LTT structural phase transitions occurs and the -point phonons turn into -point around K, which is consistent with the temperature dependence of super lattice shown in Fig. 2 (b). Figure 4 shows the representative phonon spectra just at , taken below . At K, we cannot see clear phonon peak because of the overdamping of phonons in the vicinity of the structural phase transition. However at K, below , the phonon peak becomes well defined around meV and its phonon energy is almost temperature independent down to 16 K.
Figure 5 shows the summary of soft phonon behaviors as a function of temperature. The phonon energy at , defined as ,
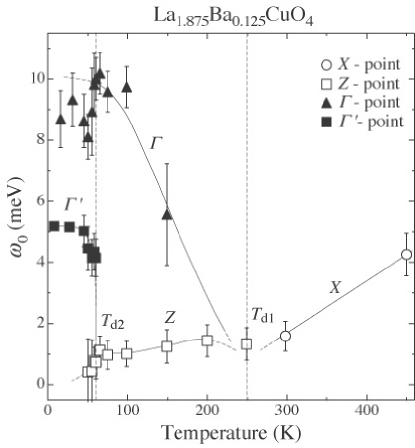
was extrapolated from the dispersion relations of phonons. Note that for -point below 60 K (denoted by filled squares in Fig 4) was directly derived from the phonon spectra. The phonon at degenerate -point (open circles) in the HTT phase goes soft with decreasing temperature and splits into two modes below , which is due to the reduction of crystal symmetry into orthorhombic with space group. Thus these two modes correspond to zone-boundary phonon at -point and zone-center one at -point. On further cooling temperature, the -point phonon (open squares) remains soft and start decreases again in energy while the -point phonon (filled triangles) keeps on hardening with decreasing temperature, indicating that the LTO phase evolves and the lattice instability toward the further structural phase transition increases. These behaviors are qualitatively consistent with that of La2CuO4Thurston1989 . Below K, -point phonon discontinuously hardens and its energy becomes almost temperature independent (filled squares), showing that the LTO-LTT phase transition occurs and the LTT phase becomes robust rapidly. The phonons at -point (denoted by filled triangles) show small anomaly around the transition temperature , which indicates that the fluctuation for the tilt amplitude of CuO6 octahedra was also affected by the LTO-LTT transition. Below , -point becomes zone-center -point and Raman active, because the structural transition from -base centered lattice to primitive lattice occurs. It should be noted that the overall behaviors of soft phonons in the present LBCO is qualitatively consistent with the results for La1.65Nd0.35CuO4, which shows the second order HTT–LTO–LTLO phase transitionsKeimer1993 .
We systematically measured the phonon spectra of and modes as a function of in whole temperature range below 450 K to determine the dispersion relation of the soft phonons.
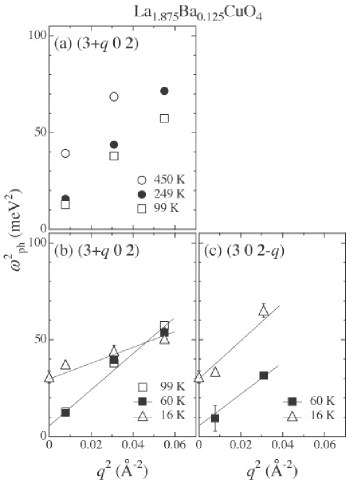
We show the dispersion relation as versus plot because the soft phonon dispersion near a structural phase transition can be expressed as
| (1) |
where , , and are coefficients for -, -, and -axis, respectivelyThurston1989 . Figures 5(a) and (b) show the dispersion of mode and Fig.5(c) shows the dispersion of mode taken at several temperatures. Above 60 K, the slope of the dispersion along -axis is almost temperature independent and was obtained as 1100 meV2Å2, of which value are roughly consistent with that for La1.65Nd0.35CuO4Keimer1993 . Furthermore, as seen in Figs.5(b) and (c), the dispersion at K along -axis is comparable to that along -axis, indicating that the phonons propagate isotropically. However, at K, the slope of dispersion along -axis significantly changes in comparison with that at K, while the the slope of dispersion along -axis almost unchanges between 16 K and 60 K. This interesting feature is characteristic for the LTT structure because the dispersion of the phonon along -axis is temperature-independent near the LTO-LTLO structural phase transitionKeimer1993 in La1.65Nd0.35CuO4. It might be also suggested that the doped carrier makes the phonon velocity along -axis reduced and there exists a possible relation between this modification and the formation of charge stripes in the LBCO system. Further systematic studies for soft phonons in this system are required to address this speculation.
| (K) | (meV2Å2) | |
|---|---|---|
| 60 | 1100 | 1080 |
| 16 | 290 | 1370 |
The coefficients of the dispersion slope and obtained at K and 16 K are listed in Table 1.
III.2 Coexistence between the LTO and the LTT phases
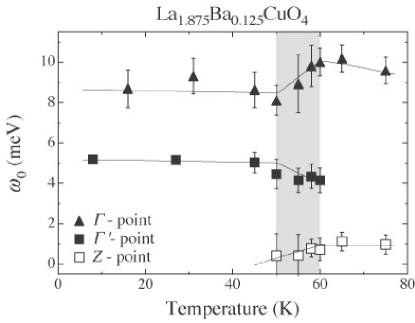
We focus on the detailed transition scheme from the LTO to the LTT phase. Figure 6 is an enlarged figure of Fig. 5 to emphasize the phonon behaviors around . It is clearly seen that the phonon at -point (open squares) coexists with that at -point (filled squares) between 60 K and 50 K, which is seen in a region with a gray hatching in the figure. The figure also shows that the -point phonon discontinuously appears, and the of -point phonon gets close to zero quite rapidly but remains at finite energy below , indicating the incomplete softening due to a first-order LTO-LTT transition. Note that the energy of the -point phonon (filled triangle) gradually decreases with decreasing temperature where the LTO and the LTT phases coexist.
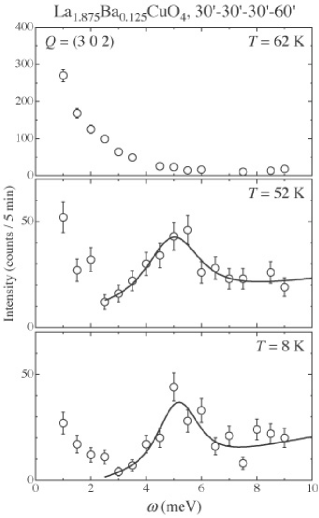
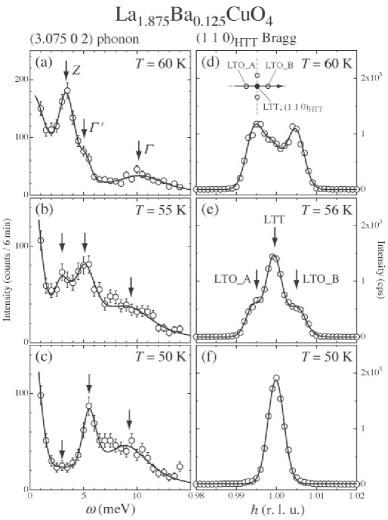
This coexistence is apparently seen not only in the phonon spectra but also in the peak profiles of Bragg reflections. Figure 7 shows phonon spectra and -scan profiles of Bragg reflection taken at three different temperatures between 60 K and 50 K. Mirror index of for Bragg reflection is coordinated as used in the HTT phase, which corresponds to in the LTO coordination. Three peaks are seen in the phonon spectra as shown in Figs. 7(a)-(c). The peaks located at the lowest, medium, and the highest energy correspond to -, -, and -points, respectively. As temperature decreases, the intensity of the phonon for -point decreases whereas that for -point increases, and the -point phonon finally robust at K. The present crystal has four domain in the LTO phase, resulting in the peak splitting into four Bragg points. The geometry of the splitting is illustrated in the inset of Fig. 7(d). At 60 K, as shown in Fig. 7(d), the peak profiles has components of two main peaks from the LTO domains and a minor peak at position which comes from the LTT structure. With decreasing temperature, the central peak increases but two sideward peaks decreases, and finally, the peak at becomes almost dominant at K, of which behaviors has been also reported previouslyBillinge1993 and consistent with the present results for soft phonons. Therefore, we conclude that the LTO phase and the LTT phase competitively coexist and the volume fraction of each phase changes with decreasing temperature.
We finally introduce a simple discussion by the framework of Landau phenomenological theoryAxe1989 ; Ting1990
to understand the nature of the LTO-LTT transition in this system. Axe et al.Axe1989 proposed a free energy near the structural phase transition from the LTO to the LTT (LTLO) phase with the expression of
| (2) |
where near . and represent the amplitude of displacement and the rotation angle from -axis for CuO6 octahedra, which is defined in the inset of Fig. 1. In this model, and correspond to the LTO and the LTT phase, respectively, and, in the case of , the LTLO phase appears. Since the order parameter , which corresponds to the tilt amplitude of CuO6 octahedra, is almost temperature independent in the vicinity of , the free energy can be regarded as a function of only . When , Eq. 2 has one local minimum at below and the second-order phase transition from the LTO to LTLO phase occurs. On the other hand, for , two local minimums at and appear in Eq. 2 and the first order LTO-LTT transition occurs, suggesting that the two phases can be coexist near . Our present results and the previous studyKeimer1993 of La1.65Nd0.35CuO4 show the validity of this simple model.
IV Conclusion
The present study has confirmed the soft phonon behavior of La1.875Ba0.125CuO4 in the wide temperature range including the HTT–LTO and the LTO–LTT structural phase transitions, which can be totally understood by soft-mode transitions. The dispersion relation of phonons along -axis suddenly changes below while that along -axis is independent of temperature, which might be characteristic in the LTT structure. The coexistence of the LTO and the LTT phase observed in both the phonon spectra and the Bragg peak profiles can be understood as the consequence of the first order structural phase transition in the frame work of Landau theory. The relevance between the change of the phonon velocity along -axis in the LTT phase and the formation of charge stripe order should be clarified in the near future.
Acknowledgements.
The authors thank J. M. Tranquada, M. Hücker and S. Wakimoto for invaluable discussions. The neutron scattering experiments at JAERI was performed under the PACS No. 4474 and 4501. This work was supported in part by a Grant-In-Aid for Young Scientists B (15740194), Scientific research B (14340105), Scientific Research on Priority Areas (12046239), and Creative Scientific Research (13NP0201) from the Japanese Ministry of Education, Science, Sports and Culture, and by the US-Japan cooperative research program on Neutron scattering. Work at Brookhaven National Laboratory is supported by Division of Material Science, U. S. Department of Energy.References
- (1) A. R. Moodenbaugh, Youwen Xu, M. Suenaga, T. J. Follcerts, and R. N. Shelton, Phys. Rev. B 38, 4596 (1988).
- (2) J. D. Axe, A. H. Moudden, D. Hohlwein, D. E. Cox, K. M. Mohanty, A. R. Moodenbaugh, and Youwen Xu, Phys. Rev. Lett. 62, 2751, (1989).
- (3) M. K. Crawford, R. L. Harlow, E. M. McCarron, W. E. Farneth, J. D. Axe, H. Chou, and Q. Huang, Phys. Rev. B 44, 7749 (1991).
- (4) R. J. Birgeneau, C. Y. Chen, D. R. Gabbe, H. P. Jenssen, M. A. Kastner, C. J. Peters, P. J. Picone, Tineke Thio, T. R. Thurston, H. L. Tuller, J. D. Axe, P. Böni, and G. Shirane, Phys. Rev. Lett. 59, 1329, (1987).
- (5) P. Böni, J. D. Axe, G. Shirane, R. J. Birgeneau, D. R. Gabbe, H. P. Jenssen, M. A. Kastner, C. J. Peters, P. J. Picone, and T. R. Thurston, Phys. Rev. B 38, 185 (1988).
- (6) T. R. Thurston, R. J. Birgeneau, D. R. Gabbe, H. P. Jenssen, M. A. Kastner, P. J. Picone, N. W. Preyer, J. D. Axe, P. Böni, G. Shirane, M. Sato, K. Fukuda, and S. Shamoto, Phys. Rev. B 39, 4327 (1989).
- (7) B. Keimer, R. J. Birgeneau, A. Cassanho, Y. Endoh, M. Greven, M. A. Kastner, and G. Shirane, Z. Phys. B 91, 373 (1993).
- (8) and corresponds to displacements along - and -axis in the LTO phase, which arises from the tilting of CuO6 octahedra. can be defined as the vectorial sum of and with phase angle . In this definitions, can be regarded as the angle between -axis of the LTO phase and the tilt axis of CuO6 octahedra, and corresponds to the rotation amplitude around the tilt axis.
- (9) M. Braden, O. Hoffels, W. Schnelle, B. Büchner, G. Heger, B. Hennion, I. Tanaka, and H. Kojima, Phys. Rev. B 47, 12288 (1993).
- (10) C. H. Lee, K. Yamada, M. Arai, S. Wakimoto, S. Hosoya, and Y. Endoh, Physica C 257, 264 (1996).
- (11) H. Kimura, K. Hirota, C. H. Lee, K. Yamada, and G. Shirane, J. Phys. Soc. Jpn. 69, 851 (2000).
- (12) J. M. Tranquada, B. J. Sternlieb, J. D. Axe, Y. Nakamura, and S. Uchida, Nature 375, 561 (1995).
- (13) J. M. Tranquada, J. D. Axe, N. Ichikawa, Y. Nakamura, S. Uchida, and B. Nachumi, Phys. Rev. B 54, 7489 (1996).
- (14) M. Fujita, H. Goka, K. Yamada, J. M. Tranquada, and L. P. Regnault, Phys. Rev. B in press (cond-mat/0403396).
- (15) S. J. L. Billinge, G. H. Kwei, A. C. Lawson, and J. C. Thompson, Phys. Rev. Lett. 71, 1903, (1993).
- (16) W. Ting, K. Fossheim, and T. Lægreid, Solid State Comm., 75, 727 (1990).