Strain phase diagram and domain orientation in SrTiO3 thin films
Abstract
SrTiO3 thin films were used as a model system to study the effects of strain and epitaxial constraint on structural phase transitions of perovskite films. The basic phenomena revealed will apply to a variety of important structural transitions including the ferroelectric transition. Highly strained SrTiO3 films were grown on different substrates, providing both compressive and tensile strain. The measured strain-temperature phase diagram is qualitatively consistent with theory, however the increase in the phase transition temperature is much larger than predicted. Due to the epitaxial strain and substrate clamping, the SrTiO3 lattice is tetragonal at all temperatures. The phase transitions involve only changes in internal symmetry. The low temperature phase under tensile strain has a unique structure with orthorhombic space group but a tetragonal lattice, an interesting consequence of epitaxial constraint.
An important area of research in recent years has been to understand exactly why the properties of epitaxial films differ from related bulk materials, and to learn how to use these differences to engineer desirable properties. Effects due to strain in films are often thought of as analogous to those of high pressure experiments. The main differences are: (1) The stress in films is typically biaxial rather than hydrostatic or uniaxial. (2) Films are subject to the additional constraint from the substrate. (3) Films can have much larger strains than is usually achievable in pressure cells. (4) Films are easier to work with for many experiments and applications. Ferroelectricity in strained perovskite films has been a particularly noteworthy topic of study. For example, recent experiments have shown strain-induced ferroelectricity in SrTiO3 (STO) films, and huge changes in the ferroelectric transition temperature in both SrTiO3 and BaTiO3 (BTO) films under strain Haeni et al. (2004); Choi et al. (2004). Other notable results include large changes in the metal-insulator transition temperature of RNiO3 films under strain Tiwari et al. (2002) and reports of increasing the transition temperature of La2-xSrxCuO4 under compressive strain Sato and Naito (1997); Locquet et al. (1998); Si et al. (1999); Bozovic et al. (2002).
In this letter, we present a systematic investigation of the structural phase transition in epitaxial STO films with varying degrees of both compressive and tensile strain. This transition is not ferroelectric, though it has been described by the same theory as used for the ferroelectric transition in STO Pertsev et al. (2000) and referenced in the works above. We construct a strain-temperature phase diagram for this transition with several data points over a wide range of strain. The observed enhancement of the structural phase transition temperature , is much greater than predicted by theory, though in many aspects the theoretical predictions are qualitatively correct. We also note that in some cases the film structures have unique symmetry not possible in a free bulk system.
We chose the anti-ferrodistortive structural phase transition in STO as a model system for phase transitions in epitaxial films. The principal advantage of this system is that both the primary and secondary order parameters are directly accessible through x-ray diffraction measurements He et al. (2004), as explained below. This is in contrast to the ferroelectric phase transition in materials such as BTO where the primary order parameter is the polarization, which is best detected by electrical measurements. However, these phase transitions are similar in many ways: the variation of lattice constant is a secondary order parameter for both, changes in critical temperature with strain vary in a similar manner, and similar domain orientations are present in the low symmetry phases.
Bulk STO crystal is cubic at room temperature, with space group . Below 105 K it becomes tetragonal with symmetry. This phase transition involves the rotation of TiO6 octahedra, and the rotation angle has been identified as the order parameter for this phase transition Müller et al. (1968). In terms of the pseudo-cubic unit cell, the tetragonal phase has additional superlattice peaks at half integer index positions. The intensities of the superlattice peaks are proportional to the square of the order parameter and can be used to track the phase transition. A secondary order parameter is the tetragonality, which in the bulk is coupled to the octahedra rotation.
For a second-order structural phase transition, usually the volume of the unit cell changes smoothly through the transition temperature, but lattice parameter versus temperature curves have a sudden change in slope. This is the case for bulk STO Lytle (1964); Alefeld (1969). For epitaxial films the in-plane lattice parameters are subject to lateral constraint from the substrate and therefore do not have the freedom to change as in bulk. In previous studies we have discussed the effect of strain and substrate clamping on several film systems, noting that this substrate clamping effect is often described in too simplistic a manner He et al. (2004, 2003).
The STO films studied were grown on four kinds of substrates: SrLaAlO4 (SLAO), LaAlO3 (LAO), (LaAlO3)0.3(Sr2LaTaO6)0.7 (LSAT) and KTaO3 (KTO). All substrates are 0 0 1 oriented single crystals. The mismatch between STO and these substrates ranges from -3.82% for SLAO to +2.15% for KTO. Pulsed laser deposition (PLD) was used to grow the films. The energy density of the KrF excimer laser was about 1J/cm2. The films were grown at 720℃ in 100 mTorr O2, with thickness ranging from 7 nm to 90 nm. X-ray diffraction showed excellent epitaxy with average mosaics around 0.1 degrees and no detectable misoriented regions.
X-ray diffraction measurements were carried out at beamline X22A at the National Synchrotron Light Source, Brookhaven National Laboratory. X22A has a bent Si(1 1 1) monochromator, giving a small beam spot and fixed incident photon energy of 10 keV. The angular resolution with a graphite (0 0 2) analyzer was less than 0.006° FWHM for an (0 0 2) peak, as measured from the LAO substrate. Below room temperature the sample was cooled in a closed cycle refrigerator with a temperature control of 0.5°.
| STO | STO Lattice Par. (nm) | In-plane | |||
| Thickness | Substrate | Strain111Positive – tensile strain, negative – compressive strain. | |||
| 7 nm | SLAO | 0.3887 | 0.3921 | -0.46% | |
| 35 nm | SLAO | 0.3886 | 0.3934 | -0.49% | |
| 10 nm | LAO | 0.3884 | 0.3922 | -0.54% | |
| 90 nm | LAO | 0.3888 | 0.3935 | -0.44% | |
| 7 nm | LSAT | 0.3864 | 0.3924 | -1.04% | |
| 35 nm | LSAT | 0.3871 | 0.3951 | -0.86% | |
| 7 nm | KTO | 0.3984 | 0.3878222 axis is out-of-plane for films under tensile strains. | 0.3984 | +2.03% |
| 20 nm | KTO | 0.3971 | 0.3879222 axis is out-of-plane for films under tensile strains. | 0.3973 | +1.72% |
Table I shows the lattice parameters of STO films on various substrates, by measuring several Bragg peaks at room temperature. The random measurement errors in lattice parameters are less than 0.00005 nm, though systematic errors may be larger. The in-plane biaxial strain is defined as , where is the lattice parameter of bulk STO (0.3905 nm), and is the average of the lattice parameters along two in-plane axes in the strained films. On KTO substrate, we obtained very large tensile strain in 7 nm STO films. The in-plane lattice parameters are almost equal to KTO value, resulting in an in-plane strain of +2.03%. The out-of-plane lattice parameters shrinks to 0.3878 nm. The 20 nm sample shows partial relaxation, with in-plane strain of +1.7%.
The films on LSAT substrates show largest compressive strain. Due to the small mismatch between STO and LSAT, even the 35 nm film is pseudomorphic with LSAT. Unfortunately, LSAT exhibits face-centered-cubic type ordering Li et al. (2003), which results in additional peaks at half integer positions. This makes following the STO superlattice peaks impossible. Because of the large mismatch, even very thin films on SLAO or LAO substrates are already partially relaxed. The residual compressive strain within the STO layer is around -0.5% for both substrates. The phase transitions in 10 nm and 90 nm STO / LAO samples were investigated.
The tetragonality, , of the STO unit cell does not change dramatically through the whole temperature range. This is consistent with our previous observations He et al. (2003, 2004). The tetragonality in all our films is considerably larger than in bulk.
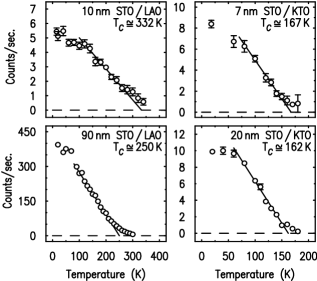
Fig. 1 shows the temperature dependence of one of the half-integer superlattice peaks associated with the low temperature phase of STO. Results from several different films are shown. The STO films also have a phase transition with similar internal symmetry change as seen in the bulk. The transition temperature is enhanced under conditions of both tensile and compressive strain. A much larger enhancement is present for compressive strain.
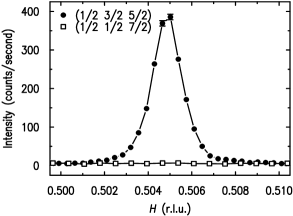
The tetragonal bulk phase of STO (space group ) is characterized by the rotation of the TiO6 octahedra around the -axis. The appropriate selection rules denote some peaks such as (1/2 1/2 7/2) as forbidden, while (1/2 7/2 1/2) and (7/2 1/2 1/2) peaks are permitted. We can use the selection rules to determine the domain orientation in the films. However, in the following we continue to follow the standard practice of denoting the direction normal to the surface as 0 0 1. We refer to the unique tetragonal axis as merely the axis of rotation. Fig. 2 shows the relevant peaks for one of the STO films on LAO, the standard case for compressive strain. The (1/2 1/2 7/2) peak is missing. This indicates that the axis of rotation coincides with the normal to the plane. This is not surprising since in bulk STO, the axis of rotation is longer than the others. And in the case of compressive strain, epitaxial strain forces the out-of-plane axis to be longer than the in-plane axes. Further, this means that the films are single domain and have space group as in the bulk. The high temperature phase does differ from the bulk in that it is tetragonal rather than cubic, thus having space group . The phase transition in this case is from a high temperature, high symmetry tetragonal phase () to a low temperature, low symmetry tetragonal phase ().
The films under tensile strain have a somewhat more interesting morphology. All peaks of the type (1/2 1/2 7/2), (1/2 7/2 1/2), and (7/2 1/2 1/2) are present. This indicates at least two domain orientations. Due to the tensile strain, and the fact that the rotation axis is the longer in the bulk, the most likely orientations are with the rotation axis along each of the primary in-plane directions. Thus there is a 90° twin structure. As far as we can measure, the two in-plane lattice constants remain identical regardless of the orientation of the rotation axis. Thus we have a very unique morphology for the low temperature phase. The most likely space group is orthorhombic . This space group is a subgroup of , but lacks the 4-fold axis. It also permits unequal dimensions along all three directions. The lattice itself appears to be tetragonal in that . This situation is fundamentally allowed since the space group refers only to symmetry operations and not the shape of the unit cell itself. The existence of a phase with an orthorhombic space group but a tetragonal lattice is an interesting consequence of strain and substrate clamping. We do not believe that such a situation is possible in a free crystal. In this case the phase transition is from the same high temperature, high symmetry tetragonal phase () to a low temperature, orthorhombic phase ().
The orientation of the unique axis below is quite similar to the ferroelectric polarization in the recently reported electric measurements on similar films Haeni et al. (2004). Similar symmetry considerations will apply. It is also possible that in STO the two phase transitions are intimately coupled, thus it will be interesting to investigate the relationship between the two.
Our data allows us to construct the strain phase diagram for STO thin films. The new points reported in this letter extend the range of strain considerably in both compressive and tensile directions, as shown in fig. 3, where high symmetry tetragonal, low symmetry tetragonal and orthorhombic phases are labelled HT, LT and LO respectively. For tensile strain, the experimental data show rapid increase of over the small strain regime. Then stabilizes at about 160170 K for larger strain up to 2%. For compressive strain, the increase rapidly even for relatively small strain. A 0.5% compressive strain results in a over 200 K higher than bulk value, reaching room temperature region.
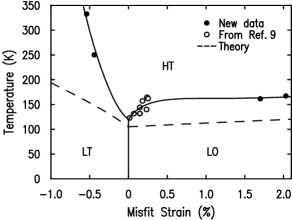
A theoretical investigation of this phase transition in epitaxial films has been performed by Pertsev et al. Pertsev et al. (2000). Our data corresponds to the structural part of their phase diagram, designated by Pertsev as HT/SO and HT/ST transition, while Ref. Haeni et al., 2004 reflects the ferroelectric part. Our result is qualitatively consistent with the theory in many aspects. The domain structures we measured for both compressive and tensile strain were predicted correctly. In addition, the general trend in the variation of the transition temperature with strain occurs much as predicted. The rises for both strains, though compressive strain causes a much larger increase than does tensile strain. The major difference between the data and theory is that the magnitude of the rise in is much larger than predicted. In addition, the shape of the actual versus strain curves deviates from the nearly-linear prediction.
We have analyzed this result in terms of the theory of Pertsev et al., where is calculated from the ralationship using equation (3) in Ref. Pertsev et al., 2000. Trying to fit the data to this form but allowing the materials parameters to float would result in unreasonable values of the elastic constants. It is possible that a more complicated coupling term must be included in a proper theory. However, we note that the amount of strain in our films is much larger than is achieved in measurements of bulk elastic constants. For such large strains, the elastic response may no longer be linear. We would expect that compression would become more difficult at large strains but tension easier, due to the fundamental nature of atomic interactions. It appears that such variation of the elastic constants would allow for an expression similar to Pertsev’s to match our data He et al. , though a proper theory needs to be constructed.
In conclusion, highly strained SrTiO3 films were obtained on different substrates. Under compressive strain, the phase transitions in STO films are from high symmetry tetragonal to low symmetry tetragonal, while under tensile strain, the transitions are from high symmetry tetragonal to orthorhombic. The effects of strain and substrate clamping induces structures in epitaxial films that are not possible for bulk materials. The structural phase transition temperature is enhanced by both compressive strain and tensile strain. Many aspects of the strain-temperature phase diagram are well described by current theory though improvements are necessary to describe the magnitude of the increase in transition temperature.
We acknowledge S. P. Alpay and B. Misirlioglu for helpful discussion. This material is based upon work supported by the National Science Foundation under Grant No. DMR-0239667 (BW, FH). BW thanks the Cottrell Scholar Program of the research corporation for partial support of this work. Work at Brookhaven is supported by Division of Material Sciences, U.S. Department of Energy under contract DE-AC02-98CH10886.
References
- Haeni et al. (2004) J. H. Haeni, P. Irvin, W. Chang, R. Uecker, P. Reiche, Y. L. Li, S. Choudhury, W. Tian, M. E. Hawley, B. Craigo, et al., Nature 430, 758 (2004).
- Choi et al. (2004) K. J. Choi, M. Biegalski, Y. L. Li, A. Sharan, J. Schubert, R. Uecker, P. Reiche, Y. B. Chen, X. Q. Pan, V. Gopalan, et al., Science 306, 1005 (2004).
- Tiwari et al. (2002) A. Tiwari, C. Jin, and J. Narayan, Appl. Phys. Lett. 80, 4039 (2002).
- Sato and Naito (1997) H. Sato and M. Naito, Physica 274C, 221 (1997).
- Locquet et al. (1998) J.-P. Locquet, J. Perret, J. Fompeyrine, E. Mächler, J. W. Seo, and G. V. Tendeloo, Nature 394, 453 (1998).
- Si et al. (1999) W. Si, H.-C. Li, and X. X. Xi, Appl. Phys. Lett. 74, 2839 (1999).
- Bozovic et al. (2002) I. Bozovic, G. Logvenov, I. Belca, B. Narimbetov, and I. Sveklo, Phys. Rev. Lett. 89, 107001 (2002).
- Pertsev et al. (2000) N. A. Pertsev, A. K. Tagantsev, and N. Setter, Phys. Rev. B 61, R825 (2000).
- He et al. (2004) F. He, B. O. Wells, Z. G. Ban, S. P. Alpay, S. Grenier, S. M. Shapiro, W. Si, A. Clark, and X. X. Xi, Phys. Rev. B 70, 235405 (2004).
- Müller et al. (1968) K. A. Müller, W. Berlinger, and F. Waldner, Phys. Rev. Lett. 21, 814 (1968).
- Lytle (1964) F. W. Lytle, J. Appl. Phys. 35, 2212 (1964).
- Alefeld (1969) B. Alefeld, Z. Phys. 222, 155 (1969).
- He et al. (2003) F. He, B. O. Wells, S. M. Shapiro, M. v. Zimmermann, A. Clark, and X. X. Xi, Appl. Phys. Lett. 83, 123 (2003).
- Li et al. (2003) H. Li, L. Salamanca-Riba, R. Ramesh, and J. H. Scott, J. Mater. Res. 18, 1698 (2003).
- (15) F. He, B. O. Wells, B. Misirlioglu, S. P. Alpay, and S. M. Shapiro, unpublished.