Vortex State of Tl2Ba2CuO6+δ via 205Tl NMR at 2 Tesla
Abstract
We report a 205Tl NMR study of vortex state for an aligned polycrystalline sample of an overdoped high- superconductor Tl2Ba2CuO6+δ (85 K) with magnetic field 2 T along the axis. We observed an imperfect vortex lattice, so-called Bragg glass at =5 K, coexistence of vortex solid with liquid between 10 and 60 K, and vortex melting between 65 and 85 K. No evidence for local antiferromagnetic ordering at vortex cores was found for our sample.
pacs:
74.25.Nf, 74.72.Jt, 76.60.-kI Introduction
Coexistence of magnetism with the mixed state of type-II superconductors has attracted great interests [1]. Nearly antiferromagnetic spin fluctuation close to the quantum critical point has been a key to understand the magnetic correlation of high- superconductors. Such an underlying magnetic correlation may affect the local electronic structure at vortex cores.
Tl2Ba2CuO6+δ (Tl2201) is an overdoped high- superconductor. The optimal is about 85 K for a reduced oxygen content. The early studies by Tl NMR with 4.26 T [2] and Cu NMR with 7 T [3] for Tl2201 reported an obvious Redfiled pattern due to the vortex lattice. Although the magnetic ordering in the mixed state is not expected for Tl2201, because it is a typical overdoped electronic system away from antiferromagnetic instability [4], the recent Tl NMR study with 2.1 T shows coexistence of local antiferromagnetic ordering at the vortex cores [5]. The specific characteristics of Tl2201 are cation disorder on the Tl site [6] and magnetic field dependence of the elementary excitations [7, 8, 9]. Disorder makes the vortex phase rich [10]. The effect of these characteristics on the antiferromagnetic vortex core is poorly understood.
In this paper, we studied the vortex state of an overdoped high- superconductor Tl2201 (85 K) with magnetic field of 2 T along the axis using a 205Tl NMR spin-echo technique. We observed a Redfield pattern of the 205Tl NMR spectrum at 5 K due to the vortex lattice state without static antiferromagnetic order at the vortex cores.
II Experiments
The powder sample in the present study is the same one as in the previous study [4], which was mixed with Stycast 1266 epoxy and magnetically aligned along the axis.
A phase-coherent-type pulsed spectrometer was utilized to perform the 205Tl NMR (spin =1/2) experiments. All the measurements were done with magnetic field cooling. The NMR frequency spectra with quadrature detection were obtained by integration of the nuclear spin-echoes with frequency . The width of the first exciting /2-pulse was 4 s (the excited frequency region 63 kHz). Because of no fine structure but moderately broad NMR spectra, high spectral resolution [11] was not required in the present measurements.
The nuclear spin-lattice relaxation curves (recovery curves) were measured by an inversion recovery technique, as functions of a time after an inversion pulse, where the nuclear spin-echo amplitude , and were recorded. In contrast to the previous study [5], the comb pulse train was not needed. The measurement of was necessary to determine the function form of .
III Results and discussion
A NMR spectrum
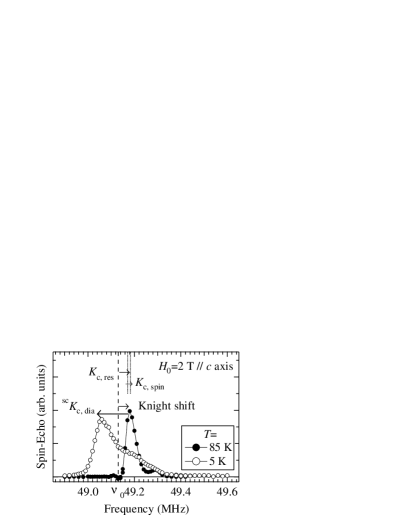
Figure 1 shows 205Tl NMR spectra with magnetic field of =2 T along the axis at =85 and 5 K. The bare resonance line given by (=24.567 MHz/T) is denoted by the dash line. Above , the full width at half maximum of the spectrum is about 50 kHz, being nearly the same as the reported one [5]. The linewidth can be considered to result from a staggered spin susceptibility (the second moment) and from a Knight shift distribution (the first moment). The enhancement of the static staggered spin susceptibility along the axis is estimated from the 63Cu nuclear spin-spin relaxation rate 1/ [12].
The 205Tl Knight shift is understood by the sum of the spin shift due to the Cu-to-Tl supertransferred hyperfine coupling and the temperature-independent due to residual spin density polarization [9]. Below , the spectrum peak is largely shifted into the negative shift side (low frequency region), while the tail is still in the positive shift side (high frequency region). Since for a singlet -wave superconductor, local density of states of electrons is suppressed away from vortex cores but recovers at the cores [13], then we expect that a Redfield pattern of the spin shift due to the electron density of states affects the NMR spectrum. However, the observed negative shift indicates that a Redfield pattern of a superconducting diamagnetic shift is predominant.
The =5 K NMR spectrum resembles the field distribution due to a slightly distorted vortex lattice [14, 15] but not a Gaussian due to amorphous vortex or vortex glass. We could not deduce from the NMR spectrum which the vortex lattice is, triangular or square.
The peak frequency can be assigned to the saddle point (S) in the field distribution of vortices, the highest frequency edge to the vortex core (V), and the lowest frequency edge to the minimum field position (C) mostly away from the vortex cores [13, 16]. Site-selective NMR is possible for our sample.
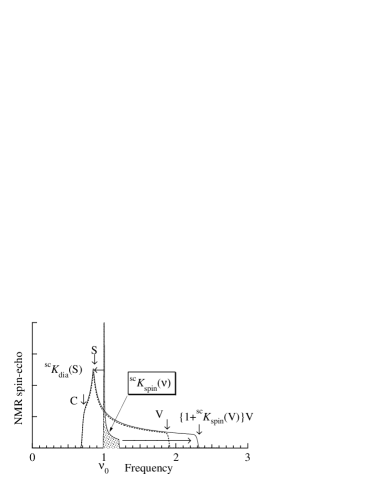
In Fig. 1, the Knight shift at the vortex core V at 5 K is nearly the same as or larger than the normal shift at 85 K. An external magnetic field is squeezed at the vortex core. We notice that the squeezed magnetic flux density at the core yields a higher magnetic field than an applied external field, so that the shift at the core-site V can be larger than the normal shift. Using the additional positive vortex core shift (V) due to the enhanced field and the negative shift (C)0 due to the diamagnetic field, we obtain
| (1) |
with (V) () [13], while
| (2) |
These are illustrated in Fig. 2. A part of the NMR signals at 49.18 MHz is due to the combined effect of magnetic flux squeezing and of the finite positive spin shift at the vortex core. To our knowledge, no one has ever pointed out the importance of this effect.
No signal above 49.4 MHz at 5 K, that is, no evidence for the local antiferromagnetic ordering effect at the vortex cores was found for our sample. The difference in imperfection or in the crystal symmetry [6] may affect the local order.
B Nuclear spin-lattice relaxation
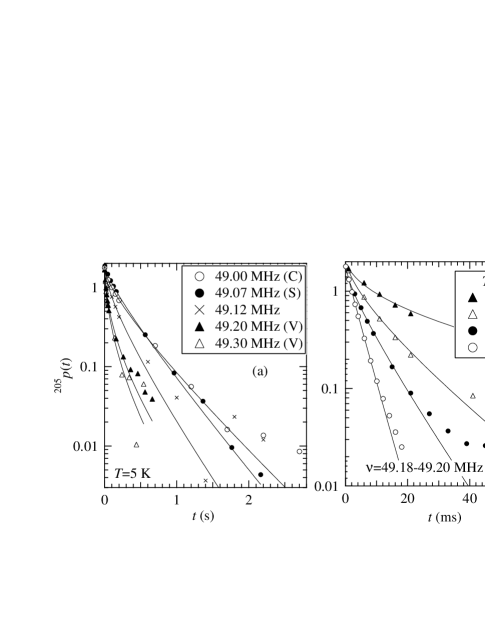
Figure 3(a) shows frequency distribution of the recovery curves at 5 K. The recovery curve is close to an exponential function at the peak frequency (S) but nonexponential at lower and higher frequency sides. These results remind us of the in-plane impurity-substitution effect [17]. The nuclear moments close to an impurity show nonexponential relaxation, because of random impurity distribution.
Figure 3(b) shows temperature dependence of the recovery curve at =49.18-49.20 MHz. One can see nonexponential curves below 30 K and a nearly exponential one at 40 K.
The solid curves in Fig. 3 are the least-squares fitting results by
| (3) |
where , and are the fitting parameters. Equation (3) is derived from an impurity-induced NMR relaxation theory [18]. is a nuclear spin-lattice relaxation time due to quasi-particle scattering or homogeneous relaxation process, whereas is an induced relaxation time due to random distribution of impurity relaxation centers. Since there are no literal localized moments, the finite may result from an extended staggered spin fluctuation around the vortex core [19], Friedel oscillation around the core [20], or thermal vortex motion [21].
For breakdown of the site-selective NMR, the recovery curve of the nuclear magnetization is nonexponential in the mixed state [21]. In the case that the magnetic penetration depth is too long, a sharp NMR line with hierarchical components is observed and then the site-selective NMR does not work. The second moment of the NMR spectrum in the vortex lattice, a guide to broadening, is given by
| (4) |
where is the field distribution around the peak [22]. For deeply underdoped and heavily overdoped superconductors, the long ’s are estimated [23]. For our sample, the observed Redfield pattern indicates a short . Thus, we suppose one-to-one correspondence of the site to the frequency shift.
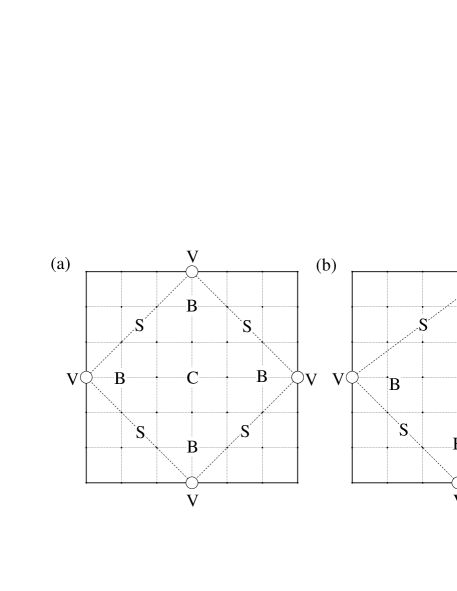
Let us briefly discuss the reason why the relaxation curve is nonexponential in spite of site selection in NMR. Figure 4(a) illustrates a perfect square lattice of vortices on a CuO2 plane for convenience. The recovery curve at any nuclear site in Fig. 4(a) must be an exponential function, even if local moments or local staggered moments are induced at the vortex cores. For example, the vortex configurations around all the B sites in Fig. 4(a) are the same, so that all the recovery curves of the B-site nuclei would become the same. However, we observed the nonexponential recovery curves at the selected sites. Thus, the vortex lattice is not perfect. One may call it Bragg glass [24]. Figure 4(b) illustrates an imperfect vortex lattice with weak disorder. The vortex configuration around the B site in Fig. 4(b) is not unique, so that the assemble average on the vortex distribution leads to nonexponential relaxation.
C Coexistence of vortex solid with liquid
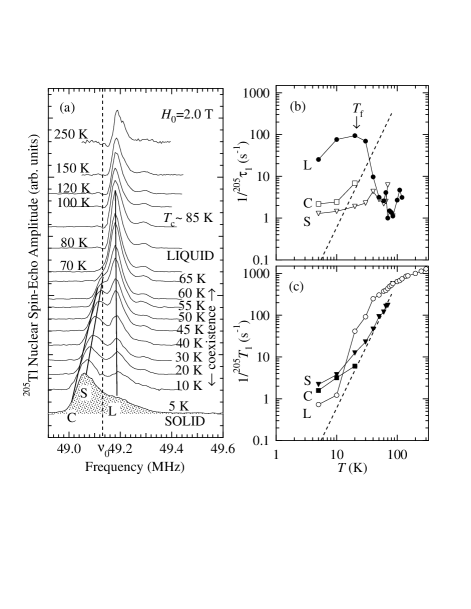
Figure 5(a) shows 205Tl NMR spectra with magnetic field cooling. The narrow NMR lines between =85 K and =65 K indicate motional narrowing effect, that is, vortex melting. The NMR spectra between =60 and 10 K are composed of two peaks with a negative and a positive Knight shifts. These peaks indicate coexistence of the vortex solid with liquid, that is, partial melting. At =5 K, the Redfield pattern indicates the vortex lattice. The similar, but narrow, coexistence region was first reported for YBa2Cu3O7 [25, 26]. The detailed measurement of vortex phase is in progress for our Tl2201 sample.
Figures 5(b) and 5(c) show 1/ and 1/ as functions of temperature at C, S, and L on the solid lines in Fig. 5(a). In Fig. 5(b), the peak behavior of 1/ at L is observed at =20 K. Since the signal L comes from the vortex liquid in the coexistence region, the peak behavior indicates slowing down of vortex motion toward freezing. This is not due to the local antiferromagnetic ordering around vortex cores. is close to the irreversibility line [27]. The temperature dependence of 1/ at C and S in Fig. 5(c) can be understood by the spatial dependence of local density of states of electrons [13].
More than ten years have passed since our sample was synthesized. The vortex phase is sensitive to crystalline imperfection. The aging effect, e.g. oxygen redistribution, might realize the solid-liquid coexistence. The effect, however, does not cause distribution in our sample. We exclude a possibility that the signal L is a lower- part of the sample. The magnetic susceptibility does not exhibit distribution. The Cu nuclear quadrupole resonance spectrum at =4.2 K, which is sensitive to the oxygen distribution, is still similar to the previous report [28]. The temperature dependence of 1/ of the signal L is not conventional behavior of superconducting onset.
IV Conclusion
To conclude, we observed a vortex lattice with weak disorder for our sample Tl2201 (85 K) with 2 T at 5 K, coexistence of vortex solid with liquid (=10-60 K), and vortex liquid (=65-85 K), but not the local antiferromagnetic ordering at the vortex cores.
Acknowledgements.
We thank A. Goto for fruitful discussion, and M. Kato and T. Waki for experimental supports. This was supported by a Grant-in-Aid on priority area ”Novel Quantum Phenomena in Transition Metal Oxides,” from Ministry of Education, Science, Sports and Culture (12046241).REFERENCES
- [1] E. Demler, W. Hanke, and S. C. Zhang, cond-mat/0405038, and references therein.
- [2] M. Mehring, F. Hentsch, Hj. Mattausch, and A. Simon, Solid State Commun. 75, 753 (1990).
- [3] A. Goto, Y. Itoh, H. Yasuoka, A. Hayashi, and Y. Ueda, Institute for Solid State Physics (ISSP) Report No. 2846 (1994).
- [4] S. Kambe, H. Yasuoka, A. Hayashi, and Y. Ueda, Phys. Rev. B 47, 2825 (1993).
- [5] K. Kakuyanagi, K.Kumagai, Y. Matsuda, and M. Hasegawa, Phys. Rev. Lett. 90, 197003 (2003).
- [6] Y. Shimakawa, Physica C 204, 247 (1993).
- [7] S. Kambe, H. Yasuoka, A. Hayashi, and Y. Ueda, Phys. Rev. Lett. 73, 197 (1994).
- [8] Oleg M. Vyaselev, and Igor F. Schegolev, Czechoslovak J. of Phys. 46, 1137 (1996) Suppl. S2.
- [9] S. Kambe, H. Yasuoka, A. Hayashi, and Y. Ueda, Phys. Rev. B 48, 6593 (1993).
- [10] K. Shibata, T. Nishizaki, T. Sasaki, and N. Kobayashi, Phys. Rev. B 66, 214518 (2002).
- [11] W. G. Clark, M. E. Hanson, F. Lefloch, and P. Segransan, Rev. Sci. Instrum. 66(3), 2453 (1995).
- [12] Y. Itoh, H. Yasuoka, A. Hayashi, and Y. Ueda, J. Phys. Soc. Jpn. B 63, 22 (1994).
- [13] M. Takigawa, M. Ichioka, and and K. Machida, J. Phys. Soc. Jpn. 69, 3943 (2000).
- [14] T. M. Riseman, J. H. Brewer, K. H. Chow, W. N. Hardy, R. F. Kiefl, S. R. Kreitzman, R. Liang, W. A. MacFarlane, P. Mendels, G. D. Morris, J. Rammer, J. W. Schneider, C. Niedermayer, and S. L. Lee, Phys. Rev. B 52, 10569 (1995).
- [15] E. H. Brandt, Phys. Rev. B 37, 2349 (1988).
- [16] A. G. Redfield, Phys. Rev. 162, 367 (1967).
- [17] Y. Itoh, T. Machi, C. Kasai, S. Adachi, N. Watanabe, N. Koshizuka, and M. Murakami, Phys. Rev. B 67, 064516 (2003).
- [18] M. R. MacHenry, B. G. Silbernagel, and J. H. Wernick, Phys. Rev. Lett. 27, 426 (1971); Phys. Rev. 5, 2958 (1972).
- [19] H. Tsuchiura, M. Ogata, Y. Tanaka, and S. Kashiwaya, Phys. Rev. 68, 012509 (2003).
- [20] M. Machida, and T. Koyama, Phys. Rev. Lett. 90, 077003 (2003).
- [21] G. B. Furman, E. M. Kunoff, and S. D. Goren, Physica C 266, 203 (1996), and references therein.
- [22] P. Pincus, A. G. Gossard, V. Jaccarino, and J. H. Wernick, Phys. Lett. 13, 21 (1964).
- [23] Ch. Niedermayer, C. Bernhard, U. Binninger, H. Gluckler, J. L. Tallon, E. J. Ansaldo, and J. I. Budnick, Phys. Rev. Lett. 71 (1993) 1764.
- [24] T. Giamarchi, and P. Le Doussal, Phys. Rev. B 52, 1242 (1995).
- [25] A. P. Reyes, X. P. Tang, H. N. Bachman, W. P. Halperin, J. A. Martindale, and P. C. Hammel, Phys. Rev. B 55, R14737 (1997).
- [26] H. N. Bachman, A. P. Reyes, V. F. Mitrovic, W. P. Halperin, A. Kleinhammes, P. Kuhns, and W. G. Moulton, Phys. Rev. Lett. 80, 1726 (1998).
- [27] C. Bergemann, A. W. Tyler, A. P. Mackenzie, J. R. Cooper, S. R. Julian, and D. E. Farrell, Phys. Rev. B 57, 14387 (1998).
- [28] S. Kambe, Y. Yoshinari, H. Yasuoka, A. Hayashi, and Y. Ueda, Physica C 185-189, 1181 (1991).