Jamming transition in a highly dense granular system under vertical vibration
Abstract
The dynamics of the jamming transition in a three-dimensional granular system under vertical vibration is studied using diffusing-wave spectroscopy. When the maximum acceleration of the external vibration is large, the granular system behaves like a fluid, with the dynamic correlation function relaxing rapidly. As the acceleration of vibration approaches the gravitational acceleration , the relaxation of slows down dramatically, and eventually stops. Thus the system undergoes a phase transition and behaves like a solid. Near the transition point, we find that the structural relaxation shows a stretched exponential behavior. This behavior is analogous to the behavior of supercooled liquids close to the glass transition.
pacs:
45.70.Mg, 42.62.Fi, 64.70.PfI Introduction
Granular materials are the particle systems in which the size of particle is large and the effect of thermal agitation is negligibleReview . Recently there has been much interest in the physics of noncohesive granular materials lying on a vertically vibrating surface. When the vibration intensity is large, the granular systems show the properties of fluids, such as convectionConvection1 ; Convection2 , heapingHeaping ; Gas , traveling surface wavesPak , pattern formationSwinney ; Kim , and size segregationSegre . When the vibration intensity is small, disordered granular materials become jammed, behaving like a system with infinite viscosity. After Liu and Nagel proposed an idea unifying the glass transition and the jamming behaviorLiu , the behavior of the jamming transition has been studied extensivelyWeitz ; OHern ; Coniglio ; Nicodemi ; Bideau ; DAnna1 ; Bonn ; Powders . In this model, the inverse density of the system , temperature , and stress form the axes of a three-dimensional phase diagram, with the jammed state in the inner octant and the unjammed state outside. In athermal macroscopic systems like granular materials, thermal temperature does not play any important role. Instead, it is an effective temperature that relates the random motion of the particles. When jammed by lowering the effective temperature, the system is caught in a small region of phase space with no possibility of escape. For thermal systems, if the molecules are bulky and of irregular shape, or if the liquid is cooled too rapidly for the crystalline structure to form, at low temperature it vitrifies into a rigid phase that retains the disordered molecular arrangements of the liquid, creating a glass state. If the idea of the jamming phase diagram is correct, one can apply many ideas of the glass transition to explain the jamming behavior in athermal systems.
In order to study the dynamics of granular systems, one might want to track the motion of the individual particles. However, due to the opacity of the granular systems, most experimental work has been limited to the study of the external features of the granular flow or the motion of tracer particles. Recently, noninvasive experimental techniques using magnetic resonance imaging (MRI), positron emission particle tracking (PEPT), and diffusing-wave spectroscopy (DWS) have overcome the problem of opacity in the three-dimensional granular system and have made observation of internal features of the flow possibleConvection1 ; Pept ; Durian ; You . Since the spatiotemporal scale of the particle fluctuations is much smaller than the resolution of MRI and PEPT, only DWS can provide a statistical description of a highly dense system of small particles with adequate resolutionDWS . To briefly explain the DWS technique, photons are scattered consecutively by many particles in a highly dense medium. This diffusive nature of light in a strongly scattered medium results in a scattered light intensity that fluctuates with time. Thus the temporal decay of the light intensity autocorrelation function is used to study very small relative motions of the scatterers in the medium. The DWS technique has been successfully applied to study the motion of granular particles in a channel flow, a gas-fluidized bed, an avalanche flow, and a vibro-fluidized bedDurian ; You .
In this paper, the fluidization and jamming process of a thick and highly dense three-dimensional vibro-fluidized granular bed is studied using DWS. Exploring the temperature axis of the jamming phase diagramLiu , we compare our experimental result with theoretical concepts developed in the study of supercooled liquids close to the glass transition. Our result provides strong evidence of the analogy between the dynamics of granular materials and the behavior of supercooled liquids close to the glass transition.
II Experimental Setup
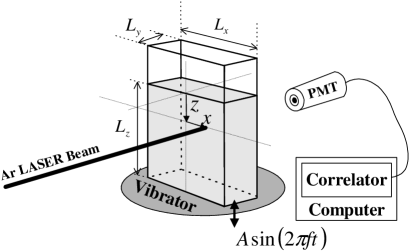
Figure 1 is a simple schematic diagram of the experimental setup. A 180 mm high, 90 mm wide (), and 10 mm thick () rectangular glass vessel is filled with glass beads of diameter m at the total depth of mm. An electromagnetic shaker vibrates the vessel vertically with the form , where is the amplitude and is the frequency of the vibration. One can construct a dimensionless acceleration amplitude, whose maximum value is
| (1) |
where is the gravitational accelerationHeaping . The vessel is much heavier than the total mass of the glass beads so that the collisions of the vessel with the granular medium do not disturb its vertical vibration. The air inside the vessel is evacuated below the pressure of 0.1Torr, where the volumetric effect of the gas can be neglectedGas . The acceleration amplitude and the vibration frequency are monitored by the accelerometer which is positioned on the vessel. All the data are taken in a steady state condition where the system is well compactedBideau . For the DWS measurements, an Ar laser beam with the wavelength of 488nm is directed on the wide side of the vessel, and the transmitted light intensity is detected by a photomultiplier tube (PMT). The center of scattering volume is located at the position (), where is the horizontal distance from the central-vertical axis of the vessel and is the vertical distance below the free surface. The intensity output of the PMT is fed to a computer-controlled digital correlator (BI9000AT; Brookhaven Inst.). The intensity autocorrelation function, which is calculated by the digital correlator, is defined as
| (2) |
where is a delay time, is a factor determined by the optical geometry of the experimentChu , and the bracket indicates a time average. In a highly dense granular medium, incident photons are multiply scattered by the glass beads. When the beads in the medium move, the intensity measured at the detector fluctuates with time. Thus the intensity autocorrelation function has the information of the movement of the beads in the medium. When is periodic, there are echoes in the correlation function at the integral multiples of the oscillation periodEcho . In this experiment, the position of the incident laser beam is fixed and the scattering medium vibrates with the form of . Therefore when all the particles in the scattering volume exhibit perfectly reversible periodic motion, the correlation function will return to its initial value 1[=] at each multiple of the oscillation period. When only a fraction of the scatterers undergoes a reversible motion in the scattering volume, the height of the echoes will decay in time. Lastly, when all the scatterers exhibit an irreversible motion, there is no echo in the correlation function. Therefore the degree of fluidization can be characterized by the decay time of the height of the echoes in .
III Results and Discussion
III.1 Fluidization point
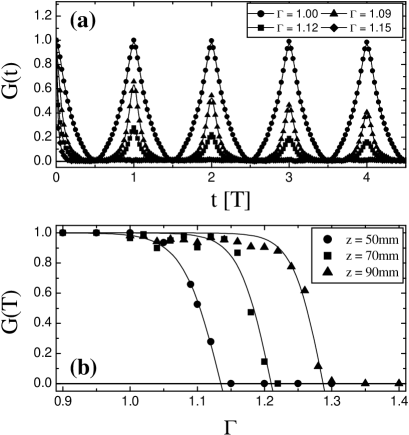
Figure 2(a) shows the correlation function at various dimensionless accelerations at the position (mm, mm) in the case of the vibration frequency of Hz and the granular bed of mm. When the maximum acceleration is smaller than the gravitational acceleration, , the correlation function oscillates with echoes at every multiple of the period (). Here, the height of each echo does not change, that is . Since the photons meet the same scattering volume at every vibration period, implies that there is no relative movement of the particles in the scattering volume. This suggests that the granular system is solidlike at , where the viscosity of the system appears to diverge. As the dimensionless acceleration is increased above , however, the height of the echoes in the correlation function relax in time. At a certain critical dimensionless acceleration , the height of the first echo disappears completely, []. For , decays very rapidly without any echoes. This implies that at , the particle positions become completely randomized by the external vibrations and the statistical description of the internal motion becomes important. In this sense, is the critical dimensionless acceleration where the scattering volume becomes fluidized. This fast decay in at contains information about the short-time dynamics of the granular particlesYou ; DAnna2 . Figure 2(b) shows the height of the first echo as a function of at different vertical positions . For a given position inside the vessel, the height of the first echo decreases monotonically with . Thus the fraction of the particles which undergo an irreversible motion increases with . To determine , the data points are fitted with the function, .

Figure 3(a) shows the critical dimensionless acceleration at various horizontal positions with =50mm and Hz. Note that is independent of the horizontal position. Figure 3(b) plots as a function of the vertical position with mm in the case of Hz and mm. The critical value of the dimensionless acceleration increases linearly with the distance from the free surface, except near the free surface of the granular system. The solid line in this figure is a straight line with a slope of 0.0034. The result that is nearly near the free surface of the granular system agrees with many previous experimental studiesConvection2 ; Heaping ; Gas ; Pak . Figure 3(c) shows at various total depths in the case of the fixed position (mm, mm). No dependence of on the total depth suggests that the relevant parameters in the fluidization process are just the distance from the free surface, , and . According to this picture, when the maximum acceleration is larger than the gravitational acceleration (), there is a liquid-solid interface in the granular system. The upper part of the system is liquidlike and the lower part is solidlike, and the position of the interface depends on .
III.2 Relaxation near the transition point
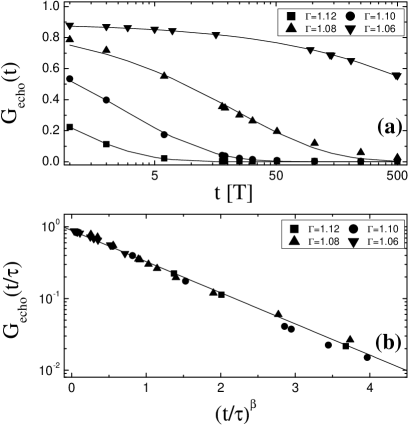
At , we observe a dramatic slowing down of the relaxation in the height of the echoes with decreasing . Figure 4(a) shows the height of the echoes of the correlation function up to a delay time of several hundred vibration periods. The unit of time in this figure is the vibration period . This shows that the dynamics of granular particles undergoes structural relaxation below . The data points are fitted with a stretched exponential decay function,
| (3) |
Here, the characteristic relaxation time depends on . The fitting parameters of the stretched exponential decay function are , , and . During the fitting process, the value of is fixed at , which is chosen from the data at when the delay time approaches to . In the theory of the glass transition, the value of depends on the scattering geometry and depends little on temperature and densityMCT . The fixed value of is the major reason for the poor fitting at . Figure 4(b) shows the same data with the scaled horizontal axis of , where . All the data collapse well on a straight line with a small value of the parameter in Eq. (3) (Here, implies a simple exponential relaxationLog ; Glass ). This collapse is analogous to the behavior of supercooled liquids close to the glass transition.

Figure 5 shows at various from the same data in Fig.4. Here, the characteristic relaxation time increases rapidly as approaches a specific value. The solid line in this figure is a fit with the form of , where and . The power law divergence of the characteristic relaxation time is similar with that of mode coupling theory (MCT). According to MCT, the characteristic relaxation time at a temperature in the glassy relaxation process is of the form MCT . Here, is a dynamical crossover temperature from a liquidlike to a solidlike regime, and is located between the glass transition temperature and the melting transition temperature Nicodemi ; MCT . From the analogy between the dynamics of the granular materials under vertical vibration and that of supercooled liquids close to the glass transition, one expects that the effective temperature of the granular system under vertical vibration is related to the dimensionless acceleration. Therefore we conjecture that , , and in the dynamics of the granular materials under vertical vibration correspond to , , and in the behavior of supercooled liquids close to the glass transition.
IV Conclusion
The jamming process of a highly dense three-dimensional granular system under vertical vibration is experimentally studied using the DWS technique. At , the granular system behaves like fluids. At , the system is arrested in the glassy state, where the viscosity of the system appears to diverge. At , the structural relaxation shows a stretched exponential behavior and the divergence of the characteristic relaxation time can be described by the power law function which is similar to MCT. This behavior provides the evidence of the analogy between the dynamics of granular materials and the behavior of supercooled liquids close to the glass transition.
Acknowledgements.
We would like to thank Y. H. Hwang, B. Kim, J. Lee, J. A. Seo, F. Shan, K. W. To, and W. Goldburg for valuable discussions. This work was supported by Grant No. R01-2002-000-00038-0 from the Basic Research Program of the Korean Science Engineering Foundation, by Grant No. KRF2004-005-C00065 from the Korea Research Foundation, and by Pusan National University in the program, Post-Doc. 2005.References
- (1) H. M. Jaeger and S. R. Nagel, Science 255, 1523 (1992); H. M. Jaeger, S. Nagel, and R. P. Behringer, Rev. Mod. Phys.68, 1259 (1996); P. G. de Gennes, Rev. Mod. Phys. 71, S374 (1999).
- (2) E. E. Ehrichs et al., Science 267, 1632 (1995).
- (3) J. B. Knight et al., Phys. Rev. E 54, 5726 (1996).
- (4) P. Evesque and J. Rajchenbach, Phys. Rev. Lett. 62, 44 (1989); S. B. Savage, J. Fluid Mech.194, 457 (1988); E. Clément, J. Duran, and J. Rajchenbach, Phys. Rev. Lett. 69, 1189 (1992).
- (5) H. K. Pak, E. Van Doorn, and R. P. Behringer, Phys. Rev. Lett. 74, 4643 (1995).
- (6) H. K. Pak and R. P. Behringer, Phys. Rev. Lett. 71, 1832 (1993).
- (7) F. Melo, P. B. Umbanhowar, and H. L. Swinney, Phys. Rev. Lett. 75, 3838 (1995); P. B. Umbanhowar, F. Melo, and H. L. Swinney, Nature (London)382, 793 (1996).
- (8) K. Kim and H. K. Pak, Phys. Rev. Lett. 88, 204303 (2002).
- (9) J. B. Knight, H. M. Jaeger, and S. R. Nagel, Phys. Rev. Lett. 70, 3728 (1993); D. C. Hong, P. V. Quinn, and S. Luding, Phys. Rev. Lett. 86, 3423 (2001).
- (10) A. J. Liu and S. R. Nagel, Nature (London) 396, 21 (1998).
- (11) V. Trappe, V. Prasad, L. Cipelletti, P. M. Segre, and D. A. Weitz, Nature (London) 411, 772 (2001).
- (12) C. S. O’Hern, S. A. Langer, A. J. Liu, and S. R. Nagel, Phys. Rev. Lett. 86, 111 (2001); C. S. O’Hern, L. E. Silbert, A. J. Liu, and S. R. Nagel, Phys. Rev. E 68, 011306 (2003).
- (13) M. Nicodemi and A. Coniglio, Phys. Rev. Lett. 82, 916 (1999).
- (14) M. Tarzia, A. de Candia, A. Fierro, M. Nicodemi, and A. Coniglio, Europhys. Lett. 66, 531 (2004); A. Coniglio, A. de Candia, A. Fierroa, M. Nicodemia, and M. Tarziab, Physica A 344, 431 (2004); P. Richard, M. Nicodemi, R. Delannay, P. Ribiére, and D. Bideau, Nat. Mater. 4, 121 (2005).
- (15) P. Philippe and D. Bideau, Phys. Rev. Lett. 91, 104302 (2003).
- (16) G. D’Anna and G. Gremaud, Nature (London) 413, 407 (2001).
- (17) P. Coussot, Q. D. Nguyen, H. T. Huynh, and D. Bonn, Phys. Rev. Lett. 88, 175501 (2002); P. Coussot et al., Phys. Rev. Lett. 88, 218301 (2002); J. C. Baudez and P. Coussot, Phys. Rev. Lett. 93, 128302 (2004).
- (18) J. M. Valverde, M. A. S. Quintanilla, and A. Castellanos, Phys. Rev. Lett. 92, 258303 (2004);
- (19) R. D. Wildman, J. M. Huntley, and D. J. Parker, Phys. Rev. Lett. 86, 3304 (2001).
- (20) N. Menon and D. J. Durian, Science 275, 1920 (1997); N. Menon and D. J. Durian, Phys. Rev. Lett. 79, 3407 (1997); P. -A. Lemieux and D. J. Durian, Phys. Rev. Lett. 85, 4273 (2000); P. K. Dixon and D. J. Durian, Phys. Rev. Lett. 90, 184302 (2003).
- (21) S. Y. You and H. K. Pak, J. Korean Phys. Soc. 38, 577 (2001).
- (22) G. Maret and P. E. Wolf, Z. Phys. B 65, 409 (1987); D. J. Pine, D. A. Weitz, P. M. Chaikin, and E. Herbolzheimer, Phys. Rev. Lett. 60, 1134 (1988).
- (23) B. Chu, Dynamic Light Scattering: Basic Principles and Practice (Academic Press, New York, 1991).
- (24) P. Hébraud, F. Lequeux, J. P. Munch, and D. J. Pine, Phys. Rev. Lett. 78, 4657 (1997).
- (25) G. D’Anna, P. Mayor, A. Barrat, V. Loreto, and F. Nori, Nature (London) 424, 909 (2003).
- (26) W. Götze and L. Sjögren, Rep. Prog. Phys. 55, 241 (1992).
- (27) At nonsteady state, the relaxation can be well fitted by an inverse-logarithmic function. However, at steady state, the relaxation is better fitted by a stretched exponential function. J. B. Knight et al., Phys. Rev. E 51, 3957 (1995).
- (28) G. Tarjus and D. Kivelson, in Jamming and Rheology, edited by A. J. Liu and S. R. Nagel (Taylor Francis, New York, 2001), pp. 20-38.