Quantitative Analysis of Photo-Thermal Stability of CdSe/CdS Core-Shell Nanocrystals
Abstract
We report here investigations on the instability in luminescence of bare (TOPO-stabilized) and CdS- capped CdSe particles under infrared radiation. During photo-thermal annealing the formation of oxide layers on the surfaces of the particles create defect states. Consequently there is a reduction in particle size. These two effects control the light output from the samples. We make a quantitative comparison of the stability of bare CdSe and core-shell type CdSe-CdS particles under photo-annealing. Using diffusion theory, we show that the volume of the oxide layer, adhered to the crystallites, play a dominant role in controlling the luminosity of the particles.
Keywords : A. nanostructures, D. optical properties, E. luminescence
pacs:
78.66.Hf, 78.55.EtI Introduction
Fluorescent nanoparticles have tremendous promise as indicators and photon sources for a number applications such as biological imaging, sensor technology, microarrays, and optical computing Jaiswal:2003 . However, the practical applications of nanocrystals demand efficiency and stability of the band edge emission. It is well-known that the surface of nanocrystals is made of atoms which are not fully coordinated. The unsaturated dangling bonds are highly active and act like defects states unless passivated. Due to high surface to volume ratio, the contribution of surface states is significant in controlling the optical properties of nanoparticles. It is difficult to passivate both cationic and anionic surface sites by long chain organic materials Peng:1997 . For better surface passivation, the core particles are usually capped with a higher band gap inorganic compound. Nanoparticles with core-shell architecture have the added benefit of providing a robust platform for incorporating diverse functionalities into a single nanoparticle Jackson:2001 . For CdSe nanocrystals, ZnS Hines:1996 ; Kortan:1990 and CdS Tian:1996 are better choices for capping because they (i) confine the photo-generated charges in the core and (ii) have low lattice mismatch with core material.
In the literature, we find several reports, where thermal and photostability of such nanoparicles/nanorods have been discussed Manna:2002 ; Peng:1997 ; Guo:2003 . For example, Manna et al Manna:2002 have reported an increase in quantum efficiency in CdS/ZnS nanorods due to photochemical annealing. Photo-oxidation and photo-bleaching of single CdSe/ZnS dots have been probed by room temperature time resolved spectroscopy van Sark:2001 . In this article, the drop in luminosity of the particles during thermal annealing has been explained by the fall in number of emitted photons due to decrease in size of the particles.The photochemical instability of capped CdSe nanocrystals have also been explained by including photo-oxidation of surface ligands followed by a precipitation process Aldana:2001 . However, till date the detail quantitative comparison of the time evolution of the light output from bare and capped particles is unavailable.
In our work, we have addressed the above issues and discussed the stability of TOPO-stabilized and inorganically passivated (CdS capped) CdSe particles under Infrared (IR) radiation via photoluminescence (PL) measurements. The instability of the particles during photo-thermal annealing in air have been systematically and quantitatively studied till an asymptotically constant behavior was observed with time.
II EXPERIMENTS
The core-shell type CdSe-CdS and TOPO-stabilized CdSe particles are prepared by following an established route Pradhan:2003 . HDA and TOPO are melted at 60-80 ∘C and N2 gas is bubbled into the melt for five minutes. M SeUr is added to it at 100 ∘C. In a separate container M CdAc is dissolved in HDA followed by purging with nitrogen till a clear solution was observed. The CdAc solution is rapidly added at 150 ∘C to the SeUr solution, which immediately results in an orange coloration indicating the formation of CdSe particles (Sample A). The temperature is slowly raised to 200 ∘C and the samples are collected at 70 ∘C, followed by precipitation by methanol. Decomposition of cadmium xanthate to CdS on the surface of the CdSe formed the CdSe-CdS core-shell nanoparticles (Sample B). For more detail of the sample preparation technique one can refer to Pradhan:2003 .
To study the effect of photo-annealing, samples are kept under IR radiation of temperature 60 5 ∘C. The PL spectra are obtained using TRIAX 550 single monochromator with an open electrode charge coupled detector(CCD). A 488 nm air cooled Ar+ ion laser with power 3 103 Watt/m2 on the sample is used as an excitation source .
III Photoluminescence and Thermal stability

The PL spectra of pristine Sample A (dotted) and Sample B (solid) are shown in Fig. 1. Both the spectra are fitted with Gaussian distribution function. From the best fit, the peak positions are obtained as 557 nm (2.23 eV) for Sample A and 602 nm (2.06 eV) for Sample B. The blue shift of the PL spectrum from the bulk excitonic peak (712 nm) of CdSe is due to the confinement of charge carriers in the nanostructures. From this energy shift and using the well-known effective mass approximation (EMA) model Efros:1982 ; Brus:1984 , the average particle size in Sample A and Sample B are estimated to be 5.2 nm and 6.4 nm, respectively.
Subsequently, the samples are irradiated in air by IR lamp for 14 hours. The behavior of the luminescence spectra of the two samples show a clear difference with evolution of time. For a detail comparison of the stability of the particles in these samples during photo-annealing we have fitted each PL spectrum, taken with 1.0 hr. interval (on average, more frequently in the beginning), with the Gaussian function, keeping PL intensity, full width at half maxima (FWHM) and peak position as fitting parameters. From the obtained peak position the average size of the particles in the samples has been estimated using the EMA model. The variation of the particle size, PL spectral-width (FWHM) and peak intensity with irradiation time for sample A and B are shown in Fig 2 and 3, respectively. From Fig 2(a), 2(b) and 2(c) we see that PL spectrum of Sample A exhibits a monotonic change with irradiation time : an exponential degradation of the average particle size and luminescence intensity along with an exponential increase in the spectral-width. However, the PL spectrum of Sample B exhibits a non-monotonic behavior. For better understanding, we have divided the total time of experiment for Sample B into two regions [see Fig 3(a) - 3(c)]. In region I (for about 1.5 hours) the degradation of the particle size is a slow process. The spectral-width remains almost constant and the luminescence intensity increases with irradiation time. In region II (from 1.5 to 14 hours), the rate of degradation of the particle size and the spectral-width is faster than what is observed in region I. The PL intensity also decays exponentially in this region.

.
It is well-known that CdSe nanocrystals are highly photosensitive. In our observation, the difference in the time evolution of the emission spectra for TOPO-stabilized and CdS capped CdSe nanocrystals is due to the difference in photo-oxidation process in these two samples. TOPO is unstable under IR light and gets detached from the particle surface. As a result, the unsaturated bonds at the surface of bare CdSe particles without TOPO layer directly oxidizes in light and air. Nanocrystals act as photochemical catalysts for the oxidation of the free surface ligands. It has been shown from the conductivity studies that the oxygen is absorbed via a transfer of electron density from the semiconductor to the oxygen katari:1994 . The main oxidation products are CdSeO3, SeO2 and CdO . The oxygen proceeds to break the chalcogen back bonds attached the bulk semiconductor, from the surface to deep inside the particles katari:1994 . Thus, with time the thickness of oxide layer increases and hence, the diffusion of oxygen towards the centre of the particle (CdSe) slows down. The aforementioned oxidation process and the change in rate of diffusion of oxygen results in an exponential decrease in the particle size with irradiation (Fig. 2a). The exponential drop in PL intensity may be due to (i) the decrease in the number of photons emitted from the particles of smaller size and/or (ii) the formation of defect states at the interface of CdSe and oxide layer van Sark:2001 . From Fig. 2 (b) we see that the above processes also influence the size distribution of the particles, which increases the width of the PL spectrum.

.
For core-shell CdSe-CdS particles, oxygen has to diffuse through the CdS shell. The slow variation in the particle size and particle size distribution (reflected from the variation in spectral-width) in region I of Fig. 3(a) and 3(b) indicate that the oxygen diffuses slowly through thicker CdS layer. This is supported by the fact that the oxidation of Se2- (as in case of Sample A) is easier than that of S2- Cotton:1997 . It has been shown that for core-shell particles the oxygen can quench the defect states at the interface of core and shell Henglein:1988 ; Chestnoy:1986 . A possible explanation of the enhanced PL intensity in region I of Fig. 3(c) may be due to the fact that the diffused oxygen in CdSe core through CdS layer is just sufficient to reduce the defect states at the interface of core and shell without affecting the particle size much. However, the prolonged exposure to light and heat in presence of oxygen inevitably results in degradation of the particles. The CdS is gradually photo-oxidized to Cd2+ and SOvan Sark:2001 and this causes a decrease in shell thickness. Simultaneously, an oxide layer starts to grow rapidly at core-shell interface. This gives rise to an exponential decrease in the particle size and luminescence intensity in region II of Fig 3(a) and 3(c) (similar to what was observed for Sample A). We see that it is also reflected in the rapid increase of PL spectral-width [region II of Fig.3(b)]. The photo-oxidation of the CdSe core through the CdS layer indicates that the shells in the core-shell particles are not closed epitaxial layers, rather they are layers with grain boundaries. These grain boundaries are formed where the CdS islands, which starts to grow at different places on the CdSe nanocrystal surfaces, meet. At these boundaries the oxygen can diffuse to the CdSe core inside the CdS shell.
| Sample | ||
|---|---|---|
| A | 4.2 | 2.0 |
| B | 3.7 | 4.6 |
Now we proceed to analyze the results shown in Fig. 2 and Fig. 3, quantitatively. The exponential decay constants for sizes () of the particles and luminescence intensities () in Sample A and Sample B have been tabulated in Table I. It is to be noted that though the values of ’s in Sample B are nearly same; for Sample A the value of is two times more than that of . Fick’s law of diffusion for a diffusion of a species ’O’ is given by
| (1) |
where is the diffusion coefficient of O and is the concentration gradient of O. The negative sign in Eq. 1 implies that diffusion takes place in a direction opposite to the gradient. Since, we are are looking into the diffusion of oxygen inside the CdSe particles of similar size, it is reasonable to assume to be same for both Sample A and B Aldana:2001 . We take into account the volume fraction, , of the oxide layer,which can be estimated from the relation Signorini:2003
| (2) |
where is the thickness of the oxide layer, which is independent of the core diameter . is the classical diffusion profile Signorini:2003
| (3) |
Here, is the length parameter which quantifies the diffusion process and is proportional to the and hence in Eq. 2 Signorini:2003 . In Eq. 1 - Eq. 3, = A for Sample A and = B for Sample B. The average size of the particles in the beginning () and also at the end () of the experiment and hence for Sample A and Sample B can be easily estimated from Fig. 2(a) and 3(a). Using Eq. 2 the ratio of in our two samples has been estimated by taking
| (4) |
All parameters, discussed above, are summarized Table II. We calculate the ratio of the oxide volume ratio in Sample A and Sample B to be 0.5, which is same as the ratio of the luminescence decay rate in these samples (Table I). It is now reasonable to assume that the rather than size (which indirectly related to the number of emitted photons), the volume of the oxide layer on the surface of the particles plays a crucial role in determining the stability of the luminescence output from the nanocrystals.
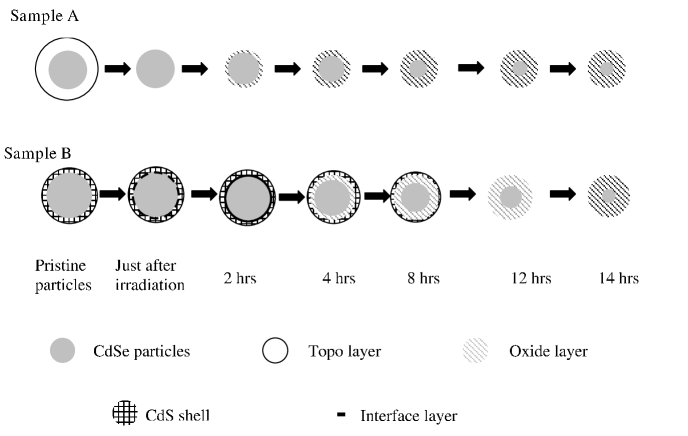
Schematic of the proposed mechanisms for the IR instability of the samples is shown in Fig. 4. It is to be noted that nanocrystals undergo Ostwald ripening only if the temperature of the system rises beyond 100 ∘, which is higher than what we use in our experiment.
| Sample | di | df | Particle Vol. | Oxide Vol. | |||
|---|---|---|---|---|---|---|---|
| (nm) | (nm) | (nm) | ratio | (nm3) | ratio | ||
| A | 5.23 | 4.78 | 0.45 | 1.13 | 1 | 57.1 | 0.5 |
| B | 6.45 | 6.12 | 0.33 | 120 |
IV CONCLUSION
In this article, we have quantitatively analyzed the stability of bare and CdS capped core-shell particles under IR radiation. Radiation causes photo-annealing of the samples. The decay rate of the light output from CdS capped particles is found to be two times slower than that of bare particles. Using a simple diffusion model we conclude that rather than size of the particles, the volume of the oxide layer surrounding the particles play an important role in controlling their luminosity. It is worthwhile to check the above model for the particles with different shell thickness.
Acknowledgements.
Authors thank Department of Science and Technology, India for financial support. Authors also thank N. Pradhan for providing the samples.References
- (1) J.K. Jaiswal, H. Mattoussi, J.M. Mauro, S.M. Simon, Nature Biotechnol. 21 (2003) 47; B.M. Lingerfelt, H. Mattoussi, E.R. Goldman, J.M. Mauro, G.P. Anderson, Anal. Chem. 75 (2003), 4043; E.R. Goldman, A.R. Clapp, G.P. Anderson, H.T Uyeda, J.M. Mauso, I.L. Medintz, H. Mattoussi, Anal. Chem. 76 (2004) 684.
- (2) X.G. Peng, M.C. Schlamp, A.V. Kadavanich, A.P. Alivisatos, J. Am. Chem. Soc. 119 (1997) 7019.
- (3) J.B. Jackson, N.J. Halas, J.Phys.Chem. B 105 (2001) 2743; S. Lal, R.N. Taylor, J.B. Jackson, S.L. Westcott, P. Nordlander, N.J. Halas, J. Phys. Chem. B. 106 (2002) 5609; J.B. Jackson, S.L. Westcott, L.R. Hirsch, J.L. West, N.J. Halas, Appl. Phys. Lett. 82 (2003) 257.
- (4) M.A.Hines, P.Guyot-Sionnest, J. Phys. Chem. 100 (1996) 468.
- (5) A.R.Kortan, R.Hull, R.L.Opila, G.M.Bawendi, M.L.Steigerwald, P.J.Carroll, E.L.Brus, J. Am. Chem. Soc. 112 (1990) 1327.
- (6) Y.Tian, T.Newton, N.A.Kotov, D.M.Guldi, J.H.Fendler, J. Phys. Chem. 100 (1996) 8927.
- (7) L. Manna, E.C. Scher, L-Shi Li and A. P. Alivisatos, J. Am. Chem. Soc. 124 (2002) 7136.
- (8) W. Guo, J.J. Li, Y.A. Wang and X. Peng, J. Am. Chem. Soc. 125 (2003) 3901.
- (9) W.G.J.H.M.van Sark, P.L.T.M. Frederix, D.J.Van den Heuvel, H.C. Gerritsen, A.A.Bol, J.N.J.van Lingen, C.d.Mello Donrge, A. Meijerink, J. Phys. Chem. B 105 (2001) 8281.
- (10) J. Aldana, Y. Wang and X. Peng, J. Am. Chem. Soc. 123 (2001) 8844.
- (11) N.Pradhan, B.Katz, S.Efrima, J. Phys. Chem. B 107 (2003) 13843.
- (12) AL.L. Efros and A.L. Efros, Soviet Phys. Semicond. 16, (1982) 772
- (13) L.E. Brus, J. Chem. Phys. 80, (1984) 4403.
- (14) J.E.B. Katari, V.L. Colvin, A.P. Alivisatos, J. Phys. Chem 98 (1994) 4109.
- (15) A.M. Cotton, Adv. Inor. Chem. 1997
- (16) A. Henglein, Top Curr. Chem 143 (1988) 113.
- (17) N. Chestnoy, T.D. Harris, R. Hull, L.E. Brus, J. Phys. Chem. 90 (1986) 3393.
- (18) L. Signorini, L. Pasquini, L. Savini, R. Carboni, F. Boscherini, E. Bonetti, A. Giglia, M. Pedio, N. Mahne and S. Nannarone, Phys. Rev. B 68 (2003) 195423