Observation of spin Coulomb drag in a
two-dimensional electron gas
Abstract
An electron propagating through a solid carries spin angular momentum in addition to its mass and charge. Of late there has been considerable interest in developing electronic devices based on the transport of spin, which offer potential advantages in dissipation, size, and speed over charge-based devicesAwschBook . However, these advantages bring with them additional complexity. Because each electron carries a single, fixed value () of charge, the electrical current carried by a gas of electrons is simply proportional to its total momentum. A fundamental consequence is that the charge current is not affected by interactions that conserve total momentum, notably collisions among the electrons themselvesZiman . In contrast, the electron’s spin along a given spatial direction can take on two values, (conventionally ), so that the spin current and momentum need not be proportional. Although the transport of spin polarization is not protected by momentum conservation, it has been widely assumed that, like the charge current, spin current is unaffected by electron-electron ( e-e ) interactions. Here we demonstrate experimentally not only that this assumption is invalid, but that over a broad range of temperature and electron density, the flow of spin polarization in a two-dimensional gas of electrons is controlled by the rate of e-e collisions.
pacs:
42.65.Hw, 72.25.b, 74.25.Gz, 75.40.Gb., 78.47.+pIn this work spin diffusion is characterized by the transient spin grating techniqueCameron , which is based on optical injection of spin-polarized electrons. The two-dimensional electron gas (2DEG) resides in a GaAs quantum well, in which the carriers are donated by Si impurites doped into the GaAlAs barrier layers. Near-bandgap illumination of the GaAs excites electrons whose initial spin is determined by the helicity of the lightOpticalOrientation . If the GaAs is excited by two non-collinear, coherent beams of light with orthogonal linear polarization, then in the region where the beams interfere the helicity varies sinusoidally from plus to minus one. The optical-helicity wave generates a wave of electron-spin polarization with the same spatial frequency, which in turn generates a sinusoidal variation (grating) in the index of refraction through the Kerr effect. The wavevector of the injected spin-density wave is in the plane of the 2DEG and the spin polarization is oriented perpendicular to this plane.
The time-evolution of the transient spin grating directly reveals the nature of spin transport and relaxation in the electronic system, functioning like a time-domain version of neutron scattering. We measure the spin polarization by detecting the diffraction of a probe beam off the grating. A sensitive coherent detection scheme (described under Methods) enabled acquisition of the 150 grating decays required to characterize the spin dynamics for each sample throughout the temperature-wavevector () parameter space.
In this paper we present results for three quantum well samples, with electron concentrations of 7.8, 4.3, and 1.9 cm-2, corresponding to Fermi temperatures of 400, 220, and 100 K, respectively. Fig. 1 shows the initial decay rate of the spin grating as function of in the most heavily doped sample, for several grating wavevectors from 0.4 cm-1 to 2.5 cm-1. The dependence on can be described in terms of three regions. For 100 K 300 K the decay rate varies slowly. For 50 K 100 K the decay rate increases rapidly with decreasing , and for 50 K it reaches a slowly varying plateau.
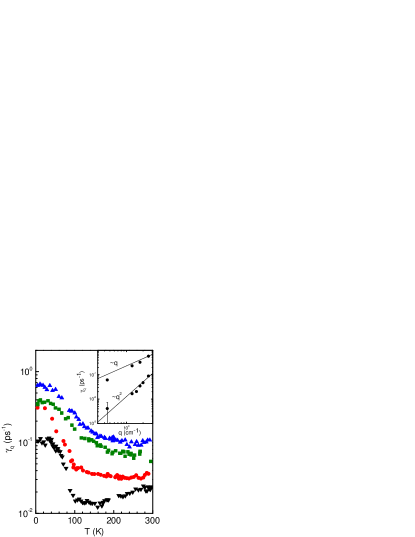
We begin by discussing the decay rate where it varies slowly, i.e., below 50 K and above 100 K. In the high- region the spin dynamics can be accurately described in terms of independent processes of spin diffusion and spin relaxation. In this description, the decay rate varies with q quadratically, as , where is the spin diffusion coefficient and is the spin relaxation timeCameron . In the inset to Fig. 1 we plot vs. q at 295 K (lower points) and 5 K (upper points), on logarithmic axes. Here is independently determined from the decay rate of the circular dichroism induced by a circularly polarized pump beamBar-Ad (see supplementary information). A comparison of the 295 K data with a line of slope two shows that the decay of the grating is well described by diffusive dynamics, with 130 cm2/s and = 50 ps.
Next, we examine the spin-grating dynamics at 50 K. As shown in the inset, the initial decay rates at 5 K are linear in q at the higher wavevectors. The change in power law exponent from two to one indicates that a crossover from diffusive to ballistic dynamics takes place as the sample temperature is lowered. In the ballistic regime electrons propagate a distance comparable to the grating wavelength, , without scattering and the initial decay rate is , the reciprocal of the time required for an electron moving with the Fermi velocity to traverse a distance .
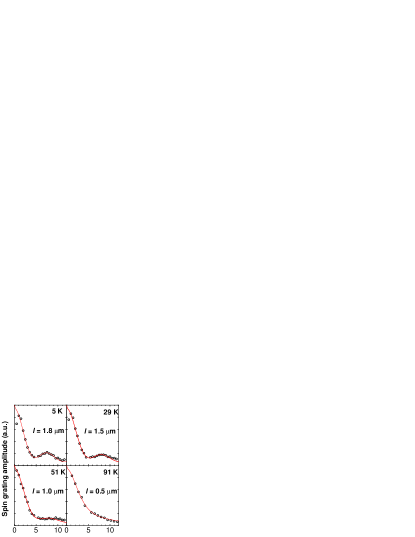
Although the grating’s initial decay rate saturates near when reaches 50 K, its time dependence continues to change as is lowered further. Fig. 2 shows the grating amplitude as function of time for several temperatures between 5 K and 100 K, measured with a grating wavevector of 2.5 cm-1 (the indicated is the lattice temperature, which is below the electron temperature, as will be discussed later). An oscillatory structure appears in the decay curves, becoming increasingly pronounced as decreases. The growth of these oscillations is a consequence of the increase of the mean-free-path, , in the regime where .
To determine from data such as those in Fig. 2 we use an expression for the time dependence of a spin fluctuation that is applicable throughout the diffusive-ballistic crossover regime. If a spin polarization wave is introduced at , its subsequent time-dependence is the Fourier transform of , where is the dynamic spin diffusivity. In the limit ,
| (1) |
where Eq. 1 extrapolates from the small- limitRammer to the ballistic regime. In attempting to fit the grating decay curves in the plateau regime, we found that Eq. 1 is not quite sufficient to describe the data. It is necessary to add to the Fourier transform of a small, slowly decaying exponential with relative initial amplitude and characteristic time 25 ps. We speculate that this slow exponential may originate from a small fraction of localized electrons. The solid lines through the data points in Fig. 2 show the results of the fitting procedure, with fitting parameters , , and the amplitude and time constant of the slow exponential. Despite the complicating presence of the slow exponential, we believe that the fits give an accurate indication of , as this is the only parameter that determines the rate at which the oscillations are damped. Finally, the spin diffusion coefficient is determined from the relation .
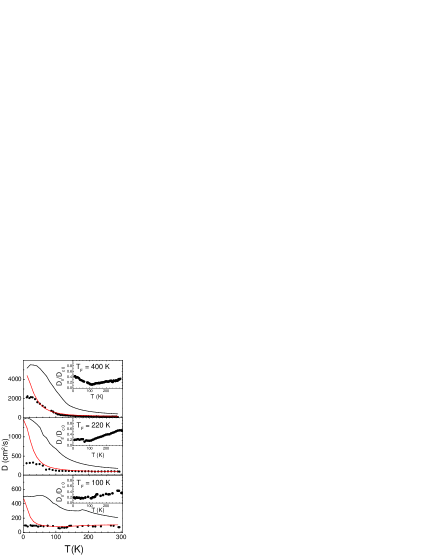
The temperature dependence of obtained from our analysis of the spin-grating dynamics is shown in Fig. 3 for QW’s of different electron density. For the two lower density samples (middle and lower panels), the dynamics were diffusive at all , consistent with their lower mobility. To characterize charge transport in the same set of samples, we performed 4-probe measurements of the 2D charge conductance, , carrier density, , and mobility, , on chips from the same set of wafers. Together, these measurements allow us to test the assumption that the scattering processes that control spin diffusion and charge conduction are the same. The link between conductance and diffusion coefficient is the Einstein relation, , where and are the spin conductance and susceptibility, respectively. If the spin and charge scattering rates were the same (i.e. ), then would equal ,CastellaniThermal where and is the noninteracting susceptibility (see supplementary information; is the density of states at the Fermi energy and is Boltzmann’s constant). Physically, is the quasiparticle diffusion coefficient CastellaniThermal , approaching and in the degenerate and nondegenerate regimes, respectively. , calculated from the 4-probe transport data and plotted in Fig. 3, is considerably larger than at all and for each of the samples. The ratio is far greater than can be accounted for by many-body enhancement of the spin susceptibility, as the factor is less than 1.4 in this range of electron densityYarlagaddaSpinSusceptibility ; KwonQuantumMC .
The contrast in the diffusion coefficients of charge and spin is surprising, as the assumption is widely used in modeling spin transport in semiconductors. However, this assumption fails to take into account e-e collisions, whose rate can be much faster than those of impurity or phonon scattering. The e-e scattering events can be ignored in the description of charge transport because they conserve total momentum. However, they can have a profound effect on spin transport, as illustrated in Fig. 4. For the collision depicted between electrons with opposite spin, the charge current is conserved while the spin current reverses direction.
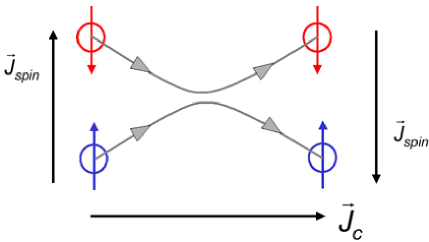
D’Amico and Vignale (DV) have proposed that the microscopic process shown in Fig. 4 can change the nature of macroscopic spin transport. Seen macroscopically, e-e collisions transfer momentum between the spin-up and spin-down populations, creating a force damping their relative motion that DV term “spin Coulomb drag” (SCD)D'AmicoEurophysLett . Spin diffusion, which requires a counterflow of the spin populations, is damped by SCD, while charge diffusion is not. (The recently observed KatoSpinHall ; WunderlichSpinHall spin Hall effect also involves the counterflow of spin populations, and so should be damped by SCD.) According to DV D'AmicoEurophysLett , the reduction of relative to is:
| (2) |
where is the charge resistance and is the spin drag resistance, parameterizing the rate of momentum exchange between spin and electrons. DV, and Flensberg and JensenSpinDrag2dFlensberg , have calculated for a 2DEG using the random phase approximation (RPA), obtaining results that depend only on the electron density of the quantum well.
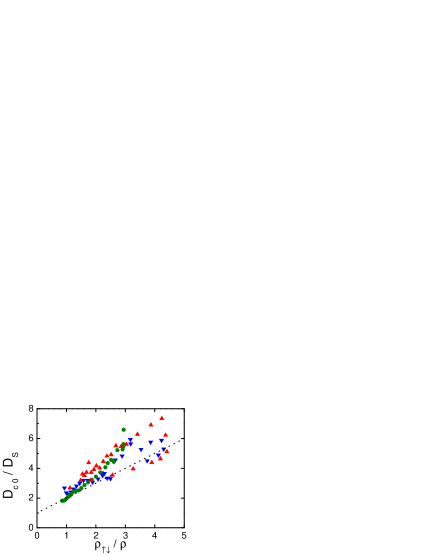
Eq. 2 predicts that despite the complex dependences of the individual diffusion coefficients, their ratio depends primarily on the single single factor, . We test this prediction in Fig. 5, without invoking any assumptions or adjustable parameters, by plotting (the inverse of Eq. 2) vs. for each of the three samples measured in this study. The transport coefficients are taken directly from our measurements, while was calculated using Eq. 2 of Ref. D'Amico2D_PRB . The resulting graph reveals the simple linear dependence of on predicted by Eq. 2 over a large range of , implying that SCD is indeed the origin of the large suppression of relative to . The fact that the slope is slightly greater than unity is consistent with the expectation that the many-body enhancement of relative to is small in this density regime.YarlagaddaSpinSusceptibility ; KwonQuantumMC Finally, the fact that extrapolates to near unity as indicates that the spin and charge diffusion coefficients approach each other in the limit that the spin drag resistance becomes smaller than the ordinary resistance. This result provides independent evidence that the spin grating and four-probe techniques used in this work accurately measure equilibrium spin and charge transport coefficients, respectively.
Returning to the -dependence shown in Fig. 3, the solid lines show the prediction of Eq. 2 for with the factor set equal to unity. As could be anticipated from the discussion of Fig. 5, SCD quantitatively accounts for the suppression of relative to over a broad range of temperature and electron density. It is clear, however, that the measured consistently departs from theory below 40 K. We believe that this discrepancy indicates that at low the photoexcited electron gas does not cool to the lattice . If the electron gas retains the heat, , deposited by the excitation, its temperature will rise to approximately , where eV/cm2- is the temperature coefficient of the electronic specific heat. We estimate eV/cm2, assuming that each absorbed photon deposits approximately 10 meV (the energy width of the laser pulse) into the Fermi sea. The resulting estimate for the minimum is indeed 35 K.
Finally, we note that SCD can be highly advantageous for spintronic applications, as it increases the distance that a spin packet can be dragged by an electric field, , before it spreads due to diffusion.KikkawaLateralDrag The length that a packet of width will drift before it broadens by a factor of two is . In the absence of SCD the ratio equals or in the degenerate or nondegenerate regimes, respectively, and is independent of the underlying scattering rates. In the degenerate regime, for example, ; drifting a spin packet farther than is only possible in a strong limit, where the potential drop across the packet exceeds the Fermi energy. Introducing SCD slows the counterflow of spin and electrons without affecting their co-propagation, amplifying by the factor . Clean materials with strong e-e scattering will have the largest values of , and hence be the best media for propagation of spin information.
I Quantum well characteristics.
The GaAs/Ga0.7Al0.3As samples were grown in the (100) direction by molecular beam epitaxy, and each consist of ten quantum wells of thickness 12 nm, separated by 48 nm barriers. The Si impurities were deposited in eight single atomic layers in the center 14 nm of each barrier to maximize their distance from the 2DEG. The carrier concentration, n, mobility, , and electrical resisitivity were measured using 4-probe transport techniques without illumination. For the samples with n of 7.8, 4.3, and 1.9 cm-2 per quantum well, at low temperature reached 240,000, 92,000, and 69,000 cm2/V-s, respecively.
II Optical methods.
The two interfering beams that generate the optical-helicity wave derive from a Ti:Sapphire laser, which produces a train of optical pulses with duration 100 fs, interpulse separation 11 ns and center wavelength 820 nm. The incident power density for most measurements was 500 W/cm2, corresponding to 6 W/cm2 absorbed per quantum well. For 35 K grating decay rates did not change when measured at incident powers down to 100 W/cm2, suggesting that photoinduced holes do not play a significant role in the electron spin transport (typical electron-hole recombination times were 750 ps). At low the grating decay rate increased slowly with decreasing power, consistent with the electron heating model described in the main text.
The grating wavevector was directed along the GaAs (01) direction. To detect the induced spin grating, we mix diffracted and transmitted probes to produce a photodetector current linear in the diffracted fieldHeterodyneVohringer ; HeterodyneChang ; GedikHetrodyne . The decisive advantage in this scheme is realized by modulating the relative phase of these two beams sinusoidally at 1.2 kHz. Synchronous detection with a lock-in amplifier at the modulation frequency leads to considerable rejection of laser noise and stray light.
References
- (1) Semiconductor Spintronics and Quantum Computation (eds. Awschalom, D. D., Loss, D., and Samarth, N. Springer-Verlag, Berlin, 2002).
- (2) Ziman, J. M. Electrons and phonons : the theory of transport phenomena in solids (Oxford University Press, New York, 2001).
- (3) Cameron, A. R., Riblet, P. & Miller, A. Spin gratings and the measurement of electron drift mobility in multiple quantum well semiconductors. Phys. Rev. Lett. 76, 4793–4796 (1996).
- (4) Meier, F. & Zakharchenya, B. Optical Orientation (North-Holland, Amsterdam, 1984).
- (5) Bar-Ad, S. & Bar-Joseph, I. Exciton spin dynamics in GaAs heterostructures. Phys. Rev. Lett. 68, 349–352 (1992).
- (6) Rammer, J. Quantum transport theory (Perseus Books, Reading, Mass., 1998).
- (7) Castellani, C., DiCastro, C., Kotliar, G., Lee, P. A. & Strinati, G. Thermal conductivity in disordered interacting-electron systems. Phys. Rev. Lett. 59, 477–480 (1987).
- (8) Yarlagadda, S. & Giuliani, G. F. Spin susceptibility in a two-dimensional electron gas. Phys. Rev. B 40, 5432–5440 (1989).
- (9) Kwon, Y., Ceperley, D. M. & Martin, R. M. Quantum Monte Carlo calculation of the Fermi-liquid parameters in the two-dimensional electron gas. Phys. Rev. B 50, 1684 1694 (1994).
- (10) D’Amico, I. & Vignale, G. Spin diffusion in doped semiconductors: The role of Coulomb interactions. Europhysics Letters 55, 566–572 (2001).
- (11) Kato, Y. K., Myers, R. C., Gossard, A. C. & Awschalom, D. D. Observation of the spin hall effect in semiconductors. Science 306, 1910–1913 (2004).
- (12) Wunderlich, J., Kaestner, B., Sinova, J. & Jungwirth, T. Experimental observation of the spin-hall effect in a two-dimensional spin-orbit coupled semiconductor system. Phys. Rev. Lett. 94, 047204/1–4 (2005).
- (13) Flensberg, K., Jensen, T. S. & Mortensen, N. A. Diffusion equation and spin drag in spin-polarized transport. Phys. Rev. B 64, 245308/1–7 (2001).
- (14) D’Amico, I. & Vignale, G. Spin coulomb drag in the two-dimensional electron liquid. Phys. Rev. B 68, 45307/1–7 (2003).
- (15) Kikkawa, J. M. & Awschalom, D. D. Lateral drag of spin coherence in gallium arsenide. Nature 397, 139–141 (1999).
- (16) Vohringer, P. & Scherer, N. F. Transient grating optical heterodyne detected impulsive stimulated raman-scattering in simple liquids. J. Phys. Chem. 99, 2684–2695 (1995).
- (17) Chang, Y. J., Cong, P. & Simon, J. D. Optical heterodyne-detection of impulsive stimulated raman-scattering in liquids. J. Phys. Chem. 99, 7857–7859 (1995).
- (18) Gedik, N. & Orenstein, J. Absolute phase measurement in heterodyne detection of transient gratings. Opt. Lett. 29, 2109–2111 (2004).
We thank I. D’Amico and G. Vignale for sending us numerical evaluations of their integral expression for the spin drag resistance. This work was funded by the US DOE, DARPA, and NSF-DMR. We also gratefully acknowledge support from the Fannie and John Hertz Foundation (C.P.W.) and the Hellman Foundation (J.E.M.).
Correspondence and requests for materials should be addressed to C.P.W. (email: cpweber@lbl.gov).
42.65.Hw, 72.25.b, 75.40.Gb.