Imaginary Squashing Mode Spectroscopy of Helium Three B
Imaginary Squashing Mode Spectroscopy of Helium Three B
Abstract
We have made precision measurements of the frequency of a collective mode of the superfluid 3He-B order parameter, the imaginary squashing mode. Measurements were performed at multiple pressures using interference of transverse sound in an acoustic cavity. Transverse waves propagate in the vicinity of this order parameter mode owing to off-resonant coupling. At the crossing of the sound mode and the order parameter mode, the sound wave is strongly attenuated. We use both velocity and attenuation measurements to determine precise values of the mode frequency with a resolution between 0.1% and 0.25%.
PACS numbers: 67.57.Jj, 67.57.-z, 43.20.Ks, 43.35.Lq
1 INTRODUCTION
Of the collective modes in 3He-B, the imaginary squashing (ISQ) mode has been measured with considerably less precision than the real squashing (RSQ) mode. The ISQ mode couples strongly to longitudinal sound and therefore has been difficult to resolve[1]. As a result, detailed analysis of the corrections to the collective mode spectrum of the type performed on RSQ mode data has not been possible for the ISQ mode. To first order, these modes have frequencies proportional to the gap:
| (1) |
where (RSQ) and (ISQ). Measurements have shown that the RSQ mode frequencies deviate from this value and Sauls and Serene[2] have shown that this is because the collective mode frequencies are strongly influenced by both quasi-particle interaction effects and -wave pairing. We have made measurements using the interference of transverse sound in an acoustic cavity to resolve the ISQ mode frequencies with greater precision than previously reported.
2 RESULTS AND DISCUSSION
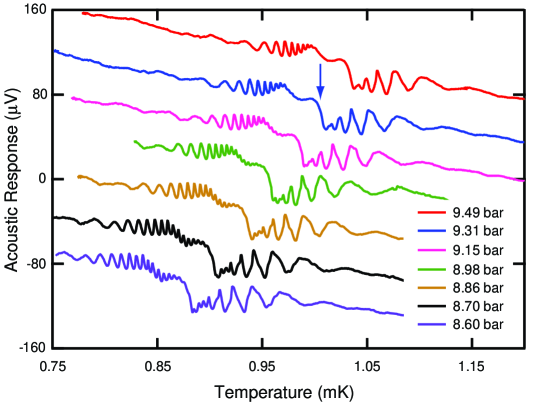
An acoustic cavity is formed from an AC-cut quartz transducer and a reflecting plate separated by monodispersed latex microspheres. Using an electrical-impedance spectrometer in a bridge configuration, we have measured the transverse acoustic impedance of superfluid 3He as a function of temperature at high frequencies. The acoustic impedance is given by[1] , where is the complex phase velocity and . The acoustic impedance is simultaneously sensitive to changes in the (normal fluid) density, ; phase velocity, ; and attenuation, . Fig. 1 displays the acoustic impedance as the temperature is lowered through the imaginary squashing mode at a fixed transverse sound frequency. As the temperature nears that of the ISQ mode, transverse sound begins to propagate due to off-resonant coupling to the mode[3, 4, 5], as described in Eq. (2). This results in the interference pattern seen on the high temperature side of the mode. The attenuation decreases with decreasing temperature and the interference oscillations become larger. With further decrease in temperature the pattern is quenched owing to resonant coupling to the ISQ, which increases the attenuation. The standing transverse waves reappear on the low temperature side of the ISQ mode and finally die off as the off-resonant coupling becomes weak. This is the first time that transverse sound has been detected at temperatures below the ISQ.
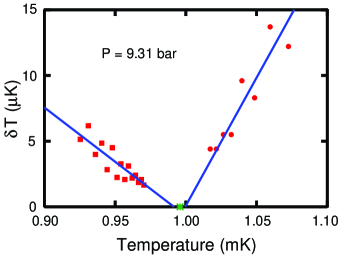
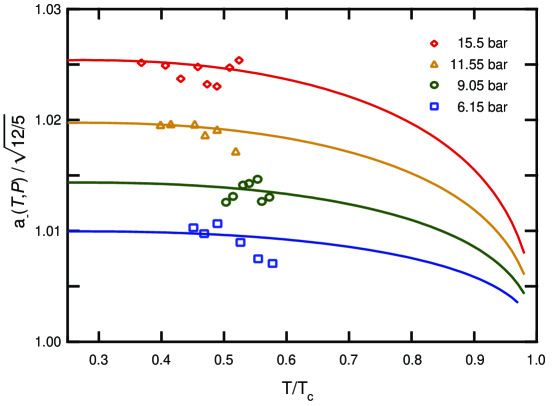
The proximity to the ISQ mode determines the phase velocity, resulting in the period of the oscillations becoming smaller upon approaching the mode crossing. We have used the period of the oscillations, to precisely determine the crossing of the transverse sound mode with the imaginary squashing mode. We plot the temperature difference between the peak and trough of the acoustic impedance versus their average temperature for one particular frequency and pressure in Fig. 2. The data on either side of the mode are independently fit to determine at what temperature the period goes to zero. The position of the ISQ mode at the measurement frequency is assigned to be the average of these two temperatures. This is repeated for all pressures and frequencies. In Fig. 3, we plot the ISQ mode as versus reduced temperature. Strong coupling is taken into account, by using the weak-coupling plus form[6] of the gap, , as tabulated in Ref. \onlineciteHal90. To take data at a fixed acoustic frequency we can tune the gap amplitude by varying the pressure over a small range. For the lowest frequency data the pressure variation was 0.5 bar, increasing to 1 bar at the highest frequency. Data taken in this way can be converted to a constant pressure, using Eq. (1). The data in Fig. 3 is plotted for fixed pressures. The temperature of the mode crossings have an uncertainty between 5 and 15 , yielding an uncertainty in between 0.1% and 0.25%.
In order to confirm that our determinations of the ISQ mode crossings are accurate, we compare our data with the theory of Moores and Sauls[3]. They have shown that the dispersion of transverse sound is given by,
| (2) |
where is the Fermi velocity, is the measurement frequency, is the ISQ mode frequency, is the Tsuneto function and is a Fermi liquid parameter derived from measurement of the heat capacity. is the width of the mode, with an approximate form[3] of and Hz. It is this mode width that allows for transverse sound propagation at temperatures below the ISQ mode. Solving Eq. (2) at temperatures low compared with , where the first term goes to zero, one finds that there are no corrections to the mode frequencies because of non-zero , so-called dispersion corrections. The next correction that remains is of order which is considerably smaller than the uncertainty in our measurement.
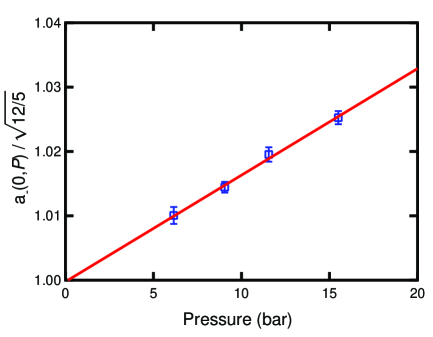
Note that the ISQ mode frequencies in Fig. 3 lie above that given by Eq. (1). This is the opposite of the RSQ mode[1], where the mode frequencies lie below the value of . Sauls and Serene[2] have shown that normal state quasi-particle interactions as well as pairing interactions higher than -wave, namely -wave, influence the collective mode frequencies. For the sake of brevity, these higher order effects will be discussed in a future paper. In Fig. 4, we plot the zero temperature intercept of these fits , as a function of pressure. The line is an unconstrained fit to the data and demonstrates the internal consistency of the analysis. Note that at zero pressure . One expects that if quasiparticle and -wave interactions are negligible and corrections to the temperature scale[7] are insignificant. Use of the BCS gap results in .
In summary, we have made new precision measurements of the imaginary squashing mode as a function of pressure. This precision derives from our use of the interference of high frequency transverse sound in an acoustic cavity and comparison with the theory of Moores and Sauls[3]. The measurements reveal that the mode frequencies lie above the value of . Extrapolating fits of the zero temperature ISQ mode frequencies to zero pressure recovers this value. In a future paper, we will discuss the implications of these measurements for the -wave pairing interaction strength.
ACKNOWLEDGMENTS
We acknowledge support from the National Science Foundation, DMR-0244099 and would also like to thank J.A. Sauls for helpful discussions.
References
- [1] W.P. Halperin and E. Varoquaux, in Helium Three, ed. by W.P. Halperin and L.P. Pitaevskii (Elsevier Science Publishers, Amsterdam 1990).
- [2] J.A. Sauls and J.W. Serene, Phys. Rev. B 23, 4798 (1981).
- [3] G.F. Moores and J.A. Sauls, Jour. of Low Temp. Phys 91, 13 (1993).
- [4] S. Kalbfeld, D.M. Kucera, and J.B. Ketterson, Phys. Rev. Lett. 71, 2264 (1993).
- [5] Y. Lee, T.M. Haard, W.P. Halperin and J.A. Sauls, Nature 400, 431 (1999).
- [6] D. Rainer and J.W. Serene, Phys. Rev. B 13, 4745 (1976).
- [7] D.S. Greywall, Phys. Rev. B 33, 7520 (1986).