[
Semiempirical Hartree-Fock calculations for pure and Li-doped KTaO3
Abstract
In extension of our previous study of KNbO3 by the semiempirical Hartree-Fock method we present parameterization and total-energy results for non-ferroelectric KTaO3 as a pure crystal (concentrating on the frozen phonon calculations) and that with Li impurities. The magnitudes of off-center Li displacements and the relaxation energies related to re-orientation of Li are calculated and compared with experimental estimates and earlier calculation results. The spatial extent of lattice relaxation around Li impurities and contributions from different neighbors to the relaxation energy are discussed.
pacs:
77.84.Dy, 61.72.Bb, 63.20.Ry, 71.15.Fv]
I Introduction
Potassium tantalate is a so-called incipient ferroelectric which develops a high value of the dielectric constant and considerable softening of a zone-center transverse-optical (TO) phonon, typical to other ferroelectric materials, but stays in a paraelectric state even at the lowest temperatures. This paraelectric state can be modified by doping, that may (in case of Nb substituting Ta) bring the system to a true ferroelectric state, or (for doping with a sufficiently small amount of Li or Na that enter the K sublattice) gives rise to a more complicated state, that is often referred to as orientational glass (see, e.g., Refs. [2, 3] for a review). As was discovered by Yacoby and Just[4], a Li ion substituting K in KTaO3, because of its smaller ionic radius, gets spontaneously displaced along one of the (six) [100] directions, towards an octahedral interstitial. This effect has been further studied in Refs. [5, 6, 7]. An experimental estimate of the displacement magnitude possible from 7Li NMR measurements (based on the measured values of the local electric field gradient, interpreted in terms of ionic displacement) is 0.86 Å according to Borsa et al.[5]. Another estimate cited by van der Klink et al.[7], in addition to the former one, is 1.2 Å. Höchli et al.[2] report the displacement magnitude of Å. These values are therefore to some extent dependent on the model in question that provides the fit to the data directly measurable by NMR.
Van der Klink and Khanna[8] calculated the energetics of the [100] Li displacement in a polarizable point-charge model, with Coulomb and polarization energy treated as those from point charges (of nominal ionic values), with a selected set of polarizabilities. The equilibrium displacement (1.35 Å) agrees well with the NMR-based estimation of 1.2 Å, but the model is probably too crude for handling a delicate balance between long-range electrostatic forces and short-range effects of chemical bonding in an incipient ferroelectric system. Particularly, it became well known since then that effective charges in perovskites deviate considerably from nominal ionic values, and the lattice relaxation for instance in the KTaO3:Li system gives a substantial contribution to the energy lowering on a Li displacement.
Several studies on Li in KTaO3 have been done with the use of the shell model which is more sophisticated than the models dealing with point charges or point dipoles. Stachiotti and Migoni[9] calculated equilibrium displacements of Li and neighboring atoms making use of the static lattice Green function method formulated on top of the nonlinear shell model, with anisotropic core-shell couplings of the oxygen ion. The drawback of this approach is that the anisotropic (fourth-order) interaction was allowed for the O–Ta bond only, but otherwise the model was fully harmonic. This seems to be hardly satisfactory for quantitative estimates, taking into account the large magnitude of the Li displacement. Moreover, there was an ambiguity in fitting the Li–O potential of the Born-Mayer type, based either on a study of lattice dynamics in LiKSO4[10], or on the study of defect energies of Li+ substituting Ba2+ in BaTiO3[11]. The results of Ref. [9], obtained with these two sets of parameters, differ considerably: the first set leads to a non-displaced position of Li, whereas the second set provides the [100] displacement by 1.44 Å that seems to be too large.
Exner et al.[12] performed another simulation of doped KTaO3 within the shell model, with the polarizability of the oxygen ion treated as isotropic, but, on the other hand, with anharmonic effects accounted for. Also the choice of short-range interaction was different in Ref. [12] from that of Ref. [9]. The equilibrium off-center Li displacement was found to be 0.64 Å, and the relaxation pattern of near neighbors to Li impurity essentially different from that provided by Staciotti et al.[9].
First-principles supercell calculations[13] by the full-potential linear muffin-tin orbitals method (FP-LMTO) made it possible to study the total energy as function of off-center Li displacements from its K-substituting position in KTaO3. This calculation, although not dependent on the choice of the particular interaction model or the fitting of the potential, had nevertheless its technical limitations. For one thing, the computational effort rises quite fast with the supercell size. The largest supercell treated in Ref. [13] included primitive cells, i.e. only 40 atoms. Another difficulty relates to the muffin-tin geometry used in FP-LMTO calculations (see, e.g., Refs. [14, 15]). This assumes all atoms to be circumscribed by non-overlapping spheres of reasonable size, so that the potential and charge density are expanded in spherical harmonics inside such spheres, and the interstitial region is treated in some different way. The large magnitude of the Li off-center displacement and, as a result, of lattice relaxation makes the universal non-overlapping packing for all geometries possible only with quite small spheres, that is disadvantageous for the numerical accuracy.
The method of our choice in the present study is therefore a tight-binding scheme with the basis of atom-centered orbitals, that makes no use of muffin-tin geometry whatsoever. At the same time, we want the scheme to be not much computationally demanding, in order to keep the calculations for large supercells feasible. What in some aspects closes the gap between empirical models (applicable to very large systems) and accurate ab initio schemes (that become very computationally demanding unless applied to supercells of quite modest size) are semiempirical methods which are able to produce reliable quantitative predictions, based on a limited number of basic (system-dependent) tunable parameters. We use the Intermediate Neglect of the Differential Overlap (INDO) method[16, 17, 18], which has been applied very successfully for the study of defects, both in the bulk and on the surface, in many oxide materials[17, 18, 19, 20, 21, 22, 23], as well as semiconductors[24, 25]. We recently applied this method to the study of KNbO3[26]. The method is essentially a simplified implementation of the Hartree-Fock formalism, with its obvious drawback of underestimating the correlation effects. The latter seems however to be of little importance when one studies an ionic insulator as KTaO3 and not, say, a metallic system. Moreover, the appropriate choice of parameters makes it possible to obtain reasonable trends in the total energy as function of displacements even if the band structure is somehow distorted in the Hartree-Fock calculation (see Ref. [26] for the discussion to this point for KNbO3). In tuning the INDO parameters, we primarily use earlier FP-LMTO calculations as a benchmark, also with some reference to experimental data (e.g., for phonons in KTaO3).
The objectives of the present study are the total energy as a function of off-center Li displacements in KTaO3, the 900-energy barrier in the hopping motion of displaced Li, and the lattice relaxation around the Li impurity. As a by-product, we provide the description of pure KTaO3 by the INDO method, including the calculation of phonons. The paper is organized as follows. In Sec. II, we discuss the choice of INDO parameters for our calculations of pure and Li-doped KTaO3. In Sec. III, we present the calculated transversal optic (TO) phonon frequencies and eigenvectors in KTaO3. In Sec. IV, we discuss the off-center Li displacement and the lattice relaxation around a Li impurity in KTaO3.
| Orbital | (a.u.-1) | (a.u.) | ||
|---|---|---|---|---|
| Ta | 2.05 | |||
| Ta | 2.05 | |||
| Ta | 1.70 | |||
| Li | 1.10 | |||
| Li | 0.80 |
II INDO parameterization for KTaO3
The description of the INDO approximation to the Hartree-Fock–Roothaan method is given in Refs. [17, 18]. The major formulae defining the parameters of the calculation are also cited in Ref. [26], where the choice of parameters relevant for the calculation of KNbO3 is discussed. As in Ref. [26], we performed the present calculations with the CLUSTERD computer code by Shidlovskaya, Shluger and Stefanovich[17, 18]. The parameters obtained there for K and O atoms are retained in the present calculation. In the following, we refer to Ref. [26] for the description of relevant parameters. For KTaO3, we had to specify (parameter of the Slater exponent), (central energy position), (parameter of the resonance interaction with other states) and (occupation number) for the Ta and Li states. Moreover, the two-center parameter had to be specified for Ta and Li in combinations with other atoms. The INDO calculations for Li halides[18, 27] and Li2SiO3 [17] have been done earlier, and some parameters tabulated. In contrast to these earlier works, we preferred to use both Li and states in the basis set, since the bonding in KTaO3:Li is much less ionic than in Li halides. Moreover, a very delicate balance of the interactions resulting in a ferroelectric instability favors the use of a more extended basis set. The recommended values of one-center Li parameters which are provided in the description of the INDO code [28] were found to be a reasonable choice (see below), and some discussion as for the choice of two-center parameter is given in Sec. IV. As for the Ta-related parameters, we took and values (with the exception of for Ta ) the same as for corresponding (, and ) Nb states in KNbO3, based on the similarity of the band structures. (Ab initio calculations of the band structure of both compounds have been performed earlier, e.g., by Neumann et al.[29]).
| Eigenvectors | |||||
|---|---|---|---|---|---|
| calc. (cm-1) | exp. (cm-1) | ||||
| 86a | |||||
| 80b | 25–106c; 81d; 85e | ||||
| 202a | |||||
| 172b | 196–199c; 199d; 198e | ||||
| 500a | |||||
| 528b | 551–550c; 546d; 556e | ||||
The final choice of the INDO parameters for KTaO3 was done based on a calculation of frozen -TO phonons. Since the three phonon modes which belong to the irreducible representation are different combinations of the vibrations of K, Ta, and O, they provide a good indication of the accuracy with which all essential interatomic interactions are treated. The TO phonon frequencies are measured in a number of experiments, and their eigenvectors determined in ab initio calculations. This makes the adjustment of and parameters, which affect the shape of the total energy hypersurface as function of a particular displacement and changes the frequencies and eigenvectors, a relatively easy task. To begin with, we took as a benchmark the total energy difference as function of individual displacements, determined in the full-potential LMTO calculation.[30] However, finally we aimed at obtaining the phonon eigenvectors with apparently even better accuracy, as calculated in Ref. [31] by the full-potential linear augmented plane waves (LAPW) method. The values of the INDO parameters we found to be best suited for the study of KTaO3:Li (in addition to those published already in Ref. [26]) are listed in Table I. The two-center parameters which account for the non-point character of the interaction of a valence orbital at the atom with the core of atom (see explicit definition in Refs. [18, 26]) are 0.023, 0.15, 0.39 and 0.58 for =O and =Li, O, K and Ta, correspondingly, and zero for =Ta, K, or Li.
The band gap in KTaO3 as calculated by the INDO method is 6.7 eV, that is close to, but larger than, 6.1 eV as obtained in a similar calculation for KNbO3[26]. The absolute value of the gap in the one-electron energy spectrum is known to come out systematically larger in the Hartree-Fock formalism as compared with spectroscopic data, because the unscreened Coulomb interaction shifts the unoccupied states too high in energy. Nevertheless, the difference between the gap values for two compounds is in agreement both with the experimental estimates (3.3 eV for KNbO3 vs. 3.8 eV for KTaO3) and the results of the calculations done in the local density approximation (1.4 eV vs. 2.1 eV[29, 31]). The (static) effective charges for KTaO3, as estimated from the INDO calculations based on the Mullikan population analyzis, are 0.62 (K), 2.23 (Ta) and 0.95(O). This reveals a somehow increased ionicity for KTaO3, in comparison with KNbO3[26], in general agreement with the tendency pointed out by Singh[31].
III -TO phonons in KTaO3
-TO phonons in the cubic perovskite structure are split by symmetry into three triple degenerate modes and one triple degenerate mode. Ab initio calculations of frequencies and eigenvectors have been done by Postnikov et al. [32] and by Singh [31]. Whereas calculated frequencies are in reasonable agreement between both calculations and with the experimental data available, there is some disagreement in the estimations of calculated eigenvectors, especially for the soft mode, as was discussed at length in Ref. [31]. The full-potential LAPW method is able to provide ultimately better accuracy than LMTO, due to a more extended basis set. Moreover, the indirect experimental indications of the displacements within the soft mode of KTaO3[33] seem to be in agreement with the LAPW results. Therefore we aimed at reproducing the eigenvectors of Ref. [31] with the proper choice of our INDO parameters. We performed our frozen phonon calculations at the experimental lattice constant (extrapolated to zero temperature) of 3.983Å. The elements of the dynamical matrix were found from the polynomial fit of the total energy as function of various displacements within the mode. Calculated frequencies and eigenvectors are shown in Table II. O1 stands for the oxygen atom at , and O2,3 for two (equivalent) atoms at and , for the vibrations along . K is at and Ta at of the cubic perovskite cell.
The agreement with the eigenvectors of Singh[31] is good, especially in what regards the relative displacement of potassium and tantalum with respect to each other and to the averaged displacement of the oxygen sublattice. The difference in the displacement patterns of O1 and O2,3 atoms within the soft mode seems, however, to be slightly overestimated in our case.
For the mode, our calculation gives the frequency of 260 cm-1, as compared to 264 cm-1 by Singh[31] and the experimental estimations of 264 cm-1 (Ref. [33]) to 274 cm-1 (Ref. [34]). This mode involves only the stretching within the O2,3 sublattice, therefore the eigenvector is uniquely defined. The excellent agreement of the frequency with the experimental value(s) suggests that our choice of the INDO parameters, that describe the O – O interaction as mediated by the central Ta atom, is sufficiently good.
IV Li off-center displacement and lattice relaxation
With the parameters of the INDO method properly tuned, one can obtain better accuracy in describing energy trends and lattice relaxation in Li-doped KTaO3 than was possible with the simple polarizable point-charge model[8] or within the shell model[9, 12, 35]). On the other hand, the INDO calculation allows to overcome the problems of previous first-principles FP-LMTO studies[13] in what regards small supercell size and the problems of the muffin-tin-spheres packing. Since the muffin-tin geometry is not used in a tight-binding INDO scheme, the problems of spheres packing do not exist there; at the same time, the method is much less computationally demanding and allows to treat larger supercells (all results discussed below refer to the KTaO3 supercell, i.e. that with 135 atoms in total, with one substitutional Li impurity). It is also possible to search for the optimized lattice distortion around the displaced impurity in the course of INDO calculation, that was not done in Ref. [13].
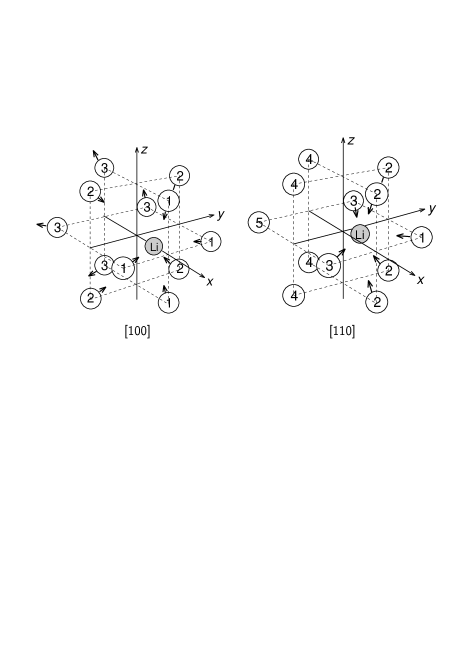
In addition to the parameters which relate to the KTaO3 bulk and which were tuned on the basis of frozen phonon calculations of Sec. II, and the one-site Li parameters borrowed from earlier INDO calculations for Li-containing ionic crystals[17, 18], we had to specify the two-center parameter , that enters the empirical expression for the interaction of the O valence electrons with the Li core and that effectively accounts for the finite size of the Li core and for the diffuseness of the O-related valence band states (see definition of this parameter and the discussion in Ref. [18]). Whereas already the first choice of =0 as proposed in Ref. [18] provides a qualitatively correct effect on the equilibrium geometry (Li displaces off-center along [100] by 0.4 Å), we found that a fine tuning of this parameter has a considerable effect on the magnitude of the displacement, and especially on the energy gain associated to it. For instance, =0.02 sets the energy gain at 60 meV at the 0.6 Å Li displacement, whereas =0.04 lowers the total energy by 100 meV at the 0.7 Å displacement. The best fit to the results of the FP-LMTO calculation[13] (that were done only for the Li displacement 0.3 Å) occurs at =0.023. We attempted to reproduce the FP-LMTO results for [100] and [110] Li off-center displacements – the former being related to the true ground-state configuration, and the latter to the saddle point between two adjacent displaced Li positions. The displaced Li ion with its neighboring oxygen atoms is shown schematically in Fig. 1. The total energy as function of [100] and [110] Li off-center displacements from FP-LMTO and from our present calculations is shown in Fig. 2.

Another sensitive question is the dependence of the results on the supercell size. The INDO method in the implementation we use produces in each iteration the one-electron energy spectrum in the point only. The calculation is normally being done with an extended supercell, so that the band dispersion over the correspondingly shrinked Brillouin zone is neglected. The enlargement of a supercell in the calculation for a perfect crystal is in a sense analogous to choosing a finer mesh for the k-space integration in a conventional band structure calculation. When treating an impurity system, another aspect becomes essential as well, that is, the effect of interaction between impurities situated in adjacent supercells should be kept negligible, or at least controllable. For the KTaO3:Li system, it means that the polarization cloud associated with a single off-center displaced Li impurity should be, in the ideal case, fully within the supercell chosen. The size of the polarized region associated with the [100]-displaced Li ion was estimated in the shell model calculation by Stachiotti and Migoni[9] to be about 5 lattice constants along the direction of displacement, with 99% of the ‘effective dipole’ polarization being confined to nearest Ta–O chains, that go parallel to the displacement. As is discussed below, the magnitudes of the atomic displacements and polarization in our present calculation is considerably smaller than those found in Ref. [9], and the relaxed neighbors to the Li impurity are well within the supercell. In order to be on safer side, we performed as well the calculations for a supercell doubled in the direction of Li displacement, i.e., , with a single [100]-displaced Li atom. The equilibrium displacement in this case is 0.62 Å, exactly as for the supercell (see Fig. 2), with the energy lowering 57.2 meV. The difference from the result for a supercell (62.0 meV) roughly represents the uncertainty related to the supercell size in our calculations.
The magnitude of the Li off-center displacement naturally agrees well with the FP-LMTO data (0.61 Å[13]), since the latter was an important benchmark in our choice of INDO parameters. We failed however to obtain the ideal matching with the FP-LMTO results in what regards both the off-center displacement and the energy gain in both [100] and [110] directions, as is seen in Fig. 2. Our equilibrium [100] off-center displacement is smaller than the estimate (1.35 Å) of the polarizable point-charge model[8], or 1.44 Å as calculated by Stachiotti and Migoni within the shell model[9]. On the other hand, our value is in good agreement with a more recent, and apparently more elaborately parameterized, shell model calculation by Exner et al. (0.64 Å, Ref. [12]).
The energy gain due to the Li off-center displacement is not directly measurable in an experiment, but there are estimations for the -energy barrier between, say, [100] and [010]-displaced positions to be 86 meV[8]. The hoppings between such adjacent positions may only occur via the [110] saddle point (see Fig. 2). Our estimate of the energy difference between [100] and [110] minima is 30.2 meV, roughly two times larger than in the FP-LMTO calculation[13], but much less than the experimental estimate. The origin of this discrepancy, as has been mentioned in Ref. [13], is most probably related to the lattice relaxation around the displaced Li ion, that makes the net energy gain from the displacement larger, and the -activation energy (involving now the displacement of many atoms) correspondingly higher. Indeed, the second harmonic generation-based estimates of the activation barrier[36] reveal two types of processes, apparently one involving the lattice relaxation (with the barrier height 86.2 meV) and another one that is too fast for the lattice to follow, with the barrier 14.7 meV.

In order to clarify this point, we performed a lattice relaxation of several shells of neighbors to the displaced Li ion, for the cases of [100] and [110] displacements. The relaxed coordinates of atoms are given in Tables III and IV, where the oxygen atoms are numbered consistently with Fig. 1. The total energy values resulting from the gradual inclusion of neighbor relaxation are shown in Fig. 3. We found the relaxation of twelve nearest oxygen atoms essential, and the effect of relaxing nearest Ta and more distant atoms to be negligible, in what regards the effect on the total energy. The energy gain in the fully relaxed [100]-displaced configuration, with respect to a non-relaxed central Li position, is 158.9 meV; the energy gain in the relaxed [110]-configuration is 102.3 meV. Therefore, the enhancement of the excitation barrier due to relaxation effects is by a factor of two, but still not sufficient to reach experimentally expected 86 meV. This discrepancy may be due to the fact that in reality the -reorientation process of the impurity does not necessarily occur via the fully relaxed saddle-point configuration. Depending on the actual degree of relaxation around the saddle-point Li position, the barrier height is expected from Fig. 3 to be between 57 meV (full relaxation at the saddle point) to 127 meV (no relaxation).
| Atom | Lattice coordinates | Displacement | ||
|---|---|---|---|---|
| Li | 0 | 0 | ||
| 4O(1) | 0 | ; | ||
| 4O(2) | ; | |||
| 4O(3) | 0 | ; | ||
| Atom | Lattice coordinates | Displacement | ||
|---|---|---|---|---|
| Li | 0 | |||
| 1O(1) | 0 | |||
| 4O(2) | ; ; | |||
| 2O(3) | 0 | ; | ||
| 4O(4) | ||||
| 1O(5) | 0 | |||
It should be noted that the spatial range of polarization is not so large in our calculation as follows from the shell model results of both Ref. [9] and [12], and the displacements of twelve nearest oxygen atoms around the Li ion are, generally, smaller in our case. There are also some qualitative differences in the displacement pattern. The largest striking, the O(2) atoms (as labeled in Table III) follow the Li displacement in our calculation, whereas they move away from the displaced Li ion in both shell model calculations cited. This is probably due to an oversimplified parameterization of the interaction potential used in the shell model. In the INDO method, no special approximation is introduced for the description of the chemical bonding, therefore our results seem to be more reliable. The numerical values of the displacements may, however, be somehow refined in subsequent calculations with larger unit cells.
V Summary
As an extension of our previous study of ferroelectric KNbO3 with a semiempirical INDO method, we performed calculations for pure paraelectric KTaO3, concentrating on TO phonon frequencies as a benchmark for fine tuning of our INDO parameterization. In a series of supercell calculations for Li-doped KTaO3, tuned in such a way as to reproduce the energetics of the Li off-center displacement previously found in FP-LMTO calculations, we analyze the relaxation of near neighbors to the Li impurity, and the impact of this relaxation on the reorientational energy barriers. The relaxation pattern in some aspects differs from that calculated earlier within the shell model. The study of the interaction between Li impurities in a polarized lattice seems feasible with the method used.
Acknowledgements.
The work has been done as part of the German-Israeli joint project “Perovskite-based solid solutions and their properties”. Financial support by the Niedersächsische Ministerium für Wissenschaft und Kultur and by the Deutsche Forschungsgemeinschaft (SFB 225) is gratefully acknowledged. The authors are grateful to E. Stefanovich for fruitful discussions.REFERENCES
- [1] On leave from Institute of Solid State Physics, University of Latvia, Riga. Electronic address: reglitis@acad.latnet.lv
- [2] U. T. Höchli, K. Knorr, and A. Loidl, Adv. Phys. 39, 405 (1990).
- [3] B. E. Vugmeister and M. D. Glinchuk, Rev. Mod. Phys. 82, 993 (1990).
- [4] Y. Yacoby and S. Just, Solid State Commun. 15, 715 (1974).
- [5] F. Borsa, U. Höchli, J. J. van der Klink, and D. Rytz, Phys. Rev. Lett. 45, 1884 (1980).
- [6] Y. Yacoby, Z. Phys. B 41, 269 (1981).
- [7] J. J. van der Klink, D. Rytz, F. Borsa, and U. Höchli, Phys. Rev. B 27, 89 (1983).
- [8] J. J. van der Klink and S. N. Khanna, Phys. Rev. B 29, 2415 (1984).
- [9] M. G. Stachiotti and R. L. Migoni, J. Phys.: Cond. Mat. 2, 4341 (1990).
- [10] S. Chaplot and K. Rao K, Phys. Rev. B 35, 9771 (1987).
- [11] G. Lewis and C. Catlow, J. Phys. Chem. Solids 47, 89 (1986).
- [12] M. Exner, C. R. A. Catlow, H. Donnerberg, and O. F. Schirmer, J. Phys.: Cond. Mat. 6, 3379 (1994).
- [13] A. V. Postnikov, T. Neuman, and G. Borstel, Ferroelectrics, 164, 101 (1995).
- [14] M. Methfessel, Phys. Rev. B 38, 1537 (1988).
- [15] S. Yu. Savrasov and D. Yu. Savrasov, Phys. Rev. B 46, 12181 (1992).
- [16] J. A. Pople and D. L. Beveridge, Approximate Molecular Orbital Theory, McGraw-Hill, New York, 1970.
- [17] A. Shluger, Theoret. Chim. Acta (Berl.) 66, 355 (1985).
- [18] E. Stefanovich, E. Shidlovskaya, A. Shluger, and M. Zakharov, phys. stat. sol.(b) 160, 529 (1990).
- [19] A. Shluger and E. Stefanovich, Phys. Rev. B 42, 9664 (1990).
- [20] E. V. Stefanovich, A. L. Shluger, and C. R. A. Catlow, Phys. Rev. B 49, 11560 (1994).
- [21] A. Stashans, E. A. Kotomin, and J.-L. Calais, Phys. Rev. B 49, 14854 (1994).
- [22] E. A. Kotomin, A. Stashans, L. N. Kantorovich, A. I. Lifshitz, A. I. Popov, I. A. Tale, and J.-L. Calais, Phys. Rev. B 51, 8770 (1995).
- [23] A. Stashans, S. Lunell, R. Bergström, A. Hagfeldt, and S.-E. Lundqvist, Phys. Rev. B 53, 159 (1996).
- [24] E. V. Stefanovich and A. L. Shluger, J. Phys.: Cond. Mat. 6, 4255 (1994).
- [25] A. Stashans and M. Kitamura, Solid State Commun. 99, 583 (1996).
- [26] R. I. Eglitis, A. V. Postnikov, and G. Borstel, Phys. Rev. B 54, 2421 (1996).
- [27] A. L. Shluger and E. A. Kotomin, phys. stat. sol.(b) 108, 673 (1981).
- [28] E. Stefanovich, private communication.
- [29] T. Neumann, G. Borstel, C. Scharfschwerdt, and M. Neumann, Phys. Rev. B 46, 10623 (1992).
- [30] A. V. Postnikov, T. Neumann, G. Borstel, and M. Methfessel, Phys. Rev. B 48, 5910 (1993).
- [31] D. J. Singh, Phys. Rev. B 53, 176 (1996); Ferroelectrics (in press).
- [32] A. V. Postnikov, T. Neumann, and G. Borstel, Phys. Rev. B 50, 758 (1994).
- [33] C. H. Perry, R. Currat, H. Buhay, R. M. Migoni, W. G. Stirling, and J. D. Axe, Phys. Rev. B 39, 8666 (1989).
- [34] H. Vogt and H. Uwe, Phys. Rev. B 29, 1030 (1984).
- [35] M. G. Stachiotti, R. L. Migoni, and U. Höchli, J. Phys.: Cond. Mat. 3, 3689 (1991).
- [36] P. Voigt and S. Kapphan, J. Phys. Chem. Solids 55, 853 (1994).
- [37] C. H. Perry and T. F. McNelly, Phys. Rev. 154, 456 (1967).
- [38] P. A. Fleury and J. M. Worlock, Phys. Rev. 174, 613 (1968).