[
Phase diagram of second layer of 4He adsorbed on graphite
Abstract
Using realistic helium-helium and helium-graphite interactions and the path integral Monte Carlo method, we are able to identify gas, superfluid liquid, commensurate-solid, and incommensurate- solid phases, and the coexistence regions between them, for the second layer of 4He on graphite. The phase boundaries and the specific heat are in good agreement with experiment. The appearance and disappearance of superfluidity with increasing coverage can be explained by the growth of coexistence phases, as was observed by torsional oscillator experiments.
pacs:
PACS numbers 67.70.+n, 67.40 Kh]
Films of 4He adsorbed on graphite have a very rich phase diagram and provide an excellent realization of nearly two-dimensional (2D) phenomena. Several interesting phases occur, including fluid phases, a variety of commensurate structures, and incommensurate-solid phases[1, 2, 3]. These phases and the coexistence regions that separate them are governed by a delicate balance of adatom and substrate interactions. Furthermore, the large zero-point motion of the helium atoms implies that quantum effects such as particle permutations play an important role in the phase diagram.
Many experimental studies of the helium-graphite system have been performed. Heat capacity measurements[1, 2, 3, 4] show that at low temperatures the first- and second-layer phase diagrams are similar, progressing with increasing density through gas, liquid, commensurate-solid, and incommensurate-solid phases, with coexistence regions separating these uniform phases. Neutron scattering[5, 6, 7] can detect the commensurate first-layer solid and the incommensurate first- and second-layer solids, but no direct evidence for the structure of the second-layer commensurate solid exists. It is believed[3] to be in partial registry with the first-layer helium solid, in analogy with 3He on graphite[8]. These experiments are supplemented by torsional oscillator (TO) measurements [9], which detect superfluidity only in the second and higher layers. The second layer thus presents a unique opportunity to study the interplay of superfluid and solid phases in two dimensions.
Superfluidity is caused by particle-permutation cycles of infinite length. Permutations apparently do not play an important role in the first layer because no superfluidity has been detected, but are very important in the second and higher layers, which do have superfluid phases. Without including particle permutations, which simplifies the simulation dramatically, the Monte Carlo simulation of Ref. [10] reproduced most of the interesting first-layer features. This provides additional evidence that permutations are not important in the first layer. In the second layer, the commensurate-solid phase of 3He has also been simulated without permutations[11], but one needs to simulate particle permutations in addition to particle moves in order to allow for the possibility that a superfluid phase may be found. In addition, it is expected that the other second-layer phases and their boundaries will be effected by the inclusion of particle permutations.
Using realistic helium-helium[12] and helium-graphite[13] interactions and a path integral Monte Carlo (PIMC) method for simulating strongly correlated Bose systems that includes particle permutations, we have examined the second layer of 4He on graphite. For the first time with simulation, we are able to identify coverage regions where this system is in gas (G), superfluid liquid (L), commensurate-solid (C), and incommensurate-solid (IC) phases, and the coverage regions of the coexistence phases that separate them, namely, the G-L, L-C and C-IC phases. The realistic treatment of the substrate and first layer is needed to produce the C phase, which is absent in 2D calculations[14]. The phase boundaries are in reasonable agreement with heat capacity and torsional oscillator measurements [3, 9]. The experimentally observed reentrant superfluidity can be explained by this phase diagram. Superfluidity appears as increasing coverage causes a transition from gas-liquid to liquid and disappears at still higher coverage with the growth of liquid-commensurate solid coexistence. We further present the first simulation results for the superfluid phase and the first direct evidence for the solid for 4He on graphite. Finally, we obtain the specific heat for the L, C, and IC phases and find peaks at temperature values that are in reasonable agreement with experiment.
In the PIMC method both the spatial configurations of the particles and the possible permutations of particle labels must be sampled. A detailed outline of the application of PIMC to 4He systems can be found in Refs. [15]. We have developed a PIMC method based on these references and have tested it on bulk helium, reproducing the energy, specific heat, and superfluid density given in Refs. [16, 17]. Below, we briefly summarize how we have extended the method for simulating layered systems on a substrate. A detailed description will be given in a forthcoming publication[18]. An alternative approach for applying PIMC to films can be found in Refs. [19, 20]. We model the graphite substrate as a featureless slab, so the effective helium-graphite interaction depends only on the height of the helium above the substrate[13]. On the substrate we first place a layer of helium atoms at fixed height, frozen at triangular lattice sites. The first-layer height is set at the graphite’s potential minimum, 2.8 , and the density is fixed at its compressed value, 0.127 atom/[3]. Above this frozen layer, we place an active layer of helium atoms that are allowed to move in the simulation. The sampling then proceeds as described in Refs. [15], with the modification that effective helium-graphite interactions are added to the effective action. We use a starting temperature of 40 K.
The approximation that the first-layer atoms can be frozen is made in order to concentrate on the second-layer atoms. Available computer resources and time constraints make calculations with more than 50 active particles impractical. By freezing the first layer, we can perform calculations with a reasonable number of second-layer atoms and thus minimize finite-size effects and increase the number of density values that can be studied. The trade-off is that we ignore the response of the first layer to the growth of the second. This is known to lower the energy of a layer of helium adsorbed onto solid hydrogen[19]. However, experimental results indicate that freezing the first layer of helium on a graphite substrate is a reasonable approximation for the temperatures and densities of our simulation. First, the first layer has a Debye temperature that is greater than 50 K, and can be treated as a 2D Debye solid for temperatures as high as 3 K[21]. The temperatures in our simulation are as low as 200 mK and never exceed 2.22 K, so the first layer is relatively stiff for the conditions in our simulation. Second, although the first layer is known to be compressed by the growing second layer, this is most important at low second layer densities [4]. The densities of Ref. [4] are below the range of our simulation.
Density regions with phase coexistence at zero temperature can be identified by applying the Maxwell construction to the total ground state energy. A coexistence region in the thermodynamic limit will have a total ground state energy that is the weighted average of the two constituent phases’ energy values. In Monte Carlo simulations, the energy of the system will lie above the coexistence line, either because the system remains in an unphysical homogeneous phase or because creating the phase boundary has a finite energy cost. We can thus identify a coexistence region as the maximum range of densities in which all the intermediate energy values lie on or above a line connecting the endpoint values.
The ground state energy is not directly accessible using PIMC. We instead use a limiting process to identify temperatures at which the system is effectively in the ground state. All energy calculations used to identify phase regions in the Maxwell construction were performed at 200 mK. We then verified that these were ground state values by recalculating selected values at 400 mK. In all cases, the values at the two temperatures were within error bars, indicating that they had converged to their zero-temperature values. See for example Fig. 3(a).

Figure 1 shows the results for the density scans. Bounding densities for the L, C, and IC phases and their coexistence regions at zero temperature are indicated by vertical arrows. For clarity, we have subtracted from the energy values, where is the number of active particles and e K, the minimum energy per particle. All coexistence regions are identified using the total, not shifted, energy values. The procedure for identifying these regions is discussed in detail below.
The low density region of the second layer is known experimentally to be in the G-L phase. To identify this phase in our simulation, we assume that the gas phase at zero temperature has zero density and thus zero total energy. A coexistence line can then be drawn between 0.1270 atom/ and the density with the minimum energy per particle, which occurs between 0.174 and 0.178 atom/. This is the dashed line in Fig. 1. The best parabolic fit around the minimum gives atom/ for the density of minimum energy. The number in parenthesis is the error in the last digit. We identify the uniform phase region above as the L phase because configurations generated by PIMC have no spatial ordering, and the system is superfluid at low temperatures, as will be shown below. Finite-size effects on are small: a fit using results from a significantly smaller cell (approximately one-third the size) gave , which is the same value within error bars. All energy values for the densities between 0.1270 atom/ and lie above the coexistence line, so the system is in G-L coexistence for this density range. If the density of the gas phase at zero temperature is not zero then this approach gives a lower bound to the end of G-L coexistence.
The density can be compared to experiment. For K the second-layer heat capacity measurements in Ref. [3] show a probable G-L region roughly between 0.13 and 0.16 atom/. Within the resolution available from the data, this phase may terminate anywhere from 0.1600 atom/ up to, but not including, 0.1700 atom/ total coverage. Since the first-layer coverage in the experiment is between 0.120 and 0.127 for these densities, G-L coexistence terminates at second-layer coverages anywhere from 0.033 to 0.050 atom/. For comparison, the G-L phase terminates at the second layer coverage 0.0480(6) atom/ in our simulation. In the TO measurements, superfluidity is first observed at 0.174 atom/, indicating that the superfluid signal in the experiment becomes significant when the second layer is uniformly covered by the superfluid.
Turning now to the highest second-layer densities, we identify another unstable region, the C-IC phase in Fig. 1, between 0.2032 and 0.2096 atom/. The coexistence line is the straight, solid line in the figure that intersects the data at these two densities. The intermediate energy values lie on or above this line, so the region has coexisting phases. This coexistence is not a product of finite-size effects, since we were able to identify the same region in a much smaller simulation cell. Phase coexistence in fact becomes clearer in the larger system because we can examine more density values in the unstable region. The range we find is in good agreement with the coexistence region 0.2030 to 0.2080 atom/ that can be determined from the heat capacity peaks of Ref. [3].

The higher density phase of this coexistence region is known experimentally to be an IC solid, and it is conjectured that the lower density phase is a C solid. We can identify these phases by using simulation cells designed to exactly accommodate both the first- and second-layer solids. Figure 2 depicts instantaneous configurations of these two phases produced by the simulation. The large circles represent first-layer atom positions, and the small circles show second-layer atom positions for the configuration. The solid lines are drawn to emphasize the triangular structure of both solids. Figure 2(a) is an IC phase found at 0.2083 atom/ and 0.2 K. This phase is incommensurate because no supercell with dimensions less than the minimum simulation box dimension can be drawn that has both first- and second-layer atoms periodically repeated. Figure 2(b) depicts an instantaneous configuration of the C phase at 0.1996 atom/ and 0.5 K. Superlattice unit cells are indicated by the heavily shaded lines. Positions of both first and second layer atoms show a periodic repetition in each superlattice cell.
The presence of the C phase requires an L-C coexistence region between it and the liquid. The dash-dotted line of Fig. 1 is the L-C coexistence line found using the Maxwell construction. Its endpoints are 0.1905 and 0.1969 atom/. The intermediate energy values lie on the coexistence line within error bars. The L-C range is in reasonable agreement with the coexistence range 0.1871 to 0.1970 atom/ determined from heat capacity measurements[3]. TO measurements also indicate that the L-C region begins at about 0.187 atom/[9].
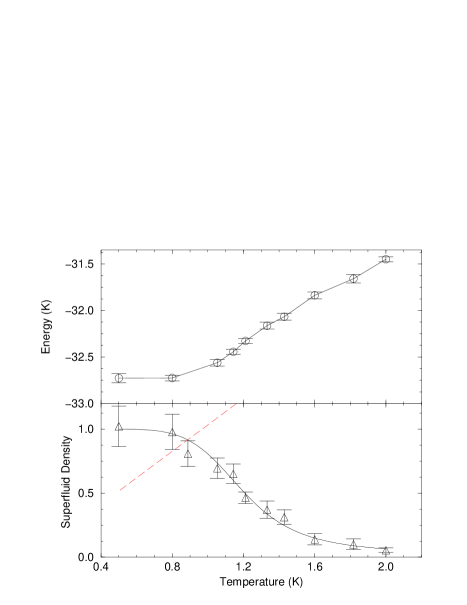
Having identified the L, C, and IC phases and their coexistence regions, we now examine some properties of each phase. The temperature dependence of the energy and superfluid density at a sample liquid density, 0.1778 atom/, is given in Fig. 3. The values were calculated using a cell with twelve active particles. The superfluid density is relative to the second-layer density. The solid curve in Fig. 3(b) is the best fit to the solution to the Kosterlitz-Thouless (KT) recursion relations [22] integrated to the size of the system. From the intersection of the KT line (dashed line in the figure) with the fit, we estimate the transition temperature to be .
The TO measurements of superfluidity in the second layer possess unusual features. No superfluidity can be detected until 400 mK, and the superfluid signal never approaches an asymptotic value. These features can be attributed to both phase coexistence and imperfections in the graphite substrate[9]. Our results support the conclusion of Ref. [9] that if TO measurements can be repeated using a more uniform graphite substrate, then behavior more typical of a 2D superfluid, which we find, will be observed.

The specific heat can be obtained by differencing the energy with respect to temperature. Figure 4 shows the results for the L, C, and IC phases. These can be compared to the heat capacity measurements of Ref. [3]. In the liquid phase, Fig. 4(a), the specific heat has a maximum at K, in fair agreement with the peak at 1 K in the heat capacity at the same coverage. The results for the solid, Fig. 4(b), show a peak at 1.57 K, in close agreement with the heat capacity measurements at a similar coverage. This provides some additional evidence that the C phase occurs in the experiment. Figure 4(c) shows the results for the IC solid. We obtain a peak at 0.70 K. The peak is at 1 K in the experiment.
This work was supported in part by the National Aeronautics and Space Administration under Grant No. NAG3-1841. Some of the calculations were performed using the facilities of the Supercomputer Computations Research Institute and the National High Magnetic Field Laboratory at the Florida State University.
REFERENCES
- [1] J. G. Dash and M. Schick, in The Physics of Liquid and Solid Helium, Part II, edited by K. H. Bennemann and J. B. Ketterson (Wiley, New York, 1978).
- [2] M. Schick, in Phase Transitions in Surface Films, edited by J. G. Dash and J. Ruvalds (Plenum, New York, 1980).
- [3] D. S. Greywall and P. A. Busch, Phys. Rev. Lett. 67, 3535 (1991); D. S. Greywall, Phys. Rev. B 47, 309 (1993).
- [4] S. E. Polanco and M. Bretz, Phys. Rev. B 17, 151 (1978).
- [5] M. Nielsen, J. P. McTague, and L. Passell, in Phase Transitions in Surface Films, edited by J. G. Dash and J. Ruvalds (Plenum, New York, 1980).
- [6] H. J. Lauter, H. Godfrin, V. L. P. Frank, and P. Leiderer, in Phase Transitions in Surface Films 2, edited by H. Taub, G. Torzo, H. J. Lauter, and S. C. Fain (Plenum, New York, 1991); H. J. Lauter, H. Godfrin, and P. Leiderer, J. Low Temp. Phys. 87, 205 (1992).
- [7] K. Carneiro, L. Passell, W. Thomlinson, and H. Taub, Phys. Rev. B 24, 1170 (1981).
- [8] V. Elser, Phys. Rev. Lett. 62, 2405 (1989).
- [9] P. A. Crowell and J. D. Reppy, Phys. Rev. Lett. 70, 3291 (1993); P. A. Crowell and J. D. Reppy, Phys. Rev. B 53, 2701 (1996).
- [10] F. F. Abraham and J. Q. Broughton, Phys. Rev. Lett. 59, 64 (1987).
- [11] F. F. Abraham, J. Q. Broughton, P. W. Leung, and V. Elser, Europhys. Lett. 12 (2), 107 (1990).
- [12] R. A. Aziz et al., Mol. Phys. 77, 321 (1992).
- [13] W. E. Carlos and M. W. Cole, Surf. Sci. 91, 339 (1980).
- [14] P. A. Whitlock, G. V. Chester, and M. H. Kalos, Phys. Rev. B 38, 2418 (1988).
- [15] D. M. Ceperley, Rev. Mod. Phys. 67, 279 (1995); D. M. Ceperley and E. L. Pollock, in Monte Carlo Methods in Theoretical Physics, edited by S. Caracciolo and A. Fabrocini (ETS Editrice, Pisa, 1992).
- [16] D. M. Ceperley and E. L. Pollock, Phys. Rev. Lett. 56, 351 (1986).
- [17] E. L. Pollock and K. J. Runge, Phys. Rev. B 46, 3535 (1992).
- [18] M. Pierce and E. Manousakis, to be published.
- [19] M. Wagner and D. M. Ceperley, J. Low Temp. Phys. 89, 581 (1992).
- [20] M. Wagner and D. M. Ceperley, J. Low Temp. Phys. 102, 275 (1996).
- [21] R. E. Ecke and J. G. Dash, Phys. Rev. B 28, 3738 (1983).
- [22] D. R. Nelson and J. M. Kosterlitz, Phys. Rev. Lett. bf39, 1201 (1977).