[
Melting of Charge/Orbital Ordered States in Nd1/2Sr1/2MnO3: Temperature and Magnetic Field Dependent Optical Studies
Abstract
We investigated the temperature ( 15 290 K) and the magnetic field ( 0 17 T) dependent optical conductivity spectra of a charge/orbital ordered manganite, Nd1/2Sr1/2MnO3. With variation of and , large spectral weight changes were observed up to 4.0 eV. These spectral weight changes could be explained using the polaron picture. Interestingly, our results suggested that some local ordered state might remain above the charge ordering temperature, and that the charge/orbital melted state at a high magnetic field (i.e. at 17 T and 4.2 K) should be a three dimensional ferromagnetic metal. We also investigated the first order phase transition from the charge/orbital ordered state to ferromagnetic metallic state using the - and -dependent dielectric constants . In the charge/orbital ordered insulating state, was positive and . With increasing and , was increased up to the insulator-metal phase boundaries. And then, abruptly changed into negative and , which was consistent with typical responses of a metal. Through the analysis of using an effective medium approximation, we found that the melting of charge/orbital ordered states should occur through the percolation of ferromagnetic metal domains.
pacs:
PACS number; 75.50.Cc, 72.15.Gd, 75.30.Kz, 78.20.Ci]
I INTRODUCTION
Doped manganites, with chemical formula R1-xAxMnO3 [R= La, Nd, Pr, and A= Ca, Sr, Ba], have attracted lots of attention due to their exotic transport and magnetic properties, such as colossal magnetoresistance.[1] The coexistence of ferromagnetism and metallicity, for the samples near 0.3, had been explained by the double exchange model.[2] However, it was found that the double exchange interaction alone cannot explain the colossal magnetoresistance.[3] Additional mechanisms were proposed. Among them, two scenarios attracted most of attention: the polaron due to the Jahn-Teller distortion of Mn3+ ion[3, 4] and the orbital fluctuation.[5, 6]
On the other hand, some manganite samples with small bandwidths near 1/2 show intriguing charge ordering phenomena,[7] i.e. real space orderings of the Mn3+ and the Mn4+ ions. For manganites, the charge ordering is usually accompanied with orbital and antiferromagnetic ordering. For example, charge ordering in Nd1/2Sr1/2MnO3 leads to the d (d) orbital ordering and the CE-type antiferromagnetic spin ordering at a low temperature.[8] Moreover, it was found that some charge ordered states could be changed into ferromagnetic metallic states at a higher temperature and/or under a high magnetic field.[9] The transitions from charge/orbital ordered insulator to ferromagnetic metal are usually called ”melting” of charge/orbital ordered states.
There have been numerous optical investigations which tried to understand basic mechanisms of colossal magnetoresistance.[10, 11, 12] However, only a few works have been reported for optical responses of the charge/orbital ordered state.[13, 14, 15] Recently, Okimoto et al. reported the magnetic field dependent optical conductivity for a charge/orbital ordered manganite, Pr0.6Ca0.4MnO3, and that the optical responses under the magnetic field could be understood qualitatively in terms of an insulator-metal transition.[16] However, their measured spectral region was rather limited (i.e., from mid-infrared to visible), so details of the insulator-metal transition could not be addressed.
In this paper, we will report optical properties of Nd1/2Sr1/2MnO3. To get clear understanding on the insulator-metal transitions due to the melting of the charge/orbital ordered states, optical spectra were taken by varying either temperature () or magnetic field (). Our experimental data will be analyzed in terms of the polaron scenario. The changes of the optical response due to the melting of the charge/orbital ordered states will be explained in terms of the percolation model.
II EXPERIMENTAL
Nd1/2Sr1/2MnO3 single crystal was grown by the floating zone methods. Details of sample growth and characterization were reported elsewhere.[17] The -dependent resistivity was measured by the four-probe method and the magnetoresistance was obtained using the 20 T superconducting magnet. For optical measurements, the crystal was polished up to 0.3 m using the diamond paste. To remove surface damages due to the polishing process, we carefully annealed the sample again in an O2 atmosphere at 1000 just before optical measurements.[18]
Near normal incident reflectivity spectra were measured from 5 meV to 30 eV.[19] A Fourier transform spectrophotometer was used for 5 meV 0.8 eV, and a grating monochromator was used for 0.6 7.0 eV. Above 6 eV, we used the synchrotron radiation from the Normal Incidence Monochromator beam line at the Pohang Light Source. After the spectra were taken, the gold normalization technique was used to subtract surface scattering effects. In the frequency region of 5 meV 4 eV, the -dependent reflectivity spectra were taken using the liquid-He cooled cryostat. In the same frequency region, the -dependent reflectivity spectra were taken with spectrophotometers at National High Magnetic Field Laboratory.
The Kramers-Kronig analyses were used to obtain - and -dependent optical conductivity spectra . For these analyses, the room temperature reflectivity spectrum in the frequency region of 4 30 eV was smoothly connected. Then, the reflectivity at 30 eV was extended up to 40 eV, above which dependence was assumed. In the low frequency region, the reflectivity spectrum below 5 meV was extrapolated to be a constant for an insulating state or using the Hagen-Rubens relation for a metallic state.[20] To check the phase errors due to the extrapolations in the Kramers-Kronig analyses, we also independently measured optical constants in the frequency region of 1.5 5 eV using a spectroscopic ellipsometry. It was found that the data from the spectroscopic ellipsometry measurements agreed quite well with the Kramers-Kronig analyses results, demonstrating the validity of our extrapolations.
III DATA AND RESULTS
A dc resistivity

Figure 1(a) shows the -dependent dc resistivity curve of Nd1/2Sr1/2MnO3 which was taken with = 0 T. With decreasing , the dc resistivity value slightly decreases near the ferromagnetic ordering temperature ( 250 K), but it increases abruptly near the charge ordering temperature ( 150 K). The dc resistivity value at 4.2 K is estimated to be around 200 cm. This large value of the dc resistivity is known to be originated from real space charge/orbital ordering. With increasing , the dc resistivity value smoothly decreases initially and then experiences an abrupt decrease to 0.6 cm near 170 K. The dc resistivity values for the heating run are larger than those for the cooling run, suggesting that the melting of the charge/orbital ordered states has the nature of first order phase transition. Above 170 K, the dc resistivity values are nearly the same as those for the cooling run. Note that no apparent hysteresis can be observed near .
Figure 1(b) shows the -dependent dc resistivity curve of Nd1/2Sr1/2MnO3 which was taken at 4.2 K. With increasing , the dc resistivity value slowly decreases initially, but it suddenly decreases to 0.2 cm near 13 T. Above 13 T, the dc resistivity value doesn’t change at all within our experimental errors. With decreasing , the dc value does not change down to 7.5 T and starts to increase abruptly near 7.5 T. The dc resistivity curve shows a very strong hysteresis below 13 T: the dc resistivity values for the field-decreasing run are quite smaller than those for the field-increasing run. Note that the dc resistivity value ( 0.2 cm) for the ferromagnetic metal state at 17 T is lower than that ( 0.6 cm) for the same state at 170 K.
B Temperature dependent optical conductivity spectra

The -dependent of Nd1/2Sr1/2MnO3 are shown in Fig. 2(a). At room temperature (i.e. ), there are two broad peaks near 1.0 and 4.0 eV. When entering into the ferromagnetic metallic state (i.e. ), the broad 1.0 eV peak shifts to a lower energy, which accompanies large spectral weight changes. In addition, there is a small decrease of the spectral weight near 3.0 eV. Interestingly, even at a highly metallic state near 170 K, optical conductivity decreases below 0.5 eV and shows the Drude-like behavior below 0.1 eV. When entering into the charge/orbital ordered state (i.e. ), the spectral weights move to the opposite direction: namely, from a low to a high energy region. The optical conductivity spectrum at this charge/orbital ordered state shows an opening of optical gap, whose value is estimated to be about 0.1 eV. [This value is in reasonable agreements with the value obtained from recent photoemission experiments.[21]] In addition, the spectral weights near 3.0 eV are restored approximately to the values at .
The far-infrared are displayed in Fig. 2(b). Above , there are three optical phonon peaks, which are known as the external, the bending, and the stretching modes of the cubic perovskite.[22] In the temperature region of , the phonon features are screened and increase significantly. [The solid circle represents the dc conductivity value at 170 K.] Note that the Drude-like absorption behavior is not so clear.[23] Below , decrease quite drastically. At this low temperature, the bending and the stretching modes are splitted and corresponding phonon frequencies move to higher energies. Such changes in the phonon spectra can be understood in terms of the strong lattice distortion due to the charge/orbital ordering.[24]
C Magnetic field dependent optical conductivity spectra

The -dependent , which were taken at 4.2 K, are shown in Fig. 3(a). [Note that the spectra were measured with increasing .] At 0 T, the optical spectra are nearly the same as those at 15 K, displayed in Fig. 2(a). With increasing , the spectral weights near 1.2 and 2.7 eV are transferred to lower energy regions. The gap values seem to decrease and finally disappear above 13 T. Note that the -dependent spectral weight changes are similar to the -dependent spectral weight changes near . However, the spectra in the ferromagnetic metallic state of 17 T clearly show a Drude-like absorption feature, which is somewhat different from of the ferromagnetic metallic state at 170 K, displayed in Fig. 2(a).
The far-infrared under various are displayed in Fig. 3(b). At 0 T, the low temperature phonons can be seen clearly. With increasing , the phonon peaks become screened and the Drude peak seems to appear above 13 T. [The solid circle represents the dc conductivity value at 17 T.] Note that the Drude peak becomes clear and appears below 0.04 eV.
IV DISCUSSIONS
A A schematic diagram of optical transitions
Interpretations on of perovskite manganites have been quite different among experimental groups.[25] However, a correct interpretation is essential to understand physics of the colossal magnetoresistance and the charge/orbital ordering phenomena. Recently, we proposed a schematic diagram of based on the polaron scenario,[18, 25] which seems to explain most features of optical transitions in colossal magnetoresistance manganites observed by numerous group.[26] We want to extend the schematic diagram to include the charge/orbital ordered state.
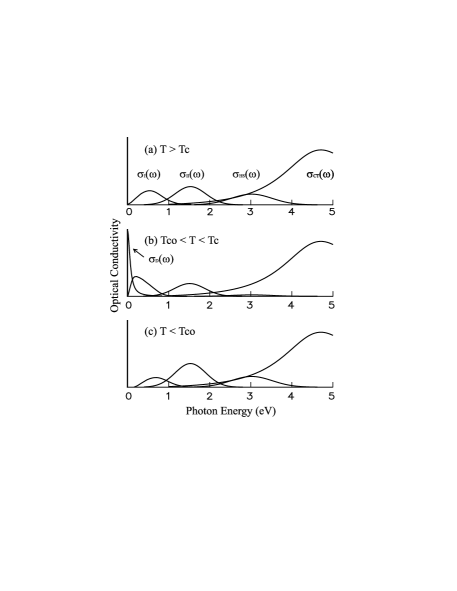
Figure 4 shows our proposed schematic diagram of optical transitions in Nd1/2Sr1/2MnO3: (a) , (b) , and (c) . Above , there are four main contributions for below 5 eV: (i) due to a small polaron absorption below 1.0 eV, (ii) due to an inter-orbital transition between the Jahn-Teller splitted levels of the Mn3+ ions near 1.5 eV, (iii) due to an optical transition between the Hund’s rule split bands near 3.0 eV, and (iv) due to a charge transfer transition from the O 2p band to the Mn 3d band near 4.5 eV. The optical transition between the Hund’s rule split bands represents e(t) e(t) and e(t) e(t) transitions. [This notation indicates the transition occurs between two eg bands with the same spin but different t2g spin background.] There have been numerous optical reports which support our assignments of the small polaron peak,[27, 28] the optical transition between Hund’s rule split bands,[29, 30] and charge transfer peaks.[10, 11, 19, 28] On the other hand, the existence of peak near 1.5 eV was observed by many workers,[11, 28, 31] but there remain some controversies for its origin.[32] We think that the most probable candidate is the inter-orbital transition at the same Mn3+ site. Although this transition is prohibited by the selection rule for an Mn atom, this transition could become possible due to the local lattice distortion of MnO6 octahedra and the strong hybridization between Mn 3d and O 2p orbitals.
For the ferromagnetic metallic region of , the small polaron peak will change into coherent and incoherent absorptions of a large polaron.[12, 33] The coherent absorption will appear as Drude-like optical conductivity spectra and the incoherent one as an asymmetric mid-infrared peak. The increase of electron screening and the decrease of lattice distortion in the metallic state will decrease the 1.5 eV peak somewhat. The optical transition between the Hund’s rule splitted bands will decrease, since all of the t2g spins will be aligned in the ferromagnetic state. And, the charge transfer peak remains to be nearly -independent.
Below , the coherent absorption of the free carrier will disappear due to the charge/orbital ordering. And, its spectrum will be similar to that for . However, there seems to be three minor but important differences. First, the optical gap due to charge/orbital ordering should appear. Second, the absorption peak due to the polaron hopping should decrease since such a hopping requires more energy in the antiferromagnetic ordered state. Third, the 1.5 eV peak should become stronger, since lattice distortion becomes larger in the charge/orbital ordered state.
B Temperature dependent spectral weight changes

For the quantitative analysis of -dependent electronic structure, we analyzed in terms of five peaks, discussed in Section IV. A:
| (1) |
For and , the Lorentzian functions were used. The simple Drude formula were used for . After subtracting the Drude and high frequency peaks in , we obtained the -dependent midgap component []. Note that the polaron absorption and the inter-orbital transition between Mn3+ sites are assigned as Peak I and Peak II, respectively.
Peak I and II were fitted with two Gaussian functions, as shown in Fig. 5. The solid circles represent the experimental after subtracting , , and . The fitting results with the Gaussian functions could explain the experimental data quite well. Using the integration of each Gaussian function, we derived the -dependent optical strengths, and , for Peak I and Peak II, respectively. We also obtained the strength of the Drude weight by integrating the corresponding Drude peak.

The -dependences of , , and are displayed in Figs. 6(a), (b), and (c), respectively. The total spectral weights due to polaron absorption, (), are also plotted in Fig. 6(d). [All units are cm-1eV.] With decreasing , starts to increase below and abruptly decreases below . The -dependence of is nearly opposite to that of . The -dependence of is similar to , but becomes zero for . And, starts to increase below and abruptly decreases below . When the sample becomes ferromagnetic below , it becomes metallic. Then, the polaron hopping contribution and the free carrier contribution should increase due to the alignment of t2g spins. Due to the increase of metallicity, the lattice distortion of the MnO6 octahedron will become reduced, resulting in decrease of . When the sample becomes antiferromagnetic below , the polaron hopping requires more energy and should decrease. The reduction of the metallicity makes increase and become zero very rapidly. These temperature dependences are explained in the schematic diagram in Fig. 4.
According to the polaron picture, the -dependence of can be explained more quantitatively. In (La,Pr)0.7Ca0.3MnO3, whose ground state is a 3-dimensional ferromagnetic metal, it was found that could be scaled with the -dependent double exchange bandwidth :[34]
| (2) |
where is the relative angle of neighboring spins and represents thermal average in the double exchange model.[35] This scaling behavior was explained in a model by Röder et al.[4] where the double exchange and the Jahn-Teller polaron Hamiltonian were taken into account. The dashed line shows for the 3-dimensional ferromagnet. Above , the agreement between and is quite good.
However, deviates from below . This deviation might be explained by a strong suppression of polaron absorption due to the CE-type antiferromagnetic ordering at the low temperature region. In the CE-type configuration, the eg conduction electrons are allowed to hop along the ferromagnetically aligned zigzag chains forming an effective 1-dimensional ferromagnet. In the 3-dimensional ferromagnet above , the polaron hopping is allowed to six neighboring Mn sites with parallel spins. But, in the 1-dimensional ferromagnetic chain, the polaron hopping is allowed only along the zigzag chain. Therefore, the transition from the 3-dimensional ferromagnet to the 1-dimensional zigzag chain will strongly suppress the polaron absorption near .
C Magnetic field dependent spectral weight changes
With the fitting process used in Section IV. B, we obtained -dependent changes of , , , and , at 4.2 K. Figure 7 shows the results of such fittings, and all of the optical strengths show strong hysteresis behaviors. During the field-increasing run, increases near 13 T and becomes nearly saturated above 14 T. During the field-decreasing run, remains nearly the same down to 8 T and then abruptly decreases. Note that the value of at 0 T after the completion of one cycle is larger than the initial value of . The -dependence of is nearly opposite to that of , but the -dependence of is similar to that of . Contrary to rather smooth changes of , , and , the change of is rather abrupt: the value of becomes nearly zero below 13 T for field-increasing run and below 7 T for field-decreasing run. Qualitatively, the -dependences of , , and , are quite similar to the -dependences of the corresponding strengths below . These -dependences can be explained using the schematic diagram in Fig. 4.

Values of at 4.2 K with various values of were shown in Fig. 6(d). The open circle, the asterisk, the solid triangle, and the solid square represent values of at 0, 12, 13, and 17 T, respectively. With increasing , increases. At 17 T, it finally reaches the value predicted by Eq. (2) for the 3-dimensional case. This result indirectly supports the fact that the charge/orbital melted state might be a 3-dimensional ferromagnetic metal. Note that the value of ( 170 K, 0 T) is by about 20 % smaller than that of ( 4.2 K, 17 T). This experimental fact agrees with recent magnetostriction measurement[36] and transmission electron microscopy work[37] that there exist a local charge/orbital ordering even above .
D Behavior of dielectric constants
To get a better understanding on the insulator-metal transition in Nd1/2Sr1/2MnO3, we looked into the real part of a dielectric constant . The - and the -dependent spectra are shown in Fig. 8(a) and (b), respectively. In the insulating state at 15 K, is positive and . With increasing , becomes slightly increased. Above 170 K, it becomes abruptly decreased and , which are consistent with typical responses of a metal. Note that the change in is rather abrupt near the insulator-metal boundary. Such interesting behaviors of can be observed more clearly in the -dependence. Up to the insulator-metal phase boundary ( 13 T), is increased and then abruptly decreased. The changes of and at 100 cm-1 under various are shown in Fig. 9(a) and (b), respectively. These figures also show strong hysteresis behaviors. The solid circles and the solid squares represent data during the field-increasing and the field-decreasing runs, respectively. It is clear that the abrupt change in occurs near the insulator-metal transition. Note that becomes large as the transition region is approached both from the insulating and from the metallic sides.

The divergence of near the insulator-metal transition has appeared in numerous models. According to the Herzfeld criterion,[38, 39] valence electrons are considered to be localized around nuclei and contribute to atomic polarizability. Near the insulator-metal transition, the polarizability diverges, so should also diverge. Above the transition, the restoring force of the valence electron vanishes, resulting in free carriers. Another is the Anderson localization model.[39] The polarizability of a medium is proportional to square of localization length. Since the localization length diverges near the insulator-metal transition, should diverge. [However, it is clear that the insulator-metal transition in Nd1/2Sr1/2MnO3 is not induced by disorder.]
Note that both of the above microscopic models deal with mainly in dc limit, so our infrared data cannot be well explained. And, it was found that VO2 films experienced an insulator-metal transition of the first order nature around 70 ∘C, and that their mid-infrared properties could be explained by a composite medium model which takes into account the evolution of domain growth during the first order phase transition.[40] In the composite medium model, the increase of near the insulator-metal transition can be interpreted as a dielectric anomaly related to percolation. Therefore, we decided to apply the effective medium approximation (EMA), which is a composite medium model predicting a percolation transition.

E Percolative phase transition
In EMA, it is assumed that individual grains, either metallic or insulating, are considered to be embedded in a uniform background, i.e., an ”effective medium” which has average properties of the mixture.[40, 41] A self-consistent condition such that the total depolarization field inside the inhomogeneous medium is equal to zero leads to a quadratic equation for an effective dielectric constant ,
| (3) |
where and represent the complex dielectric constants of the insulating and the metallic Nd1/2Sr1/2MnO3 phases, respectively. And and () represent volume fractions of the insulating and the metallic domains, respectively. In EMA, the percolation transition occurs at .
To apply EMA, we assumed that and could be represented by the experimental complex dielectric constants at 0 T and 17 T, respectively. And, we evaluated for various values of . The predictions of EMA are shown in Fig. 8(c). If (i.e. in the insulating side), increases when the insulator-metal transition is approached. If becomes larger than 1/3, the low frequency value of suddenly becomes negative. By comparing with Fig. 8(a) and (b), it is clear that the EMA results can explain the -dependent and the -dependent quite well. It should be noted that the percolation model can also explain the increase of near the insulator-metal transition. Near the percolation, effective capacitive coupling between the metallic clusters increase due to an increase of effective area and the decrease of spacing between the metallic clusters. This increase of coupling results in the increase of near the percolation transition. Therefore, it can be argued that the insulator-metal transition in Nd1/2Sr1/2MnO3 occurs through a percolative phase transition.
Recently, there have been lots of studies on the phase separations in doped manganites.[42, 43, 44, 45, 46, 47, 48] Our picture of the percolative phase transition agrees with such phase separation. The EMA calculation in Fig. 8(c) shows that the metallic domain can exist in the insulating states, i.e., below 150 K without , or below 13 T at 4.2 K. And it also shows that the insulating domain can exist in the metallic states of Nd1/2Sr1/2MnO3. The origin of the phase separations in doped manganites remains controversial. Some workers argue that the phase separation comes from the electronic origin,[46] and some workers argue that it comes from sample inhomogeneity.[47, 48] Further studies are required to solve this issue clearly.
V SUMMARY
We reported the temperature and the magnetic field dependent optical conductivity spectra of charge/orbital ordered manganites, Nd1/2Sr1/2MnO3. With variation of the temperature and the magnetic field, the large spectral weight changes were observed up to 4.0 eV. These spectral weight changes are discussed with polaron picture and local charge/orbital ordering. Moreover, using the analyses of dielectric constants, we showed that the melting of charge/orbital ordered states occurs through the percolation in the ferromagnetic metal domains and that optical conductivity should be explained by the two-phase coexistence picture between charge/orbital ordered insulator and the ferromagnetic metal domains.
Acknowledgements.
We acknowledge Professor J.-G. Park and Dr. K. H. Kim for discussion. We also thank Dr. H. C. Kim and Dr. H.-C. Ri for help in magnetoresistance measurements. This work was supported by the Korea Science and Engineering Foundation through the CSCMR at Seoul National University and by Ministry of Education through the Basic Science Research Institute Program No. BSRI-98-2416. The work by Y. M. was supported by a Grandt-In-Aid for Science Research from the Ministry of Education, Science, Sports and Culture, and from PRESTO, JST. Part of this work was preformed at the National High Magnetic Field Laboratory, which is supported by NSF Cooperative Agreement No. DMR-9016241 and by the State of Florida.REFERENCES
- [1] S. Jin, T. H. Tiefel, M. McCormack, R. A. Fastnacht, R. Ramesh, and L. H. Chen, Science 264, 413 (1994).
- [2] C. Zener, Phys. Rev. 82, 403 (1951); P. W. Anderson and H. Hasegawa, ibid. 100, 675 (1955).
- [3] A. J. Millis, P. B. Littlewood, and B. I. Shraiman, Phys. Rev. Lett. 74, 5144 (1995).
- [4] H. Röder, J. Zhang, and A. R. Bishop, Phys. Rev. Lett. 76, 1356 (1996).
- [5] S. Ishihara, J. Inoue, and S. Maekawa, Phys. Rev. B 55, 8280 (1997).
- [6] F. Mack and P. Horsch, Phys. Rev. Lett. 82, 3160 (1999).
- [7] C. H. Chen and S-W. Cheong, Phys. Rev. Lett. 76, 4042 (1996); S. Mori, C. H. Chen, and S-W. Cheong, Nature 392, 473 (1998).
- [8] H. Kuwahara, Y. Tomioka, A. Asamitsu, Y. Moritomo, and Y. Tokura, Science 270, 961 (1995).
- [9] Y. Tomioka, A. Asamitsu, H. Kuwahara, Y. Moritomo, and Y. Tokura, Phys. Rev. B 53, R1689 (1996).
- [10] Y. Okimoto, T. Katsufuji, T. Ishikawa, A. Urushibara, T. Arima, and Y. Tokura, Phys. Rev. Lett. 75, 109 (1995).
- [11] M. Quijada, J. Černe, J. R. Simpson, H. D. Drew, K. H. Ahn, A. J. Millis, R. Shreekala, R. Ramesh, M. Rajeswari, and T. Venkatesan, Phys. Rev. B 58, 16 093 (1998).
- [12] K. H. Kim, J. H. Jung, and T. W. Noh, Phys. Rev. Lett. 81, 1517 (1998).
- [13] H. L. Liu, S. L. Cooper, and S-W. Cheong, Phys. Rev. Lett. 81, 4684 (1998).
- [14] P. Calvani, G. De Marzi, P. Dore, S. Lupi, P. Maselli, F. D’Amore, S. Gagliardi, and S-W. Cheong, Phys. Rev. Lett. 81, 4045 (1998).
- [15] J. H. Jung, J. S. Ahn, J. Yu, T. W. Noh, J. Lee, I. Solovyev, and K. Terakura, (to be published).
- [16] Y. Okimoto, Y. Tomioka, Y. Onose, Y. Otsuka, and Y. Tokura, Phys. Rev. B 57, R9377 (1998); ibid. 59, 7401 (1999).
- [17] Y. Moritomo, H. Kuwahara, Y. Tomioka, and Y. Tokura, Phys. Rev. B 55, 7549 (1997).
- [18] H. J. Lee, J. H. Jung, Y. S. Lee, J. S. Ahn, T. W. Noh, K. H. Kim, and S-W. Cheong, Phys. Rev. B 60, 5251 (1999).
- [19] J. H. Jung, K. H. Kim, D. J. Eom, T. W. Noh, E. J. Choi, J. Yu, Y. S. Kwon, and Y. Chung, Phys. Rev. B 55, 15 489 (1997).
- [20] K. H. Kim, J. Y. Gu, H. S. Choi, D. J. Eom, J. H. Jung, and T. W. Noh, Phys. Rev. B 55, 4023 (1997).
- [21] A. Sekiyama, S. Suga, M. Fujikawa, S. Imada, T. Iwasaki, K. Matsuda, T. Matsushita, K. V. Kaznacheyev, A. Fujimori, H. Kuwahara, and Y. Tokura, Phys. Rev. B 59, 15 528 (1999).
- [22] K. H. Kim, J. Y. Gu, H. S. Choi, G. W. Park, and T. W. Noh, Phys. Rev. Lett. 77, 1877 (1996).
- [23] Similar to our results, Saitoh et al. [E. Saitoh, Y. Okimoto, Y. Tomioka, T. Katsufuji, and Y. Tokura, Phys. Rev. B 60, 10 362 (1999).] reported optical spectra for bandwidth controlled R0.6Sr0.4MnO3. For small bandwidth systems, they found that the low- optical spectrum tends to lose the Drude weight and becomes -independent. And they explained such behaviors using the instabilities triggered by small bandwidth.
- [24] T. Ishikawa, K. Ookura, and Y. Tokura, Phys. Rev. B 59, 8367 (1999).
- [25] T. W. Noh, J. H. Jung, and K. H. Kim, ”Physics of Manganites”, edited by T. A. Kaplan and S. D. Mahanti (Kluwer Academic/Plenum Publishers, New York, 1999) and references therein.
- [26] Recently, Mack and Horsch [Ref. 6] made a theoretical prediction on of doped ordered phase based on the orbital fluctuation scenario. We measured of Pr1/2Sr1/2MnO3, which is known to have such ordered phase. However, our experimental could not be explained by the orbital fluctuation scenario. [Refer to J. H. Jung, E. J. Choi, H. J. Lee, J. Yu, Y. Moritomo, and T. W. Noh, cond-mat/9906265 (unpublished).]
- [27] S. G. Kaplan, M. Quijada, H. D. Drew, D. B. Tanner, G. C. Xiong, R. Ramesh, C. Kwon, and T. Venkatesan, Phys. Rev. Lett. 77, 2081 (1996).
- [28] J. H. Jung, K. H. Kim, T. W. Noh, E. J. Choi, and J. Yu, Phys. Rev. B 57, R11 053 (1998).
- [29] Y. Moritomo, A. Machida, K. Matsuda, M. Ichida, and A. Nakamura, Phys. Rev. B 56, 5088 (1997).
- [30] J. H. Jung, K. H. Kim, H. J. Lee, J. S. Ahn, N. J. Hur, T. W. Noh, M. S. Kim, and J.-G. Park, Phys. Rev. B 59, 3793 (1999).
- [31] A. Machida, Y. Moritomo, and A. Nakamura, Phys. Rev. B 58, 12 540 (1998).
- [32] Quijada et al. [Ref. 11] assigned the peak as inter-orbital transition between different Mn3+ site. And Machida et al. [Ref. 31] assigned it as the optical transition related to Jahn-Teller clusters.
- [33] S. Yoon, H. L. Liu, G. Schollerer, S. L. Cooper, P. D. Han, D. A. Payne, S-W. Cheong, and Z. Fisk, Phys. Rev. B 58, 2795 (1998).
- [34] K. H. Kim, J. H. Jung, D. J. Eom, T. W. Noh, J. Yu, and E. J. Choi, Phys. Rev. Lett. 81, 4983 (1998).
- [35] K. Kubo and N. Ohata, J. Phys. Soc. Jpn. 33, 21 (1972).
- [36] R. Mahendiran, M. R. Ibarra, A. Maignan, F. Millange, A. Arulraj, R. Mahesh, B. Raveau, and C. N. R. Rao, Phys. Rev. Lett. 82, 2191 (1999) and references therein.
- [37] N. Fukumoto, S. Mori, N. Yamamoto, Y. Moritomo, T. Katsufuji, C. H. Chen, and S-W. Cheong, Phys. Rev. B 60, 12 963 (1999).
- [38] K. F. Herzfeld, Phys. Rev. 29, 701 (1927).
- [39] T. V. Ramakrishnan, in The Metallic and Nonmetallic States of Matter, edited by P. P. Edwards and C. N. R. Rao (Taylor & Francis, London, 1985).
- [40] H. S. Choi, J. S. Ahn, J. H. Jung, T. W. Noh, and D. H. Kim, Phys. Rev. B 54, 4621 (1996).
- [41] T. W. Noh, Y. Song, S.-I. Lee, J. R. Gaines, H. D. Park, and E. R. Kreidler, Phys. Rev. B 33, 3793 (1986).
- [42] S. Yunoki, J. Hu, A. L. Malvezzi, A. Moreo, N. Furukawa, and E. Dagotto, Phys. Rev. Lett. 80, 845 (1998).
- [43] A. Moreo, S. Yunoki, and E. Dagotto, Science 283, 2034 (1999).
- [44] G. Allodi, R. De Renzi, F. Licci, and M. W. Pieper, Phys. Rev. Lett. 81, 4736 (1998).
- [45] M. Fäth, S. Freisem, A. A. Menovsky, Y. Tomioka, J. Aarts, and J. A. Mydosh, Science 285, 1540 (1999).
- [46] M. Uehara, S. Mori, C. H. Chen, and S-W. Cheong, Nature 399, 560 (1999).
- [47] R. H. Heffner, L. P. Le, M. F. Hundley, J. J. Neumeier, G. M. Luke, K. Kojima, B. Nachumi, Y. J. Uemura, D. E. MacLaughlin, and S-W. Cheong, Phys. Rev. Lett. 77, 1869 (1996).
- [48] C. H. Booth, F. Bridges, G. H. Kwei, J. M. Lawrence, A. L. Cornelius and J. J. Neumeier, Phys. Rev. B 57, 10 440 (1998).