The KARMEN Time Anomaly: Search for a Neutral Particle of Mass 33.9 MeV in Pion Decay
M. Daum1,∗, M. Janousch2,†, P.-R. Kettle1, J. Koglin1,3, D. Počanić3, J. Schottmüller1, C. Wigger1, Z.G. Zhao4
1 PSI, Paul-Scherrer-Institut, CH-5232 Villigen-PSI, Switzerland.
2 IPP, Institut für Teilchenphysik, Eidgenössische Technische
Hochschule
Zürich, CH-5232 Villigen-PSI, Switzerland.
3 Physics Department, University of Virginia, Charlottesville,
Virginia 22901,
USA.
4 IHEP, Institute of High Energy Physics, Chinese Academy of Science,
Beijing 100039, The People’s Republic of China.
∗E-mail address: Manfred.Daum@psi.ch
Tel.: +41 56 310 36 68; Fax: +41 56 310 32 94.
†Present address:
Paul-Scherrer-Institut, CH-5232 Villigen-PSI, Switzerland.
ABSTRACT
We have searched for the pion decay ,
where is a neutral particle of mass 33.905 MeV. This process was
suggested by the KARMEN Collaboration to explain an anomaly in their
observed time distribution of neutrino induced reactions.
Having measured the muon
momentum spectrum of charged pions decaying in flight, we find no evidence
for this process and place an upper limit on the branching fraction
of such a decay at a 95 % confidence
level.
PACS: 13.20.Cz, 14.60.Pq, 14.80.-j
In 1995, the KARMEN Collaboration reported[1] on a ‘long-standing’ discrepancy between their measured and expected time distributions of neutrino induced reactions originating from neutrinos produced from - and -decays at rest in the primary target of the ISIS facility at the Rutherford Appleton Laboratory. Further evidence of events exceeding the expected exponential distribution characterized by the muon lifetime and clustered around 3.6 s after beam-on-target has since been reported[2]. The speculative explanation given in Ref.[1] was that the anomalous events could originate from the rare pion decay process,
| (1) |
where X is a new massive neutral particle. From the time-of-flight (TOF) information and the mean flight-path of 17.5 m (including 7 m of steel shielding) the mass of was deduced to be 33.905 MeV.
Various hypotheses have been put forward as to the nature of the -particle. Barger et al. [3] suggest a mainly isosinglet (sterile) neutrino with the dominant visible decay mode . In another paper, Choudhury and Sarkar [4] consider a supersymmetric solution where the -particle is the lightest neutralino and decays radiatively. Gninenko and Krasnikov[5] proposed an alternative process to explain the time anomaly by introducing the exotic muon decay . A recent experiment found no evidence for such a decay mode down to a branching fraction of (90 % c.l.)[6].
The mass of originating from decay (1) is very similar to the mass difference between the charged pion and the muon, MeV[7, 8]. Thus, the resulting small Q-value makes it prohibitive to look for such a particle in ‘heavy neutrino searches’ from pions decaying at rest[9, 10, 11, 12]. However, it has certain advantages when looking at decays in flight. The velocity of the decay muon is very similar to that of the original pion, and hence, the momentum is well defined, . It also follows that the energy-loss of the muon is almost equal to that of the pion. Furthermore, the flight direction of the muon differs only slightly from that of the pion. Thus, a pion beam-line itself can be used as a spectrometer to optimally separate muons of the decay (1) from both other beam particles and muons from the normal pion decay,
| (2) |
In addition, the pions can also be used to adjust the electronics timing and counter thresholds for muons from decay (1).
Soon after the initial KARMEN publication [1], several searches were undertaken to look for the rare decay (1)[13, 14, 15]. Using the high intensity pion channel E1 at PSI and the decay-in-flight method, we were able to set the most sensitive upper limit on the branching fraction
| (3) |
of this decay at (95% c.l.) [13]. In order to improve on this sensitivity, we performed a new experiment using a similar method with the following improvements: (i) a better phase space definition of the pion beam; (ii) a better phase space definition in the muon spectrometer; (iii) additional background suppression by using a new beam-line optics and an improved vacuum system with active and passive collimators.
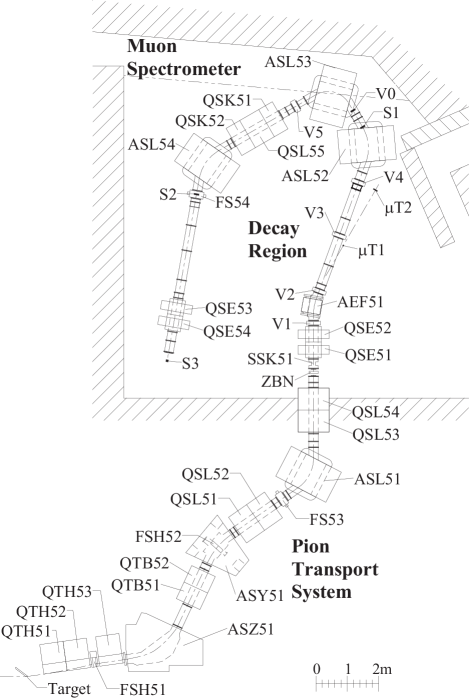
Our new experimental setup, shown in Fig. 1, consists of three main parts. The first part is the pion transport system from the pion production target to the end of the dipole magnet AEF51. Here, the collimators FSH51, FSH52, FS53, and ZBN were used to define the pion phase space centred at 150 MeV/c with a momentum spread of 1.2 % (95 %). This central beam momentum was chosen so that the TOF-information could be used to optimally separate pions from positrons and muons also contained in the beam. The second part, between the dipole magnets AEF51 and ASL52, serves as the 4.5 m long field-free pion-decay region in which about 42 % of the entering pions decay. With the proton accelerator operating at a beam current of 1.5 mA, the pion decay rate was approximately 107 Hz in this region. The active collimators V1–V4 were positioned within the vacuum system to suppress the background of scattered particles originating from both before and within the decay region. The final section, from the dipole magnet ASL52 to the counter S3, is the momentum analyzing spectrometer. The active collimators V0 and V5 were used together with the beam counters S1–S3 and the passive collimator FS54 to define the spectrometer acceptance such that only particles with a momentum spread of 2.3 % and divergences similar to those of the original pions were accepted. For normalization purposes, a muon telescope in the decay region was used together with a proton monitor in the primary proton beam.
The experimental method involved firstly tuning the entire beam-line according to beam transport calculations using 150 MeV/c pions. These pions were then used to set up the electronics timing and counter thresholds. The triple coincidence S1S2S3 of the beam counters defined our trigger events. In a next step, ‘decay muon scans’ were performed by leaving the magnets of the pion transport system at their original 150 MeV/c settings while the spectrometer magnets were scaled in steps of 0.5 MeV/c from 103.0 MeV/c to 124.0 MeV/c. In this momentum range, muons from the normal decay (2) of 150 MeV/c pions have decay angles of about 255 mrad and are not accepted by the beam-line and the spectrometer. Muons from decay (1), however, have a maximal decay angle of about 5 mrad and are accepted by the spectrometer. The scans were performed over this broad momentum range in order to characterize the background distribution over which excess events centred at (i.e. 113.5 MeV/c) would indicate evidence for the existence of decay (1).
The shape and position of the peak which would be produced from decay (1) were deduced from ‘pion scans’ and ‘muon scans’. The ‘pion scans’ were performed by scanning the spectrometer magnets around 150 MeV/c, while the ‘muon scans’ were obtained by firstly scaling the magnet currents in the pion transport system by a factor of (i.e. to a momentum of 113.5 MeV/c) and then scanning the spectrometer magnets around this momentum. These scans were also used to test the magnet scaling properties. Deviations from linearity were found to be negligible for all but one magnet. Here, the deviation was 1.2 % and was accounted for in acceptance calculations and magnet setting corrections.
Our data-taking procedure consisted of ‘decay muon scans’ in which an automated procedure was followed ensuring that for each of the scans the momentum settings were reproducible[16]. At each momentum setting, the pulse-height and timing information of all beam and active veto-counters were recorded event-by-event for a given number of protons on the pion production target. To demonstrate our particle identification ability, two-dimensional TOF-distributions for events which have passed initial timing and veto cuts are shown in Fig. 2. One can clearly distinguish pions, contained in the indicated timing box, from muons and positrons also present in the beam. The candidate muon events from decay (1) are expected to be located in plot (b) at the same location as the pions in plot (a). These muons are clearly distinguishable from scattered muons as well as scattered positrons and positrons from other decay sources.
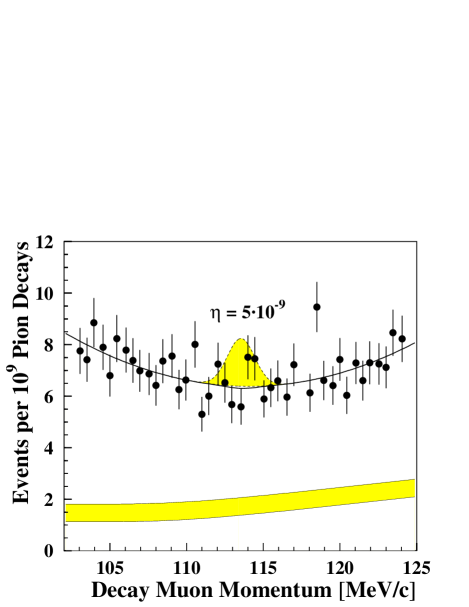
Based on modifications that were made to our spectrometer acceptance during the beam time, the data can be divided into four sets. For each scan, the momentum spectrum of muons was obtained from the number of candidate events at each momentum setting of the spectrometer. These candidate events had to fulfil the following timing and veto conditions: (i) their timing must be consistent with that of muons having been produced from pions in the decay region and travelling with the velocity corresponding to the spectrometer settings; (ii) they must not be accompanied by a corresponding hit in any of the 22 veto counters. With the veto cuts, more than 90 % of the events passing the timing cuts were rejected. The data were then normalized to the number of pion decays in the decay region. The momentum spectrum of one of the scans is shown in Fig. 3.
In order to model the background, the central points of the momentum distribution were excluded while the remaining points were fitted with various functions such as second and fourth order polynomials. The best fits were obtained with a general hyperbola which has five degrees of freedom. Each scan was then fitted with a Gaussian function simulating the expected distribution of muons from the hypothetical decay (1) together with the background function. The width and the position of the Gaussian function were determined from computer simulations[16, 17] using the pion and muon scan data discussed above. The height of the Gaussian together with the five parameters of the hyperbolic background function were left as free fit parameters. The branching fraction , see eq. (3), was determined by weighting the fitted height of the Gaussian with the spectrometer acceptance which was determined from pion scans and beam transport simulations[16, 17].
The fit to one of our scans is shown in Fig. 3 along with the effect one would expect to see for a branching fraction of . No indication for the existence of the hypothetical decay (1) is evident in our data, cf. also Fig. 4. The expected level of background events originating from the radiative pion decay, , was obtained from a Monte Carlo simulation and is also indicated in Fig. 3. The remaining background is assumed to originate predominantly from scattered particles and small inefficiencies in the 22 veto counters.
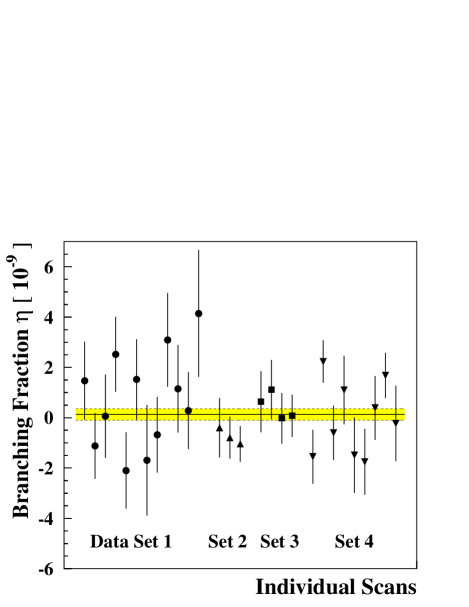
The fit results to for our 28 different scans are displayed in Fig. 4. The combined confidence level of the fits to the 28 scans is 29 %[16]. The weighted mean is . Our systematic uncertainty was found to be 5 % and accounts for spectrometer acceptance and the overall normalization uncertainties[16]. Therefore, in order to obtain a conservative result, a factor of 1.05 was applied multiplicatively to both and its uncertainty which yields the branching fraction
| (4) |
Following the Frequentist’s approach described in Ref. [18, 7], we find an upper limit of
| (5) |
This new upper limit is a factor of 45 lower than the previous limit[13, 7]; note that our sensitivity [cf. eq. (4)], however, was increased by two orders of magnitude. The new result rules out the supersymmetric solution of the KARMEN anomaly considered by Choudhury and Sarkar[4]. Other solutions in which the -particle is considered as an isosinglet (i.e. sterile) neutrino consistent with the KARMEN hypothesis are still possible down to a level of about 10-13[3, 19]. In a recent experiment [20], upper limits for were obtained between 10-13 and for lifetimes ss.
This project was supported by the Schweizerischer Nationalfonds and the US National Science Foundations.
References
- [1] KARMEN Collaboration, B. Armbruster et al., Phys. Lett. B 348, 19 (1995).
- [2] KARMEN Collaboration, B. Zeitnitz, WIN’99, Cape Town, ZAR (2000).
-
[3]
V. Barger et al., Phys. Lett. B 352, 365 (1995);
V. Barger et al., Phys. Lett. B 356, 617(E) (1995). - [4] D. Choudhury and S. Sarkar, Phys. Lett. B 374, 87 (1996).
- [5] S.N. Gninenko and N.V. Krasnikov, Phys. Lett. B 434, 163 (1998).
- [6] R. Bilger et al., Phys. Lett. B 446, 363 (1999).
- [7] Particle Data Group, Eur. Phys. J. C3 (1998).
- [8] K. Assamagan et al., Phys. Rev. D 53, 6065 (1996).
- [9] R. Abela et al., Phys. Lett. B 105, 63 (1981).
- [10] R. Minehart et al., Phys. Rev. Lett. 52, 804 (1984).
- [11] M. Daum et al., Phys. Rev. D 36, 2624 (1987).
- [12] K. Assamagan et al., Phys. Lett. B 434, 158 (1998).
- [13] M. Daum et al., Phys. Lett. B 361, 179 (1995).
- [14] R. Bilger et al., Phys. Lett. B 363, 41 (1995).
- [15] D.A. Bryman and T. Numao Phys. Rev. D 53, 558 (1996).
- [16] J. Koglin, PhD thesis, University of Virginia, Charlottesville, Virginia 22901, USA (2000).
- [17] K.L. Brown et al., CERN report no. 73–16 (1973) (unpublished).
- [18] G.J. Feldman and R.D. Cousins, Phys. Rev. D 57, 3873 (1998).
- [19] J. Govaerts et al., Phys. Lett. B 389, 700 (1996).
- [20] J. A. Formaggio et al., Phys. Rev. Lett. 84, 4043 (2000).
Figure Captions
Figure 1:
The beam-line consists of three parts:
(i) the pion transport system up to and including the magnet AEF51;
(ii) the pion decay region between the magnets AEF51 and ASL52;
(iii) the muon spectrometer from the magnet ASL52
to the beam counter S3.
ASZ, ASY, ASL, AEF: dipole magnets; QTH, QTB, QSL, QSE, QSK:
quadrupole magnets; FSH, FS, ZBN: passive collimators;
S1–S3: beam scintillation counters; V0–V5: active (scintillation counters)
and passive (lead jaws) collimators.
Figure 2:
Experimental TOF-distributions with the relevant background event
types (∗ refers to scattered particles). The upper plot (a) shows
the situation when the whole beam-line is
set to accept pions of 150 MeV/c. Plot (b) shows the
situation for the central momentum of a ‘decay muon scan’
(113.5 MeV/c). The horizontal axes indicate
the TOF of particles from the
production target to the counter S1 relative to the
accelerator time structure of 19.75 ns.
The vertical axes indicate the TOF between the
counters S1 and S3.
The events in the box in (b) have the same timing as pions in (a),
and thus may contain signal as well as background events.
It should be noted that the
number of protons for which the data were recorded is
seven orders of magnitude higher in (b) than in (a).
Figure 3:
Experimental data of one ‘decay muon scan’.
The solid curve is the fit to the data (hyperbola plus Gaussian);
the is 33.6 for 37 degrees of freedom.
The shaded peak indicates the expected effect of the hypothetical decay (1)
for 10-9. The shaded band
shows the expected level of background from the
radiative pion decay, ,
within computational uncertainties ().
The minimum in the event distribution around 113.5 MeV/c arises from the fact
that at this momentum, muons from the normal pion decay (2) have
a maximal emission angle and thus a minimal chance to enter the acceptance
of the spectrometer.
Figure 4:
Results of the fits to the branching fraction for our 28 scans.
The weighted mean for is indicated by the solid line with the
total uncertainty () given by the dashed lines.