Measurements of the Running of the Electromagnetic Coupling at LEP
Abstract
The study of Bhabha scattering at colliders probes the running of the electromagnetic coupling. After early measurements by the VENUS collaboration at TRISTAN and the by L3 collaboration at LEP, two recent analyses have been performed by the OPAL and L3 collaborations. The OPAL collaboration studied high-statistics low-angle Bhabha scattering at LEP, achieving a precise determination of the running of in the region . The L3 collaboration investigated high-energy large-angle Bhabha scattering to first probe the region . All measurements are described and a global overview of their agreement with QED predictions is given.
I THE RUNNING OF
A fundamental idea in quantum field theory is that coupling constants which describe the strength of a given process are not actually constant but rather depend on the energy scale at which the process occurs; in other words, the constants run. In QED this running implies the increase of the electromagnetic coupling, , with the squared four-momentum transfer, . Figure 1 sketches the origin of this phenomenon in the case of Bhabha scattering, : larger momentum transfers probe virtual-loop corrections to the photon propagator.

The running of is parametrised as ref:running :
| (1) |
where is the fine-structure constant. This is measured with high accuracy in solid-state processes and via the study of the anomalous magnetic moment of the electron to be ref:codata :
The term describes the running of in Equation 1. It receives contributions from three sources: lepton loops, top-quark loops and loops involving the five lighter quark flavours. At the scale of Z-boson mass, , the first two contributions to are precisely calculated as:
| (2) |
| (3) |
as discussed in References ref:leptons and ref:top , respectively. The contribution from the five lighter quarks, , is difficult to calculate due to non-perturbative QCD effects and is estimated using dispersion-integral techniques as ref:burkhardt_new :
| (4) |
The electromagnetic coupling at the scale of the Z-boson mass is therefore ref:burkhardt_new :
| (5) |
The study of fermion-pair production at LEP, , allows a precise measurement of the Z-boson couplings. These couplings are sensitive to electroweak vacuum-polarisation effects and therefore also to the running of . The quantity most sensitive to the running of is the effective vector coupling constant of Z bosons and electrons. It is measured as ref:smreport . In the absence of the running of its value would be . A global fit to several Standard Model observables allows to constrain the value of at the scale of the Z-boson mass as ref:smreport :
| (6) |
which is in remarkable agreement with the expected value of Equation 5. However, this determination of is based on the assumption of the full electroweak theory and a determination which relies on less hypotheses is desirable. The study of Bhabha scattering, discussed in the following, allows a more direct insight in the running of .
II BHABHA SCATTERING AND THE RUNNING OF
The study of Bhabha scattering at colliders offers a unique window on the vacuum-polarisation insertions depicted in Figure 1. Its measurement gives access to the running of in the space-like region, . The experimental conditions at colliders are extremely favourable as they allow a precise determination of the four-momentum transfer through its dependence on the squared centre-of-mass energy, , and on the scattering angle, :
Indeed, at colliders, is accurately known and detectors are conceived for a precise measurement of . In the following, Bhabha scattering is studied in two angular regions: low-angle, , and large-angle, . These angular regions correspond to two energy regimes: low- and high-, respectively.
The relation between the differential cross section of Bhabha scattering and the electromagnetic coupling is:
| (7) |
where the tree-level cross section is:
| (8) |
The -channel contributions, and , are much smaller than the radiative corrections, . These three quantities are known with a good accuracy compared to the experimental precision of the study of low- and large-angle Bhabha scattering. Naïvely, one could imagine to measure the cross section for Bhabha scattering and then insert the result in the left-hand side of Equation 7 in order to extract a value for . This argument is unfortunately flawed: the measurement of the cross section requires knowledge of the integrated luminosity. At LEP this is estimated by counting events from low-angle Bhabha scattering and assuming the cross section of this process to be known, what can only happen if is known to start with: a catch-22 catch22 !
As discussed above, the information on contained in the scale of the differential cross section cannot be directly unlocked. On the other hand, the shape of this differential cross section contains information on the running of over the range in which the cross section is measured. QED predicts that increases with : if the running is slower than the one expected in QED, the differential cross section will be steeper than expected; if the running is faster than expected in QED, the differential cross section will be flatter than expected. The strategy to access information on the running of is therefore to analyse the shape of the differential cross section over a range and compare it with the expectation from QED. Five such analyses exist and are presented below: we first discuss three early measurements of the running of at TRISTAN and LEP, and then describe two recent measurements performed by the OPAL and L3 collaborations by investigating low-angle and large-angle Bhabha scattering at LEP.
III EARLY MEASUREMENTS AT TRISTAN AND LEP
LEP experiments were equipped with low-angle calorimeters, called luminosity monitors, engineered to detect events from low-angle Bhabha scattering in order to measure the integrated luminosity. The event counts in different polar-angle regions of the luminosity monitors depend on the shape of the differential cross section of Bhabha scattering and, through Equation 7, give access to the running of .
The first study of the running of using low-angle Bhabha scattering was performed by the L3 collaboration. A total of about 7 million events collected at in the luminosity monitor, covering a polar angle , were used to probe the running of in the region l3-197 .

Figure 2 presents the ratio between the observed number of events and the QED prediction, as well as the hypothesis of a constant value of over the entire range. This ratio of data and predictions is fitted to determine the running of between the two extremes of the range as:
| (9) |
where the uncertainty combines statistical and systematic uncertainties. This result is in good agreement with the QED prediction of 0.56 and first established the running of in this energy range, excluding the no-running hypothesis at 4.5 standard deviations.
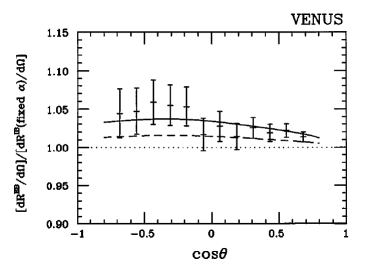
The running of in large-angle Bhabha scattering was first investigated by the VENUS Collaboration at TRISTAN. They studied events collected at in the angular range to cover the range ref:venus .
Figure 3 shows the measured differential cross section as a function of the cosine of the scattering angle, normalised to the QED predictions with a fixed value of . The effects of the running are evident and the data favour a scenario in which both the hadronic and leptonic contributions are present in the running, as opposed to a scenario with just lepton loops. The results can be expressed as the change over the range of the term describing the running of in Equation 1:
| (10) |
where the uncertainty includes statistical and systematic effects.
A similar study at higher centre-of-mass energies and lower polar angles was performed by the L3 Collaboration. Bhabha-scattering events are selected at for scattering angles , probing the intermediate- range l3-197 . The measured differential cross section as a function of the scattering angle is compared to the predictions as a function of , allowing to measure its running over the range as:
| (11) |
where the uncertainty comprises statistical and systematic sources. This value is in good agreement with the QED prediction of 4.07.
IV PRECISION MEASUREMENT AT LOW
The OPAL collaboration analysed low-angle Bhabha scattering events to study the running of at low ref:opal . Data collected at with the luminosity monitor, consisting of layers of tungsten absorber and 32-pad silicon detectors, were used. This detector covered a polar region , corresponding to a momentum transfer .
The analysis selects 10 million high-energy back-to-back cluster pairs and studies their spectrum to extract information on . Data are divided in five bins and are compared with the BHLUMI Monte Carlo ref:bhlumi . The results of the study are quantified by studying the ratio of the spectrum observed in data and the Monte Carlo spectrum for the hypothesis , as shown in Figure 4.

The data in Figure 4 are fitted with the function , where is the mean value of in the data sample. The parameter is related to the running of by:
| (12) |
Four hypotheses are tested by the OPAL analysis: no running of ; a running only due to electron virtual-loops; a running only due to lepton virtual-loops; the QED hypothesis of a running induced by virtual loops of leptons and quarks. The first three hypotheses are found to be completely excluded by data.
The observed running of is derived from the fitted value of and Equation 12 to be:
| (13) |
where the first uncertainty is statistical, the second systematic and the third theoretical. The main sources of systematic uncertainties are the simulation of the detector material and the reconstruction of the radial coordinates of the energy clusters in the calorimeter. This results is in excellent agreement with the QED prediction of .
This measurement proves the running of at low with a significance of . In addition, it establishes for the first time the hadronic contribution to the running with a significance of as:
| (14) |
V FIRST MEASUREMENT AT LARGE
The L3 collaboration probed the running of at large by studying large-angle Bhabha scattering in the angular region ref:l3 . Data collected at eight centre-of-mass energies in the range were considered, corresponding to a four-momentum transfer . About 40 000 events are selected as back-to-back clusters in the high-resolution BGO electromagnetic calorimeter with matched tracks. These events are used to measure the differential cross section of Bhabha scattering in ten different angular ranges, for each of the eight energy points, for a total of 80 measurements. The measured cross section are compared to the predictions of the BHWIDE Monte Carlo ref:BHWIDE to extract information on the running of . As an example, Figure 5 compares the data and the predictions for the ten centre-of-mass-averaged cross sections.

The results of the study are expressed by inserting an additional parameter, , in the description of the running of of Equation 1:
| (15) |
A fit to the 80 data points, which takes into account the dependence of the measured integrated luminosity on shows that the value , corresponding to absence of running, is completely excluded. The data are in excellent agreement with the running predicted in QED, corresponding to , and the fit yields:
| (16) |
where the first uncertainty is statistical and the second systematic. The systematic uncertainty is dominated by theoretical uncertainties on the prediction of the Bhabha scattering differential cross section both at large angles and in the luminosity monitor. Some additional systematic contributions also come from the modelling of the detector response.
VI COMBINED RESULTS
Figure 6 summarises the LEP results on the running of the electromagnetic coupling. The L3 measurement at ref:l3 is represented as a band, obtained by inserting the measured value of from Equation 16 into Equation 15 and assuming the QED description of given in Reference ref:burkhardt_new . The two low- measurements by the OPAL and L3 collaborations at (Equation IV) and (Equation 9), respectively, as well as the intermediate- measurement of L3 at (Equation 11) are represented with two symbols each. The empty symbols represent the values of at the lower end of each range. They are fixed by using Equation 1 and the QED description of of Reference ref:burkhardt_new . The full symbols represent the values of at the higher end of each range extracted from the fixed values and from the measurements in Equations IV, 9 and 11. All measurements are in excellent agreement with the QED predictions of Reference ref:burkhardt_new , presented as a solid line.
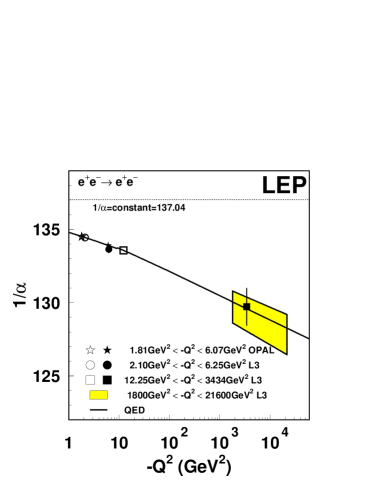
Figure 7 presents a combination of all LEP results. This combination is obtained in several steps. First, the L3 measurement at and the OPAL measurement at , from Equations IV and 9 respectively, are combined into a single measurement. In order to perform this combination the L3 measurement is transported to the range of the OPAL measurement. The combined result is:
| (17) |
where the uncertainty combines statistical and systematic effects. This combined result and the L3 measurement at intermediate are plotted in Figure 7 as two single points at and , respectively. The values of at these two points are extracted by anchoring the value of at the lower end of each range by using the L3 measurement of at and assuming it also describes the running of for lower values of : the values of and are fixed by using the measured value of from Equation 16, the evolution expected from Equation 15 and the QED description of of Reference ref:burkhardt_new . The value of is finally extracted by using this fixed value of and Equation 17, with an additional uncertainty which follows from the 14% uncertainty on . A similar procedure is followed to extract the value of from Equation 11.
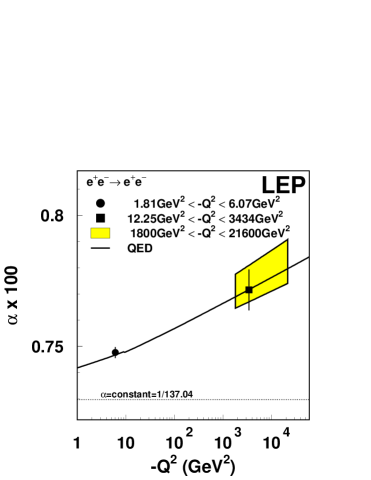
In conclusion, the LEP experiments have established the the evolution of the electromagnetic coupling with the squared four-momentum transfer in a new energy domain. These measurements, combined in Figure 7, span three orders of magnitude in and confirm the QED predictions for the running of .
References
-
(1)
E.C.G. Stückelberg and A. Petermann, Helv. Phys. Acta 26 (1953) 499;
M. Gell-Mann and F. Low, Phys. Rev. 95 (1954) 1300;
N.N. Bogoliubov and D.V. Shirkov, Dokl. AN SSSR 103 (1955) 203. -
(2)
CODATA Task Group, Rev. Mod. Phys. 72 (2000) 351;
http://physics.nist.gov/constants. - (3) M. Steinhauser, Phys. Lett B 429 (1998) 158
-
(4)
G. Montagna et al., Comp. Phys. Comm 117 (1999) 278;
A.B. Arbuzov et al., Comp. Phys. Comm 174 (2006) 728. -
(5)
H. Burkhardt and B. Pietrzyk, Phys. Lett. B 513 (2001) 46;
H. Burkhardt and B. Pietrzyk, Phys. Rev. D 72 (2005) 057501. - (6) ALEPH, DELPHI, L3, OPAL and SLD Collab, Phys. Rept. 427 (2006) 257.
- (7) J. Heller, Catch-22, ISBN 0-684-83339-5.
- (8) L3 Collab., M. Acciarri et al., Phys. Lett. B 476 (2000) 40.
-
(9)
VENUS Collab., S. Odaka et al., Phys. Rev. Lett. 81 (1998) 2428;
VENUS Collab., T. Arima et al., Phys. Rev. D 55 (1997) 19. - (10) OPAL Collab. G. Abbiendi et al., Eur. Phys. J. C 45 (2006) 1.
- (11) S. Jadach et al., Comput. Phys. Commun. 102 (1997) 229.
- (12) L3 Collab., P. Achard et al., Phys. Lett. B 623 (2005) 26.
- (13) S. Jadach, W. Placzek and B.F.L. Ward, Phys. Lett. B 390 (1997) 298.