INSTITUT FÜR KERNPHYSIK, UNIVERSITÄT FRANKFURT
60486 Frankfurt, August–Euler–Strasse 6, Germany
IKF–HENPG/6–94
Charged Particle Production in Proton-, Deuteron-, Oxygen- and Sulphur-Nucleus Collisions at 200 GeV per Nucleon
Abstract
The transverse momentum and rapidity distributions of net protons and negatively charged hadrons have been measured for minimum bias proton–nucleus and deuteron–gold interactions, as well as central oxygen–gold and sulphur–nucleus collisions at 200 GeV per nucleon. The rapidity density of net protons at midrapidity in central nucleus–nucleus collisions increases both with target mass for sulphur projectiles and with the projectile mass for a gold target. The shape of the rapidity distributions of net protons forward of midrapidity for d+Au and central S+Au collisions is similar. The average rapidity loss is larger than 2 units of rapidity for reactions with the gold target. The transverse momentum spectra of net protons for all reactions can be described by a thermal distribution with ‘temperatures’ between MeV (p+S interactions) and MeV (central S+Au collisions). The multiplicity of negatively charged hadrons increases with the mass of the colliding system. The shape of the transverse momentum spectra of negatively charged hadrons changes from minimum bias p+p and p+S interactions to p+Au and central nucleus-nucleus collisions. The mean transverse momentum is almost constant in the vicinity of midrapidity and shows little variation with the target and projectile masses. The average number of produced negatively charged hadrons per participant baryon increases slightly from p+p, p+A to central S+S,Ag collisions.
The NA35 Collaboration:
T. Alber10, H. Appelshäuser6, J. Bächler5,a, J. Bartke4, H. Białkowska12, M.A. Bloomer3, R. Bock5, W.J. Braithwaite10, D. Brinkmann6, R. Brockmann5, P. Bunčić5,b, P. Chan10, J.G. Cramer10, P.B. Cramer10, I. Derado9, V. Eckardt9, J. Eschke6,c, C. Favuzzi2, D. Ferenc13, B. Fleischmann5, P. Foka5,b, P. Freund9, M. Fuchs6, M. Gaździcki6, E. Gładysz4, J. Grebieszkow11, J. Günther6, J.W. Harris3,d, M. Hoffmann7, P. Jacobs3, S. Kabana6,e, K. Kadija9,13, R. Keidel8, M. Kowalski4, A. Kühmichel6, J.Y. Lee6, A. Ljubičić jr.13,f, S. Margetis3,g, J.T. Mitchell3,f, R. Morse3, E. Nappi2, G. Odyniec3, G. Paić5,13, A.D. Panagiotou1, A. Petridis1, A. Piper8, F. Posa2, A.M. Poskanzer3, F. Pühlhofer8, W. Rauch9, R. Renfordt6, W. Retyk11, D. Röhrich6, G. Roland6, H. Rothard6, K. Runge7, A. Sandoval5, N. Schmitz9, E. Schmoetten7, R. Sendelbach6, P. Seyboth9, J. Seyerlein9, E. Skrzypczak11, P. Spinelli2, R. Stock6, H. Ströbele6, L. Teitelbaum3, S. Tonse3, T.A. Trainor10, G. Vasileiadis1, M. Vassiliou1, G. Vesztergombi9, D. Vranic13, S. Wenig6, B. Wosiek9,4, X. Zhu10
1Department of Physics, University of Athens, Athens, Greece,
2Dipartimento di Fisica, Università di Bari and INFN Bari, Bari,
Italy,
3Lawrence Berkeley Laboratory, Berkeley, CA, USA,
4Institute of Nuclear Physics, Cracow, Poland,
5Gesellschaft für Schwerionenforschung (GSI),
Darmstadt, Fed. Rep. of Germany,
6Fachbereich Physik der Universität, Frankfurt,
Fed. Rep. of Germany (IKF),
7Fakultät für Physik der Universität, Freiburg,
Fed. Rep. of Germany,
8Fachbereich Physik der Universität, Marburg,
Fed. Rep. of Germany,
9Max–Planck–Institut für Physik, München,
Fed. Rep. of Germany,
10University of Washington, Seattle, USA,
11Institute for Experimental Physics, University of Warsaw,
Warsaw, Poland,
12Institute for Nuclear Studies, Warsaw, Poland,
13Rudjer Bošković Institute, Zagreb.
aNow at CERN
bNow at IKF
cNow at GSI
dNow at Yale University, New Haven, CT, USA
eNow at University of Bern, Bern, Switzerland
fNow at Brookhaven National Laboratory, Upton, NY, USA
gNow at Kent State University, Kent, OH, USA
1 Introduction
In order to investigate and understand the dynamics of relativistic nucleus-nucleus collisions, it is important to have information on the rapidity and transverse momentum distributions of nucleons participating in the interaction and of particles produced in the collisions, all as a function of the size of the system and of the impact parameter. The differences of particle distributions from proton–proton, proton–nucleus and finally nucleus–nucleus interactions may provide the key to understanding any non-hadronic effects that may appear in central nucleus–nucleus collisions. Ultimately these distributions might be used to determine the behavior of strongly interacting matter at high densities and temperatures.
New results from the measurement of collisions of very heavy nuclei at the BNL AGS and CERN SPS [1, 2] can best be understood by comparison to simpler systems of lighter projectiles and targets. We report results from the NA35 experiment at the CERN SPS on the rapidity and transverse momentum distributions of negatively charged hadrons and participant protons, measured in proton–nucleus, deuteron–gold, oxygen–gold and sulphur–nucleus collisions at 200 GeV per nucleon. A small subset of the present data (S+S collisions) has already been published [3] and has been compared to various theoretical predictions ([4, 5, 6]). The transverse momentum and rapidity distributions provide information on the degree of stopping, thermalization, expansion and flow effects in the collisions. Furthermore, the participant proton rapidity distributions may be used to determine the baryon density or the baryo-chemical potential as a function of rapidity, which constrains model calculations of the dynamics of particle production. The present study is complementary to transverse and forward energy measurements already reported from NA35 [7] which provided global information on the collision dynamics. It is also supplementary to previous strange particle production measurements [8, 9, 10, 11] which are the basis for the determination of the chemical freeze-out conditions. All of this information helps to obtain a consistent picture of the entire reaction process. In particular, it will facilitate detailed comparisons with model calculations (e.g. [4, 12, 13, 14, 15]).
2 Experiment NA35
Experiment NA35 at the CERN SPS studies collisions of p, d, 16O and 32S projectiles of 200 GeV per nucleon incident energy (=19.4 GeV) with nuclear targets. The main detectors are two large-volume tracking devices: a streamer chamber (SC) inside a 1.5 Tesla vertex magnet (VTM) and a time projection chamber (TPC) positioned downstream of the magnet. Both detectors record the space trajectories of charged particles from which the particle momenta are derived. The acceptances of the detectors for negatively charged hadrons are complementary to each other and cover the full phase space with some overlap. Central events are usually selected by the absence of projectile spectators in the veto calorimeter placed in the beam line downstream of all detectors (see e.g. [3, 7, 11, 16]).
The objective of the experiment is to measure the hadronic final state in nucleus–nucleus collisions. In addition to negatively and positively charged particles, weak decays of charged and neutral particles can be detected in the streamer chamber. The analysis of the streamer chamber pictures has been fully automated [16], which not only resulted in an increase of the measuring rate by an order of magnitude but also allowed for a complete simulation of the detector based on the GEANT-package. The results discussed in the following are mainly based on the automated analysis but traditional measurements have been included where appropriate. The TPC identifies charged particles by multiple sampling of the specific ionisation with a resolution of about 5-6. It covers the momentum range of the relativistic rise of the energy loss. This makes particle identification using statistical methods possible. Combining both detectors, spectra of negatively charged hadrons , , , , net protons (), , and are obtained. Thus information on practically all baryons and mesons in the final hadronic state can be accessed with large phase space coverage. This paper will focus on rapidity and transverse momentum spectra of net (mainly participating) protons and negatively charged hadrons (primarily pions).
In order to accomplish large phase space coverage in collisions with very different particle multiplicities (from p+S to S+Au) and track densities in the laboratory, data were taken in three different experimental setups. Proton- and the oxygen-induced reactions were studied using the (standard) streamer chamber configuration (SETUP I) described in [8, 16, 17]. The nuclear target was placed 11 cm upstream of the 2.0 1.2 0.72 m3 streamer chamber (external target) which is the main tracking device inside the 1.5 T magnetic field of the superconducting vertex magnet. In addition p+S interactions were recorded with a target placed inside the streamer chamber (internal target). Charged particles created tracks of streamers of about 1 mm diameter and 1 cm length along their path through the sensitive volume. Three cameras, each equipped with a two-stage magnetically focusing image intensifier of about 2500-fold gain, recorded the events with a demagnification of 30 on 70 mm film. For the 32S induced reactions the track density in the central region along the beam direction () is so high that individual tracks cannot be separated due to the projective readout of the streamer chamber by stereoscopic cameras. Therefore, the streamer chamber geometry was modified by the insertion of an opaque foil of a trapezoidal shape close to the beam axis reducing the projected track density in that region. In addition, another opaque foil screened the lower half of the streamer chamber in order to further reduce the track density. This modified configuration is called SETUP II.

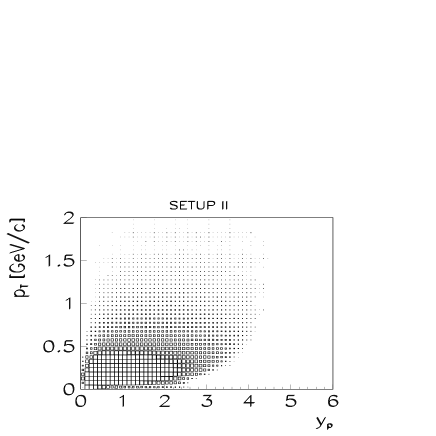
In order to measure forward-going strange particles and participant protons in the projectile hemisphere for the heaviest system (S+Au), the target and a sweeper magnet (SM) were installed upstream of the standard SETUP I configuration as shown in Fig. 1 (called SETUP III). The sweeper magnet has a vertical entrance opening of 2.5∘ for particles emerging from the target placed 6.3 cm upstream of this magnet. Due to its bending power of about 4.5 Tm all low momentum charged particles are swept out of the acceptance of the second magnet thus reducing the track density in the streamer chamber. This configuration not only enables measurement of strange particle decays in the projectile hemisphere but also covers participant protons beyond midrapidity () up to beam rapidity (). This can be seen in Fig. 2 where the population of protons in transverse momentum and rapidity is presented. When sulphur projectiles are used the proton acceptance can be extended up to beam rapidity only in SETUP III.
A second large-volume tracking device, a time projection chamber with a sensitive volume of 240 125 112 cm3 [18] located downstream behind the analysing magnet was installed in 1990 and utilized in the 32S–beam running for all three setups. It was also used in the deuteron–nucleus studies in the SETUP I configuration. The TPC detects charged particles by measuring the ionisation of a particle, traversing the TPC, up to 60 times. For a primary track emerging from the production vertex the momentum of the particle can be calculated from the direction and position of the track inside the TPC. The TPC was positioned for most of the time such that it detected magnetically stiff negatively charged particles above midrapidity. The acceptance for negatively charged hadrons (pions) is illustrated in Fig. 3. Both tracking detectors combined cover almost all momentum space available for hadron production at SPS energy. In addition, the TPC identified charged particles by multiple sampling of the specific ionisation. This capability was used to measure antiproton spectra [19] and to distinguish electrons from negatively charged hadrons.

3 Data sets
NA35 has studied a variety of collision systems, ranging from minimum bias proton–sulphur interactions to central sulphur–gold reactions. The central-collision fractions of the inelastic cross sections of the nucleus–nucleus collisions are typically the upper few percent of the inelastic cross section for the heavy ion induced reactions (see Table 1). Central events are selected either by a minimal energy deposition in the projectile fragmentation domain at forward angles () which is covered by the veto calorimeter (FET trigger), or by a large transverse energy deposition in the midrapidity calorimeters (TET trigger). In the case of p+S interactions a trigger was derived from a scintillation counter placed downstream of the streamer chamber which covered the projectile fragmentation domain. Its veto threshold was set just below the signal of the projectile particle and it selected essentially all inelastic interactions. An additional off-line selection of events with a charged particle multiplicity larger than five was applied in order to exclude contaminations due to non-target interactions in low multiplicity events.
| Reaction | Setup | Number | Trigger | [] | Acceptance | Acceptance |
| of events | protons | |||||
| p+S | SETUP I | scint. veto | ||||
| internal target | 735 | 63.5 | ||||
| external target | 339 | 63.5 | ||||
| p+Au | SETUP I | 1603 | FET | 67 | ||
| d+Au | SETUP I | 2457 | FET∗ | 43 | ||
| TPC | 9484 | FET∗ | 43 | - | ||
| O+Au | SETUP I | 565 | FET | 1.8 | ||
| S+S | SETUP II | 2650 | FET | 2.9 | ||
| TPC | 23500 | FET | 3.5 | - | ||
| S+Ag | SETUP II | 13730 | FET | 3.2 | ||
| TPC | 18000 | FET | 3.2 | - | ||
| S+Au | SETUP I | 331 | TET | 1.3 | - | |
| SETUP III | 3142 | FET | 6.3 | |||
| TPC | 25700 | FET | 6.3 | - |
4 Data Analysis
The operation of the streamer chamber (SC) is described elsewhere [16, 17], the data analysis will briefly be described in the following. Streamer chamber pictures were scanned and measured using two different approaches: using the traditional film measurement by human operators or applying image processing and pattern recognition techniques to digitized streamer chamber data. Most of the streamer chamber data were analyzed automatically by the Frankfurt Image Processing System which is described in detail elsewhere [16]. The three perspective views of a streamer chamber event were recorded on 70 mm film and later digitized by a high resolution CCD-linescan camera. These digitized images were submitted to a series of image processing and pattern recognition programs. Tracks matched in the three stereoscopic views were then reconstructed in space. The particle momenta and the production vertex were obtained by fitting a trajectory to the measured points. The low multiplicity data obtained in SETUP I were analyzed on traditional projection tables by human operators.
Since the time projection chamber (TPC) was new to NA35 and relatively new for heavy ion applications [18], we will describe its operation briefly. A charged particle which traverses the sensitive volume of the TPC, ionizes gas molecules and produces electrons along its trajectory. Guided by a homogeneous electric drift field, the electrons drift towards the read-out MWPCs of the TPC. A field gradient at the sense wires leads to a multiplication of the drifted electrons by . The resulting space charge induces a signal onto the segmented cathode plane (pads). The centroid of these induced signals (clusters) can be determined with an accuracy of m in pad direction and of m in drift (time) direction. Pattern recognition is done by a simple track follower, which associates clusters with a straight line [20]. The particle momenta are determined by assuming that the particles emerge from a known production vertex.
4.1 Track recognition and reconstruction efficiency
The momentum resolution achieved with the streamer chamber as a continuous tracking device is approximately 3 MeV/c () for a typical pion with momentum of 2 GeV/c. The momenta in the TPC are typically higher than in the streamer chamber, since the TPC is located at more forward angles in the laboratory. The TPC resolution for 10 GeV/c tracks is approximately .
In the streamer chamber track reconstruction losses due to tracks which overlap in the individual camera projections as well as to two-track resolution, pattern recognition and space reconstruction inefficiencies can be examined by either of two methods. The first method relies on human visual scanning of film data and multiple independent scans of the same data. The second method is a Monte Carlo simulation of digitally processed images. By this method heavy ion events are simulated using the FRITIOF event generator code [21]. The track trajectories are modeled through the NA35 experimental set-up using the GEANT detector simulation package [22]. For each track the streamers are calculated and then projected through the imaging system onto film. The film response and digitisation process are then simulated. The resulting digital event pictures are submitted to the entire pattern recognition and track reconstruction process. This procedure provides the efficiency as a function of the two kinematical variables rapidity and transverse momentum . Both methods give an overall efficiency of about 95-97 for the highest multiplicities in our acceptance.
For the TPC the reconstruction efficiency was determined by a Monte-Carlo simulation using the VENUS event generator [12], the GEANT-program and a simulation of the TPC response [23]. The efficiency was found to be 90-95, approximately independent of and within the geometrical acceptance. For the particle spectra the inefficiencies were corrected as a function of and .
A comparison of rapidity densities of negatively charged hadrons obtained by the streamer chamber analysis of SETUP II and SETUP III data and by the TPC analysis is shown in Fig. 4. For the symmetric system S+S streamer chamber data below midrapidity can be reflected about and then compared to TPC data above midrapidity as shown in Fig. 5. The TPC data below and above have been extrapolated to low and high respectively by an exponential in . The comparisons in both figures demonstrate a satisfactory agreement (within several ).


4.2 Particle identification
We define negatively charged hadrons as the sum of , and . Their average multiplicities in central S+S collisions are estimated to be about 90:7:1 [11, 19]. Corrections for electron contamination were made on a statistical basis (see next chapter). The rapidity of negatively charged hadrons was calculated assuming the pion mass, throughout; this implies that the and contributions to rapidity distributions appear with an upward shift relative to their true position. A slight asymmetric widening of the rapidity distribution results. Since the streamer chamber has very little particle identification capability for stable particles, the net proton distribution was deduced from a measurement of the charge excess
where the rapidity is calculated assuming the proton mass. This is a good approximation for all rapidities in collisions of isoscalar nuclei (equal number of neutrons and protons) assuming local isospin conservation. Even for asymmetric systems deviations are expected to be small. Equating net protons to the charge-excess is subject to corrections which will be discussed below.
4.3 Corrections
All data in this paper are corrected for geometric acceptance and reconstruction inefficiencies, for and misidentified as hadrons, for hadrons resulting from the weak decays of , hyperons and for hadrons produced in secondary hadron-nucleus interactions.

One source of contamination in the charged hadron spectra is the 2-decay of the abundantly produced inside the target and subsequent conversion of s into –pairs. The spectral distributions of contaminant electrons were obtained from a Monte Carlo calculation using the experimental negative particle distributions and assuming equal and meson multiplicities and spectra. An alternative method is to use the spectra obtained from an event generator (FRITIOF), with parameters tuned to reproduce the measured spectra, and a GEANT simulation for the subsequent decays and conversions. The latter method was employed at high rapidities, where the data based Monte Carlo may suffer from reconstruction inefficiencies at high momenta. The methods give similar results, which are confirmed by identified electron spectra that are measured in the TPC and displayed in Fig. 6. The electron contribution to the charged particle spectra is subtracted for each bin.
The contamination of the negatively charged hadron spectra by pions produced in secondary interactions primarily in the target, and in weak decays is corrected for on the basis of GEANT simulations (see e.g. [24]). The parameters of the event generators were tuned to reproduce the measured strange particle yields and spectra.
The contributions of the various contaminations as functions of and for a central S+Ag collision are shown in Figs. 7 and 8 respectively. The contaminations are largest at small . The electrons dominate below transverse momenta of 150 MeV/c. The first bin (50 MeV/c) especially is strongly affected by the electron correction, the amount of the contamination can be up to 50%. Above 150 MeV/c the weak decay products represent the main contamination to the spectrum. For larger transverse momenta the various contributions get smaller. The rapidity dependence of the decay product contamination follows the distribution of the primaries, while electrons and secondary interactions contribute more strongly at low rapidities (Fig. 8). The overall systematic error on the spectra is estimated to be less than 5% for above 50 MeV/c.
All data - spectra of both negatively and positively charged hadrons - were corrected as described above. In addition, when deriving the net proton spectra from the charge excess, a correction is applied for the excess of the relative to the yield. Since these corrections are based on measurements of the same experiment over a wide acceptance, the corrections are model independent. Nevertheless, these corrections become large at low transverse momenta, particularly at low rapidities, and therefore a low- cut was applied to the net proton spectra. This cut also takes care of possible differences in the and yields for non-isoscalar systems of colliding nuclei. In order to obtain rapidity densities the transverse momentum spectrum was extrapolated into the part below the cut using a thermal fit to the data. This extrapolation contributes approximately 20% (assuming a temperature of about 200 MeV and a -cut of 300 MeV/c) to the cross section.
The validity of equating participant protons to the charge-excess even in asymmetric systems is demonstrated in Fig. 9. Particles taken from a simulation (FRITIOF) were passed to a GEANT-program of the experimental setup. After all corrections described above the net proton distribution which was deduced from the charge excess agrees very well with the input distribution of net protons within the acceptance . The overall systematic error on the participant proton spectra is estimated to be less than 12%. Note that this conclusion does not rest on the implication that the FRITIOF prediction in Fig. 9 gives a good account of the data (see sect. 6.1.3).


5 Net Baryons
In a simple picture of high energy nucleus–nucleus collisions one distinguishes two classes of nucleons: spectators and participants. Spectator nucleons are defined as those which did not suffer collisions and therefore have their momenta located inside the Fermi spheres of the interacting nuclei. Participant nucleons are those which suffer collisions that affect their momentum sufficiently to remove them from the Fermi sphere of the incoming nuclei. Some of them may be converted into strange and multistrange baryons. Integrating the rapidity distributions of net baryons (baryons minus antibaryons) between and yields an estimate of the total number of participant baryons. This estimate is only accurate in the case of central collisions of identical nuclei (S+S), where the number of spectators is small compared to the number of participants so that the result of the technical procedure to separate spectators and participants depends only weakly on the cuts used. For asymmetric systems the net baryon number as calculated in this paper should be treated as a crude approximation of the number of participants since cascading processes in the target spectator matter may invalidate the definition of a spectator.
5.1 Rapidity distributions
Rapidity distributions of net protons were obtained from the charge excess with the associated corrections discussed above. Since these corrections become large at low transverse momenta, a cut was applied at 300 MeV/c (for S+A collisions at 400 MeV/c). The missing low momentum part was extrapolated on the basis of a thermal fit in order to obtain rapidity densities (see chapter 5.2). In comparing rapidity distributions for the various systems one has to keep in mind that different forward energy triggers may affect the spectra differently.
5.1.1 Proton-Nucleus Collisions
The rapidity distributions of net protons for minimum bias p+S and p+Au interactions are shown in Fig. 10. While the rapidity densities around midrapidity ( for both reactions are not very different, clear differences are observed for rapidities below 1.2 and larger than 4.4. In p+Au collisions more target nucleons participate in the reactions and are therefore shifted up to one unit in rapidity farther than in p+S collisions. For the projectile the gold nucleus looks black, i.e. the probability of the projectile to traverse the target nucleus without losing any or little energy is small. For p+S interactions on the other hand, one can perceive a clear projectile proton peak at rapidity 4.7.

5.1.2 Nucleus-Gold Collisions
In order to study the dependence of nuclear stopping on the mass of the projectile in the case of incidence on a heavy target nucleus, net proton rapidity distributions were measured for various ‘full overlap’ collisions: central d+Au, central O+Au and central S+Au reactions. These data are displayed in Fig. 11. O+Au collisions were measured in the streamer chamber for rapidities below midrapidity, , SETUP I. The S+Au data were measured in the streamer chamber configuration SETUP III at rapidities . The rapidity density at midrapidity, , is observed to increase with projectile mass. A comparison of the rapidity distribution for S+Au collisions with the distributions for d+Au and O+Au, multiplied by 16 and 2 (the inverse ratios of the projectile nucleons relative to the S+Au reaction), respectively, is displayed in Fig. 12. For the O+Au data at a beam energy of 60 GeV/nucleon the rapidity axis is scaled by the ratio of the beam rapidities ( (200 GeV/nucleon) / (60 GeV/nucleon) = 6.0/4.8) prior to plotting in Fig. 12 [25, 26]. The resultant rapidity distributions are similar for . This implies that the stopping of projectile nucleons is rather independent of the size of the projectile nucleus and its energy in collisions with a heavy target nucleus.


5.1.3 Sulphur-Nucleus Collisions
To investigate the effect of changing the nuclear thickness of the target, rapidity distributions of net protons were measured for central S+S, S+Ag and S+Au collisions. The data are shown in Fig. 13. The S+S and S+Ag data were measured in the SETUP II for and S+Au data in the SETUP III for . For the symmetric system S+S, the data points reflected at are also shown. The shape of the net proton rapidity distribution changes from being relatively flat for the light symmetric system (S+S) to a monotonic decrease with rapidity for the asymmetric systems. The rapidity density at increases for heavier projectiles, and is a factor of about two larger for S+Au relative to S+S collisions. There is an excess of net protons in the forward direction for the lighter S+S reaction relative to the S+Au reaction. Thus, it is evident that the S target nucleus is less effective than the Au nucleus in stopping (slowing down) incident projectile nucleons. For the S+Au system, projectile protons are shifted further backward in rapidity than for the S+S system. The rapidity densities near midrapidity agree with the values obtained by the NA44 experiment for identified protons and antiprotons as shown in Table 2.

5.1.4 Rapidity Shift
Before the collision the nucleon rapidity distribution is concentrated in peaks at the target rapidity and at beam rapidity , with the peak width given by the Fermi momentum inside the nuclei (). After the collision, target and projectile nucleons are shifted towards midrapidity, with some nucleons converted into (multi)strange baryons. The latter must also be counted in the evaluation of rapidity loss. The rapidity distributions of net hyperons () for minimum bias p+S and p+Au collisions are displayed in Fig. 14. Those for central collisions of S+S, S+Ag, and S+Au are displayed in Fig. 15. The trends in the rapidity distributions for net hyperons as a function of target nucleus are similar to those for net protons described in the previous section.
In order to quantify the amount of stopping in symmetric and asymmetric collisions, the average rapidity loss (or mean rapidity shift) is defined, where is the incoming projectile rapidity and is the average net baryon rapidity after the collision. For symmetric systems the average rapidity was calculated by averaging the rapidity of the net protons in the interval from to . For the asymmetric systems is defined as the average rapidity of the net proton distribution in the projectile hemisphere from to a rapidity such that the integral under the distribution equals the number of net projectile protons [28]. If the target and projectile nucleons mix, the rapidity loss defined in this manner is a lower limit.
The average rapidity losses for collisions of various projectiles with sulphur and gold targets are displayed in Fig. 16. For each target is approximately independent of projectile mass (but may also be construed as being consistent with a slight increase with projectile mass). The most obvious trend is a shift from = 1.2 - 1.6 for sulphur target interactions to = 2.0 - 2.3 for the gold target interactions.


5.1.5 Number of Net Baryons
By integrating the rapidity distributions the number of net protons inside the acceptance was obtained and is shown in Table 3. The total number of net protons is defined as the net proton number in the final state outside the ‘Fermi spheres’ of the projectile and target nuclei - approximated by selecting a rapidity range 0.2 to 5.8. For systems where the acceptance does not cover the rapidity range from 0.2 to 5.8, we extrapolated the rapidity distribution. For the O+Au data the extrapolation was based on the observed scaling behaviour of 60 GeV/nucleon O+Au data (see section 5.1.2). The number of net protons in S+Ag collisions at was estimated to be the average of S+S and S+Au data.
The charge-excess method, corrected for the asymmetry and strange hyperon decays, leads to the number of observed net protons. In order to estimate the total number of net baryons one needs in addition an estimate of the total number of net hyperons. Table 4 shows the measured yields of net lambdas measured in the same experiment [8, 9, 10]. We derived the corresponding correction for the total number of net hyperons from the distributions using Wróblewski’s empirical rule [29] .
Multiplying the number of net protons by 2 (in the case of p-induced reactions only in the target hemisphere) and adding the corrected number of hyperons gives an estimate of the total number of net baryons. These estimates are shown in Table 5. This procedure is valid for collisions of isoscalar nuclei (equal number of neutrons and protons) and only a crude approximation in all other cases. Only in the case of central collisions of isoscalar nuclei the number of net baryons equates the number of participant nucleons. Comparing the measured number of net baryons with the number of wounded nucleons using the standard geometrical approach [30] one finds a discrepancy between these two numbers in asymmetric systems. This can be explained by target spectators misidentified as participants or additional participants due to cascading effects in spectator matter.
| Reaction | |||
|---|---|---|---|
| p+S | - | - | 2.4 0.2 |
| p+Au | - | - | 5.9 0.2 |
| d+Au | - | - | 10.7 0.2 |
| O+Au | 42 5 | - | 47 5 |
| S+S | 10.6 0.8 | 10.6 0.8 | 21.2 1.3 |
| S+Ag | 32 2 | - | 43 3 |
| S+Au | - | 11.4 0.5 | - |
| Reaction | |||
| p+S | 0.19 0.02 | - | 0.23 0.03 |
| p+Au | - | 0.20 0.02 | 0.28 0.03 |
| S+S | 3.6 0.4 | 3.6 0.4 | 7.2 0.6 |
| S+Ag | 8.5 0.8 | 3.9 0.5 | 12.6 1.2 |
| S+Au | - | 3.9 0.4 | - |
| Reaction | ||
| calculated | ||
| p+S | 4.2 0.8 | 3.2∗ |
| p+Au | - | 4.7∗ |
| d+Au | - | 10 |
| O+Au | - | 68 |
| S+S | 54 3 | 53 |
| S+Ag | 105 12 | 92 |
| S+Au | - | 113 |
5.2 Transverse momentum distributions of net protons
The invariant cross sections as a function of the transverse momentum for net protons are compatible with the following parametrization of the transverse momentum spectra as suggested by thermodynamic models:
| (1) |
where is the transverse mass of particles with rest mass , is a normalization factor and is the modified Bessel function of order one. The parameter is determined by fitting the experimental data and can be interpreted in thermal models without transverse flow as the thermal freeze-out ‘temperature’.
Figs. 17-19 show transverse momentum distributions of net protons for various collision systems at 200 GeV/nucleon together with fits to Eq. 1. The invariant spectra of protons as a function of for various systems are well described by inverse slope parameters (‘temperatures’) of approximately MeV (Table 6). The ‘temperatures’ are observed to increase with the mass of the colliding system and are highest at midrapidity. The ‘temperatures’ range from MeV for minimum bias p+S to MeV for central collisions of S+S, S+Ag and S+Au. Dividing the rapidity range into two bins, and , and fitting the spectra separately in these bins results in inverse slope parameters that are about MeV higher at midrapidity as compared to the values at lower rapidity for all systems.


Fitting a simple exponential
| (2) |
results in somewhat higher ‘temperatures’ as shown in Table 6. Also shown are our published results for S+S collisions and results from another experiment. The ‘temperature’ reported by NA35 in [3] was about 40 MeV lower. Much higher statistics of the recent data allowed a more detailed contamination correction as described in Section 4. NA44 data [27, 31] measured in a small rapidity interval near midrapidity for less central collisions yield somewhat lower inverse slope parameters.
| [MeV] | [MeV] | |||
| (Eq. 1) | (Eq. 2) | |||
| Reaction | NA35 | NA44 | ||
| p+S | 145 11 | 154 14 | ||
| p+Au | 156 4 | 163 5 | ||
| d+Au | 161 2 | 172 5 | ||
| O+Au | 204 4 | 219 5 | ||
| S+S | 226 5 | 180 14 [3] | 235 9 | 208 8 [31] |
| S+Ag | 224 2 | 238 2 | ||
| S+Au | 244 43 | 276 48 | 242 3 [27] | |
6 Negatively Charged Hadron Production
Essentially all of the energy deposited in the reaction volume by the participant nucleons goes into the production of hadrons. Without extensive particle identification in this experiment, only distributions of inclusive charged hadrons can be measured and separation of various species (such as , K+, ) is not possible. The positive hadron distributions are more complicated to interpret than the negative ones, since the contribution of and is a large contamination. Thus, we will concentrate on the distributions of negative hadrons which are primarily mesons. The relevant contamination and acceptance corrections as described in section 4 were applied.
6.1 Rapidity Distributions
6.1.1 Proton-Nucleus Collisions
The rapidity distributions of negatively charged hadrons produced in p+S and p+Au interactions are shown in Fig. 20. For comparison nucleon–nucleon reactions are also included. The nucleon–nucleon interactions are defined here as , the data are taken from [33] (cf. [34] and [35] and references therein). The from nucleon–nucleon interactions peak at midrapidity. The multiplicity increases with target mass, and the maximum of the distribution shifts to lower rapidities with increasing target mass. This is indicative of -production after multiple collisions. For , the yield of produced in p+Au collisions appears to be lower than that for nucleon–nucleon and p+S collisions. Fig. 21 shows a comparison to minimum bias p+p, p+Ar and p+Xe data from experiment NA5 at the CERN-SPS [36].


6.1.2 Nucleus-Gold Collisions
The rapidity distributions of negatively charged hadrons produced in central d+Au, O+Au and S+Au collisions are shown in Fig. 22. The distributions exhibit a peak at below . The multiplicity increases with projectile mass, and the maximum of the distribution moves toward midrapidity with increasing projectile mass.

6.1.3 Sulphur-Nucleus Collisions
To investigate the target mass dependence for S-induced reactions, rapidity distributions of negatively charged hadrons produced in central S+S, S+Ag and S+Au collisions are compared in Fig. 23. The distribution peaks at midrapidity for the symmetric S+S interactions. The multiplicity increases with the target mass, and the maximum of the distribution moves to lower rapidities with increasing target mass. Fig. 24 shows a comparison of the rapidity distributions of negatively charged hadrons produced in central S+S collisions and in minimum bias nucleon–nucleon interactions. The latter was scaled by the ratio of participant nucleons. The width of the distribution for S+S collisions is slightly narrower than the one for the nucleon–nucleon interactions. The mean negative hadron multiplicity per participant is higher in central S+S collisions than in N+N interactions by about .


6.1.4 Extrapolation to
Since the rapidity distributions were measured over a wide kinematic range and cover almost all rapidities between target and beam rapidity, the spectra can be extrapolated to full phase space in order to obtain average total multiplicities. The results are compiled in Table 7. The extrapolation to target and beam rapidity was based on a gaussian fitted locally to the adjacent part of the rapidity distribution. The multiplicities increase with system mass. For comparison average total multiplicities reported from different experiments are also shown. For a review of multiplicities of negatively charged hadrons produced in nuclear collisions cf. [39].
The average multiplicity of negatively charged hadrons increases with the number of net protons. For not too asymmetric systems the ratio of the multiplicity of negatively charged hadrons per net (participant) baryon is shown in Fig. 25. This ratio is smaller in nucleon–nucleon and p+S interactions than in central S+S and S+Ag collisions.
| Reaction | ||
|---|---|---|
| p+p [35] | - | 2.85 0.03 |
| N+N [35] | - | 3.22 0.06 |
| p+Mg [37] | - | 4.9 0.4 |
| p+S [9] | - | 5.0 0.2 |
| p+S | 5.7 0.1 | 5.9 0.2 |
| p+Ar [36] | - | 5.39 0.17 |
| p+Ag [37] | - | 6.2 0.2 |
| p+Xe [36] | - | 6.84 0.13 |
| p+Au | 6.6 0.1 | 9.9 2 |
| p+Au [37] | - | 7.0 0.4 |
| p+Au [38] | - | 7.3 0.3 |
| ‘central’ | ||
| p+Au [8] | - | 9.6 0.2 |
| d+Au | 17.2 0.3 | 23 4 |
| O+Au | 94 2 | 137 9 |
| O+Au [38] | - | 124.0 1.9 |
| S+S | 90 1 | 98 3 |
| S+S [3] | - | 94 5 |
| S+Ag | 162 2 | 186 11 |
| S+Au | 201 2 | 225 12 |

6.2 Transverse Momentum Spectra
It is important to study the transverse degrees of freedom for produced hadrons in order to learn more about the degree of thermalization in heavy ion collisions and possible effects of collective flow on the spectra. Thermal model fits of the invariant cross sections (see Eqs. 1 and 2) as a function of provide information on the production mechanisms for hadrons. It is known that pions, the majority of the negatively charged hadrons, are to a large part daughters from the decays of heavier resonances. In addition, possible transverse collective flow could further modify the spectra. It is thus not too surprising that the spectra of negatively charged hadrons are, in general, incompatible with thermal parametrizations over the entire -range with the exception of p+S interactions [40, 41, 42, 43, 44]. Since the distributions are found not to be thermal, a systematic analysis using Eq. 2 fits is excluded. Therefore, the data on transverse momentum distributions will be presented systematically without fits in the following sections. However, a fit to Eq. 2 was performed for all systems in the rapidity bin near midrapidity in a limited range ( GeV/c) in order to give a rough estimate of ‘temperatures’.
6.2.1 Proton–Nucleus collisions
The transverse momentum spectra of negatively charged hadrons produced in minimum bias p+S and p+Au collisions are shown in Figs. 26 a,b for four different rapidity intervals: , , , . The corresponding spectra have been multiplied by the factors of 1000, 100, 10, and 1, respectively, for presentation on the same plot.

6.2.2 Nucleus-Nucleus Collisions
The transverse momentum spectra of negatively charged hadrons produced in central d+Au interactions and central O+Au and S+Au collisions are shown in Figs. 27 a-c for various rapidity intervals. The corresponding spectra were multiplied by factors of 1000, 100, 10, and 1, respectively, in the case of d+Au collisions. For the heavy ion collisions the first two spectra (rapidities below midrapidity) were multiplied by factors of 100 and 10. The distributions especially at low rapidities () for central O+Au and S+Au collisions clearly exhibit a deviation from a single exponential in with an enhancement at low transverse momenta in the backward rapidity region.

The transverse momentum spectra of negatively charged hadrons produced in central S+S, S+Ag and S+Au collisions are shown in Figs. 28 a-c for various rapidity intervals.

6.3 Mean transverse momentum
The invariant cross sections of negatively charged hadrons cannot be fitted over the entire range with a single exponential in or . Thus, the mean transverse momentum is calculated for various systems and rapidity intervals, and the results are presented in Table 8. As an example, the rapidity dependence of in central S+A collisions is shown in Fig. 29. The mean transverse momentum reaches a maximum at midrapidity and exhibits little dependence on rapidity in the vicinity of .
For , decreases rapidly. For the gold target (Fig. 30) there is a slight increase of in the target hemisphere with the projectile mass. For p+p interactions the is 340 7 MeV/c for [32, 33, 46] and 366 2 MeV/c for all charged particles in [45].


| Reaction | |||
| p+S | 325 6 | 363 8 | 335 8 |
| p+Au | 311 5 | 377 6 | 372 7 |
| d+Au | 331 4 | 369 5 | 384 5 |
| O+Au | 353 5 | 373 4 | 374 12 |
| S+S | 349 9 | 377 4 | 388 11 |
| S+Ag | 346 2 | 376 1 | 385 1 |
| S+Au | 359 6 | 384 5 | 371 10 |
| S+Au | 364 2 | 322 3 | 261 4 |
6.4 Inverse slope parameters
To facilitate comparison with other published results (see Table 10) fits to Eq. 2 were performed in the interval GeV/c. The resulting inverse slope parameters are listed in Table 9. A typical result of such a fit is shown in Fig. 31 which indicates an overall discrepancy between the concavely shaped data and the rather straight to convex curve corresponding to Eq. 2. The fit is thus carried out in the restricted range only, and this has always to be kept in mind in comparing to other results concerning and . Below 250 MeV/c the data points are all above the fit. This enhancement (low enhancement) is most pronounced at low rapidities in collisions with heavy targets [47]. Fitting p+p data in a similar way and averaging the results from different experiments yields an inverse slope parameter at midrapidity of 142 10 MeV [31, 34, 40, 41, 48].
| [MeV] | ||||
| Reaction | ||||
| p+S | 159 13 | 169 13 | 154 10 | 142 12 |
| p+Au | 150 8 | 183 10 | 177 9 | 171 10 |
| d+Au | 151 9 | 165 10 | 181 12 | 183 11 |
| O+Au | 189 5 | 188 8 | 175 10 | - |
| S+S | 175 4 | 191 7 | 191 6 | 186 5 |
| S+Ag | 184 2 | 199 2 | 201 4 | 185 5 |
| S+Au | 182 7 | 200 10 | 190 10 | 187 5 |
| [MeV] | ||
|---|---|---|
| this paper | NA34 [43] | |
| Reaction | ||
| p+Au/W | 150 8 | 161 5 |
| O+Au/W | 189 5 | 167 5 |
| S+Au/W | 182 7 | 165 5 |
| this paper | NA44 [27, 31] | |
| GeV/c2 | ||
| Reaction | ||
| S+S | 191 6 | 148 4 |
| S+Au/Pb | 190 10 | 156 8 |

The average transverse momentum of negatively charged hadrons exhibits only a slight increase with the system size, measured by the average total multiplicity of the collision, as shown in Fig. 32, whereas the temperature of the net protons increases from about 150 MeV in p–nucleus to 200 MeV in central O+Au collisions and about 240 MeV in central S–nucleus collisions (Fig. 33).


7 Summary
We have presented results of a systematic study,
using the NA35 experiment at CERN,
of rapidity and transverse momentum
distributions of net protons and negatively charged
hadrons. A large part of this data was
analyzed employing a new automatic analysis
technique developed by NA35. The most significant findings are:
1) The shape of the rapidity distributions
of net projectile protons ()
is similar
for d+Au, central O+Au and central S+Au collisions.
From this we conclude that the stopping of projectile nucleons
is independent of the size of the (light) projectile nucleus
when incident on a heavy target nucleus (Au in this study).
This suggests that there is no significant difference in the stopping
mechanism as inferred from the proton rapidity
for these light incident nuclei.
2) The average rapidity loss
for projectile protons
which participate in the interaction
is
= 1.2 - 1.6 for various projectiles
from protons to sulphur
incident on a sulphur target
and
= 2.0 - 2.3 for a gold target.
The
are found to be
approximately independent of the
projectile mass for projectile masses ranging from protons
to sulphur. Thus, the rapidity loss of projectile participant protons
increases with the nuclear thickness of the target and is approximately
independent of the nuclear thickness of the lighter projectile as might be expected.
3) The number of net protons at midrapidity increases
with projectile mass and with target mass. Since the
mean rapidity shift measured for interacting projectile protons
increases with target mass up to
= 2.0 - 2.3 for a gold target
and since the rapidity region for 200 GeV/nucleon
incident energy is a total of ,
it is expected that the total number of protons at midrapidity
() will increase with both projectile and target mass.
This results in a
significant pile-up of protons at midrapidity
for the heavier systems.
4) The transverse momentum distributions for net protons
()
can be described by thermal distributions with ‘temperatures’ ranging from
T 140 MeV for p + S near target rapidity to
T 245 MeV for central S + S and S + Au collisions at midrapidity, using Eq. 1.
Such inverse slope parameters are much higher than the
Hagedorn temperature ( MeV) and cannot be considered
to be true thermal freeze-out temperatures. Our results may indicate the presence
of radially ordered transverse flow in central S+A collisions.
5) The average negative hadron multiplicity increases with
both the target and projectile masses.
The mean negative hadron multiplicity per participant is higher in
central S+A collisions than in N+N interactions by about .
6) The mean transverse momentum of negatively charged hadrons at midrapidity
is approximately independent of the mass of the incident nuclei.
There is a decrease in the mean transverse momentum when
going away from midrapidity. This is observed for all colliding systems of this
study.
7) The spectra of negatively charged hadrons do not have a simple thermal shape.
They exhibit deviations (above a thermal spectrum) at low ( 250 MeV/c)
and high ( 1 GeV/c) transverse momenta. These significant
deviations may be due to
transverse collective flow and resonance production and decay as well as to
the ‘Cronin effect’.
Acknowledgement
We are very grateful to our scanning and measuring crews at
Frankfurt, Munich and Warsaw for their careful and devoted work.
This work was supported by the Bundesministerium für Forschung
und Technologie and by the Leibniz Grant of the Deutsche Forschungsgemeinschaft,
Germany, by the US Department of Energy (DE–AC03–76SF00098), by the Polish
State Committee for Scientific Research (204369101),
by the Polish-German Foundation (565/93) and
by the Commission of European Communities (CI–0250YU(A)).
References
- [1] Proc. 11th Int. Conf. on Ultra-Relativistic Nucleus-Nucleus Collisions (Quark Matter 1995), Monterey, California, USA (1995), ed. by A.M. Poskanzer, J.W. Harris and L.S. Schroeder, Nucl. Phys. A590 (1995).
- [2] Proc. 12th Int. Conf. on Ultra-Relativistic Nucleus-Nucleus Collisions (Quark Matter 1996), Heidelberg, Germany (1996), ed. by P. Braun-Munzinger, H.J. Specht and R. Stock, Nucl. Phys. A610 (1997).
- [3] J. Bächler et al., NA35 Collaboration, Phys. Rev. Lett. 72 (1994) 1419.
- [4] H. Sorge, Z. Phys. C67 (1995) 479, C71 (1996) 178 (erratum).
- [5] U. Ornik et al., Phys. Rev. C54 (1996) 1381; J. Bolz, U. Ornik and R.M. Weiner, Phys. Rev. C46 (1992) 2047.
- [6] J. Sollfrank et al., Z. Phys. C61 (1994) 659; E. Schnedermann, J. Sollfrank and U. Heinz, Phys. Rev. C48 (1993) 2462.
- [7] J. Bächler et al., NA35 Collaboration, Z. Phys. C52 (1991) 239.
- [8] A. Bamberger et al., NA35 Collaboration, Z. Phys. C43 (1989) 25.
- [9] J. Bartke et al., NA35 Collaboration, Z. Phys. C48 (1990) 191.
- [10] J. Bächler et al., NA35 Collaboration, Z. Phys. C58 (1993) 367.
- [11] T. Alber et al., Z. Phys. C64 (1994) 195.
- [12] K. Werner, Phys. Rev. Lett. 62 (1989) 2460.
- [13] J. Cleymans and H. Satz, Z. Phys. C57 (1993) 135.
- [14] P. Braun-Munzinger et al., Phys. Lett. B365 (1996) 1.
- [15] A. Leonidov, M. Nardi and H. Satz, Z. Phys. C74 (1997) 535.
- [16] D. Brinkmann et al., Nucl. Inst. and Meth. A354 (1995) 419.
- [17] S. Wenig, GSI-90-23 Report (1990).
- [18] J.W. Harris et al., Nucl. Inst. and Meth. A315 (1992) 33.
- [19] T. Alber et al., NA35 Collaboration, Phys. Lett. B366 (1996) 56.
- [20] G. Roland, Univ. of Frankfurt PhD thesis (1992).
- [21] B. Andersson, G. Gustafson and B. Nilsson-Almqvist, Nucl. Phys. B281 (1987) 289.
- [22] R. Brun et al., GEANT3 User Guide CERN/DD/EE/84-1 (1986).
- [23] H. Appelshäuser, Diploma thesis, Univ. of Frankfurt, GSI-93-09 Report (1993).
- [24] L.P. Teitelbaum, PhD thesis, LBL-32812, Berkeley (1992).
- [25] S.R. Tonse et al., NA35 Collaboration, Nucl. Phys. A525 (1991) 689c.
- [26] D. Röhrich, “Hadron Production in Nucleus-Nucleus Collisions at SPS- and AGS-Energies”, pp. 505-516 in Hot and Dense Nuclear Matter, ed. by W. Greiner, H. Stöcker and A. Gallmann, (NATO ASI Series B: Physics Vol. 335), New York and London: Plenum Press, 1994.
- [27] J. Dodd, NA44 Collaboration, Nucl. Phys. A590 (1995) 523c.
- [28] F. Videbaek and O. Hansen, Phys. Rev. C52 (1995) 2684.
- [29] A. Wróblewski, Acta Phys. Polonica B16 (1985) 379.
- [30] A. Białas, M. Błeszyński, W. Czyż, Nucl. Phys. B111 (1976) 461.
- [31] I.G. Bearden et al., NA44 Collaboration, Phys. Rev. Lett. 78 (1997) 2080.
- [32] A.M. Rossi et al., Nucl. Phys. B84 (1975) 269.
- [33] T. Kafka et al., Phys. Rev. D16 (1977) 1261.
- [34] M. Adamus et al., Z. Phys. C39 (1988) 311.
- [35] M. Gaździcki and O. Hansen, Nucl. Phys. A528 (1991) 754.
- [36] C. De Marzo et al., Phys. Rev. D26 (1982) 1019.
- [37] D.H. Brick et al., Phys. Rev. D39 (1989) 2484.
- [38] J. Bächler et al., NA35 Collaboration, Z. Phys. C51 (1991) 157.
- [39] M. Gaździcki and D. Röhrich, Z. Phys. C65 (1995) 215.
- [40] B. Alper et al., Nucl. Phys. B100 (1975) 237.
- [41] K. Guettler et al., Nucl. Phys. B116 (1976) 77.
- [42] J.W. Cronin et al., Phys. Rev. D11 (1975) 3105.
- [43] T. Åkesson et al., HELIOS Collaboration, Z. Phys. C46 (1990) 361.
- [44] H. Bøggild et al., NA44 Collaboration, Z. Phys. C69 (1996) 621.
- [45] C. De Marzo et al., Phys. Rev. D29 (1984) 363.
- [46] J. Whitmore, Phys. Rep. C10 (1974) 273.
- [47] D. Röhrich et al., NA35 Collaboration, Nucl. Phys. A566 (1994) 35c.
- [48] Y. Cho, Phys. Rev. Lett. 31 (1973) 413.