Hadronic Expansion Dynamics in Central Pb+Pb Collisions at 158 GeV per Nucleon
Abstract
Abstract
Two-particle correlation functions of negative hadrons over wide phase space, and transverse mass spectra of negative hadrons and deuterons near mid-rapidity have been measured in central Pb+Pb collisions at 158 GeV per nucleon by the NA49 experiment at the CERN SPS. A novel Coulomb correction procedure for the negative two-particle correlations is employed making use of the measured oppositely charged particle correlation. Within an expanding source scenario these results are used to extract the dynamic characteristics of the hadronic source, resolving the ambiguities between the temperature and transverse expansion velocity of the source, that are unavoidable when single and two particle spectra are analysed separately. The source shape, the total duration of the source expansion, the duration of particle emission, the freeze-out temperature and the longitudinal and transverse expansion velocities are deduced.
Hadronic Expansion Dynamics in Central Pb+Pb Collisions at 158 GeV per Nucleon
NA49 Collaboration
H. Appelshäuser7,#, J. Bächler5, S.J. Bailey16, L.S. Barnby3, J. Bartke6, R.A. Barton3, H. Białkowska14, A. Billmeier10, C.O. Blyth3, R. Bock7, C. Bormann10, F.P. Brady8, R. Brockmann7,†, R.Brun5, P. Bunčić5,10, H.L. Caines3, D. Cebra8, G.E. Cooper2, J.G. Cramer16, P. Csato4, J. Dunn8, V. Eckardt13, F. Eckhardt12, M.I. Ferguson5, D.Ferenc5, H.G. Fischer5, D. Flierl10, Z. Fodor4, P. Foka10, P. Freund13, V. Friese12, M. Fuchs10, F. Gabler10, J. Gal4, M. Gaździcki10, E. Gładysz6, J. Grebieszkow15, J. Günther10, J.W. Harris17, S. Hegyi4, T. Henkel12, L.A. Hill3, I. Huang2,8, H. Hümmler10,+, G. Igo11, D. Irmscher2,7, P. Jacobs2, P.G. Jones3, K. Kadija18,13, V.I. Kolesnikov9, M. Kowalski6, B. Lasiuk11,17, P. Lévai4 A.I. Malakhov9, S. Margetis2,$, C. Markert7, G.L. Melkumov9, A. Mock13, J. Molnár4, J.M. Nelson3, M. Oldenburg10, G. Odyniec2, G. Palla4, A.D. Panagiotou1, A. Petridis1, A. Piper12, R.J. Porter2, A.M. Poskanzer2, S. Poziombka10, D.J. Prindle16, F. Pühlhofer12, W. Rauch13, J.G. Reid16, R. Renfordt10, W. Retyk15, H.G. Ritter2, D. Röhrich10, C. Roland7, G. Roland10, H. Rudolph2,10, A. Rybicki6, A. Sandoval7, H. Sann7, A.Yu. Semenov9, E. Schäfer13, D. Schmischke10, N. Schmitz13, S. Schönfelder13, P. Seyboth13, J. Seyerlein13, F. Sikler4, E. Skrzypczak15, G.T.A. Squier3, R. Stock10, H. Ströbele10, C. Struck12, I. Szentpetery4, J. Sziklai4, M. Toy2,11, T.A. Trainor16, S. Trentalange11, T. Ullrich17, M. Vassiliou1, G. Vesztergombi4, D. Vranic5,18, F. Wang2, D.D. Weerasundara16, S. Wenig5, C. Whitten11, T. Wienold2,#, L. Wood8, T.A. Yates3, N. Xu2, J. Zimanyi4, X.-Z. Zhu16, R. Zybert3
1Department of Physics, University of Athens, Athens, Greece, 2Lawrence Berkeley National Laboratory, University of California, Berkeley, USA, 3Birmingham University, Birmingham, England, 4KFKI Research Institute for Particle and Nuclear Physics, Budapest, Hungary, 5CERN, Geneva, Switzerland, 6Institute of Nuclear Physics, Cracow, Poland, 7Gesellschaft für Schwerionenforschung (GSI), Darmstadt, Germany, 8University of California at Davis, Davis, USA, 9Joint Institute for Nuclear Research, Dubna, Russia, 10Fachbereich Physik der Universität, Frankfurt, Germany, 11University of California at Los Angeles, Los Angeles, USA, 12Fachbereich Physik der Universität, Marburg, Germany, 13Max-Planck-Institut für Physik, Munich, Germany, 14Institute for Nuclear Studies, Warsaw, Poland, 15Institute for Experimental Physics, University of Warsaw, Warsaw, Poland, 16Nuclear Physics Laboratory, University of Washington, Seattle, WA, USA, 17Yale University, New Haven, CT, USA, 18Rudjer Boskovic Institute, Zagreb, Croatia.
†deceased.
$present address: Kent State Univ., Kent, OH, USA
#present address: Physikalisches Institut, Universitaet Heidelberg, Germany.
+present address: Max-Planck-Institut für Physik, Munich, Germany.
1 Introduction
Lattice QCD calculations [1] predict that a phase transition occurs between hadronic and deconfined, chirally symmetric partonic matter at energy densities of about 2 GeV/fm3, corresponding to a critical temperature between 150 and 200 MeV in baryon-free matter. Studies of transverse energy distributions in central Pb+Pb collisions at the CERN-SPS with 158 GeV per nucleon 208Pb beams ( GeV per nucleon pair) show that energy densities of 2-3 GeV/fm3 are created in the initial interaction volume [2]. It is therefore conceivable that such a transition is induced in ultrarelativistic nuclear collisions. The partonic phase created in the initial stage of the collision hadronizes as the system expands and cools. The expansion dynamics of the final hadronic phase are expected to differ considerably with the presence or absence of a prior plasma phase, and it is suggested that the observed final state hadrons reflect the space-time evolution of the system and therefore provide clues as to the state of the system prior to hadronization.
The space-time evolution of a pion emitting source can be probed using the momentum-space correlation of identical pions. Bose-Einstein correlations have been first used to study the properties of a hadron emitting system created in hadronic collisions under the assumption of a static source [3]. The expansion of a source that is not static but exhibits a hydrodynamical scaling evolution has been discussed by Shuryak and Bjorken [4, 5]. Within the framework of such models it has been further shown that the dependence of the correlation function on the pion pair kinematic variables is an important diagnostic tool for the study of an expanding system [6, 7, 8].
Experiments NA35 [9] and NA44 [10] have applied this technique to the investigation of central collisions of 32S nuclei with heavy nuclear targets at the CERN SPS, resulting in the picture of a cylindrically symmetric source expanding predominantly in the longitudinal direction, with some indication of concurrent transverse expansion. NA35 has observed that the incoming energy is not completely stopped for these systems [11], consistent with the predominance of longitudinal expansion. The longitudinal evolution was found to be consistent with Makhlin and Sinyukov’s analysis [6] of “scaling” expansion, which is based on Bjorken’s earlier study [5] of an idealised hydrodynamic longitudinal expansion model. Longitudinal collective expansion is not unique to relativistic nucleus-nucleus collisions. However the transverse expansion dynamics, seen through single particle and two particle observables, is expected to be sensitive to the existence of a first order hadronization transition [7], as well as to the occurrence of a near isentropic hadronic expansion [12] which would preserve information about the initial phase, and the existence of a primordial partonic transverse expansion velocity [13, 14].
Transverse collective expansion is expected to be more prominent in the heavy Pb+Pb collision system than in collisions of lighter projectiles, owing to the smaller surface-to-volume ratio, the larger “fireball” volume and the longer duration of expansion. Indication that this is the case is provided by the single particle transverse mass spectra of kaons, protons and s produced in central Pb+Pb collisions at the CERN SPS [15, 16], which exhibit unusually high inverse slope parameters (“temperature”), in excess of 250 MeV, ruling out a simple thermal hadronic gas model [17]. These distributions can be reproduced by invoking a radial velocity field in transverse direction, though the single particle spectra alone cannot distinguish between an elevated temperature and a boost due to transverse collective expansion [12, 18] and therefore cannot determine uniquely the temperature and transverse velocity.
It will be shown that the combination of single particle spectra with two-particle correlation results can lift this essential ambiguity and determine both the expansion velocity and temperature at freezeout. The term freezeout refers here to the final decoupling of hadrons from the strong interaction. Note that the term “freezeout” is often also employed for hadronic decoupling from inelastic interactions at which point the population ratios of hadronic species become stationary [19]. This stage obviously precedes the one under study here.
The analysis of this paper is based upon measurements by the NA49 experiment of two-particle correlation functions of negative hadrons over a wide phase-space region and on single particle transverse mass spectra of negative hadrons and deuterons near and below mid-rapidity, for central Pb+Pb collisions at 158 GeV per nucleon. The like-charge pion correlation functions are corrected for Coulomb effects using a novel technique based upon the parametrization of unlike-charge pion correlation functions measured in the same experiment [20]. The corrected like-charge correlation functions are fitted with the Yano-Koonin-Podgoretskii parametrization [21] as formulated by Heinz [22] and the extracted source parameters are studied as function of rapidity and transverse momentum of the particle pair. In the framework of an expanding hadronic source model, such an analysis of correlation functions yields information about the source size and the duration of the freezeout process, as well as the ratio near mid-rapidity, where is the transverse velocity and is the freezeout temperature. The ambiguity between temperature and expansion velocity implicit in the ratio can then be lifted by considering single particle transverse mass spectra. A consistent picture of collective velocity fields governing longitudinal and transverse expansion emerges, with an estimated freezeout temperature at mid-rapidity of 120 MeV and a transverse expansion velocity of = 0.55.
The paper is organized as follows: section 2 describes the experimental procedure and data analysis, section 3 gives a discussion of the experimental determination of correlation functions, section 4 describes the determination of the source parameters through fitting with the Yano-Koonin-Podgoretskii parametrization of the correlation functions, section 5 discusses the extracted parameters in terms of source size, average freezeout time and duration, freezeout temperature and expansion velocity, section 6 introduces transverse mass spectra to determine uniquely the freezeout temperature and expansion velocity within the framework of a hydrodynamical model, and conclusions are drawn in section 7.
2 Experimental Procedure and Data Analysis
The NA49 experiment [16], shown schematically in Fig. 1, is a large acceptance hadron spectrometer at the CERN SPS. It comprises four large Time Projection Chambers (TPCs), four Time-of-Flight walls (TOF), and a forward (Veto) calorimeter for triggering. The target (T) was a foil of natural lead with thickness 224 mg/cm2 (1% interaction probability for the 208Pb beam ), mounted 80 cm upstream of the first TPC.
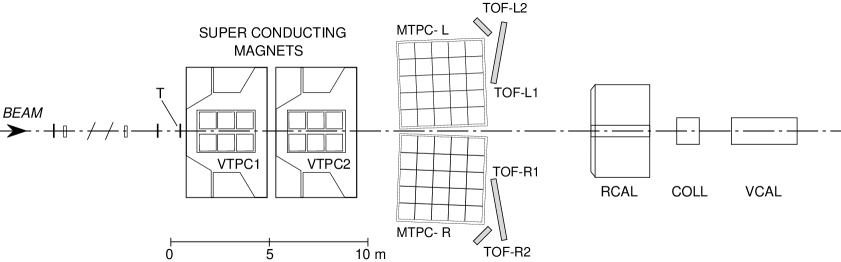
Two of the TPCs (VTPC1 and VTPC2) are placed inside dipole magnets of 9 Tm total bending power and achieve a momentum resolution = 10-4 GeV-1 . The TPCs downstream of the magnets (MTPCs), extend the acceptance to high momentum and provide particle identification via ionization measurement with a resolution of 4.5% in . The rapidity coverage of the TPCs is , and the transverse momentum range selected for this analysis is GeV/, with almost complete azimuthal coverage. The Time-of-Flight walls cover a rapidity of with an average time resolution of about 60 ps and a flight path of about 14 m.
The particle identification using the measurement of the specific ionization in the TPC gas in the relativistic rise regime is complemented by the time-of-flight measurement at the lower momenta. In the present work we utilize particle identification only for the deuteron transverse mass spectra. Two-particle correlations and pion transverse mass spectra are based upon measurement of negative hadrons, which are dominantly pions (see below).
A prompt trigger selects events from the lowest 3% of the forward energy distribution detected in the Veto calorimeter, located 27 m downstream of the target and covering the beam fragmentation region (laboratory rapidity ). This anticoincidence trigger, which vetoes events with a large number of projectile spectator nucleons, serves as a “central collision” trigger selecting impact parameters less than 3 fm [2]. About 1,200 charged particles are recorded in the NA49 TPCs for each central Pb+Pb collision.
Negative hadron two-particle correlation functions are studied using 80,000 events analyzed independently in the second Vertex TPC and in the Main TPCs. Negative hadron and deuteron transverse mass spectra are analyzed using 300,000 events in which charged particles are tracked from the MTPCs to the TOF walls. The detailed techniques employed for cluster finding, tracking, efficiency calibrations, non-vertex track rejection, and hadron identification [23] will be described in a forthcoming publication.
Since the two-particle correlation function carries the information of the source size in the small relative pair momentum range, and this region becomes narrower in momentum space the larger the source size is, the relevant signal for central Pb+Pb collisions is expected to occur at momentum differences less than 50 MeV/ in the pair centre of mass frame. Therefore the required resolution for the measurement of the momentum difference of two tracks is less than about 10 MeV/. The momentum resolution was studied using a Monte Carlo simulation chain based on the event generator VENUS [24] and the detector response simulation code GEANT [25]. The resolution in all relative momentum projections was shown to be ( MeV/ throughout the acceptance used in this study, and pair mean transverse momentum GeV/ [23].
3 Discussion of Correlation Functions
Experimentally, the normalized two-particle correlation function is obtained from the ratio
| (1) |
where is the measured two particle probability distribution as a function of relative four momentum , and is the (uncorrelated) background distribution, calculated in the same way but using two particles taken from different events.
The dynamical expansion of the source in central collisions is reflected in the dependence of the correlation function on all five non-trivial momentum components of the pair kinematics, in which the azimuthal angle with respect to the beam axis is averaged out. For extraction of the source parameters from the correlation functions we employ the Gaussian approximation in a representation given by Heinz that is appropriate to explicitly reveal longitudinal collective motion [8, 22]:
| (2) | |||||
This expression is an explicit function of the energy difference , transverse momentum difference , longitudinal momentum difference , and correlation intensity parameter , and an implicit function of the pair rapidity
| (3) |
and the mean transverse momentum . is the “Yano-Koonin velocity” which describes the source’s longitudinal collective motion in each interval of . A non-zero results in mixing the longitudinal momentum and energy differences, and , in determining the longitudinal source parameter and the time duration parameter . The parameters and are extracted from a fit to the correlation function data. The parameters and describe the apparent source extent in transverse, longitudinal and temporal directions. They still depend on pair rapidity and pair transverse momentum . This dependence will be further analysed in sections 4 and 5, resulting in the extraction of the actual geometric space-time parameters of the source within an explicit model with longitudinal and transverse expansion [8].
Due to its large acceptance, NA49 was able to determine the dependence of expression (2) on all five kinematic quantities over a wide region of and , giving a complete picture of the source expansion dynamics.
To investigate the effect of the finite resolution and other experimental effects on the correlation functions, a simulation of the Bose-Einstein correlations [23] was applied to the (uncorrelated) VENUS events, which were then processed through the detector simulation and the same analysis chain that was applied to the data. In this way, the response of the device was estimated to generate a lowering of the source parameters and by an amount between 2 and 8%. No correction for this effect was applied to the parameters reported below.
The correlation functions were calculated using all negative hadrons rather than identified pairs. The Monte Carlo simulation chain showed that the pair signal consists of about 55% genuine pairs from the primary event vertex, with this fraction uniform over the measured phase-space. The remaining background pairs arise principally from three sources: (i) , electron and antiproton contamination from the primary interaction; (ii) from and decays in flight that were erroneously flagged as primary vertex tracks, and (iii) secondary tracks generated in the detector material that could not be removed by primary vertex cuts. However, simulation of the correlation functions comparing the pair signal to the genuine pair signal showed that the contamination is “well behaved”, in that it contributes uniformly to all two-track relative momenta in all projections of the correlation function. As a result, the background contamination principally affects the absolute magnitude of the correlation signal but not the shape of the correlation functions. In an analysis employing equation (2), the Monte Carlo simulation thus showed that only the parameter, which quantifies the overall correlation strength falls from its ideal value of unity down to due to contamination in the true pair signal. The source parameters and , which depend upon the shape of the correlation function, deviate at the level of only 2 to 6%. No correction for this effect was applied to the parameters reported below. Due to the large acceptance, high multiplicity and large number of analysed events, the statistical errors on the correlation functions are negligible. Taking into account the systematical error of the fit procedures, we estimate the systematic errors of space-time parameters extracted from the correlation function to be .
In order to extract the correlation function for identical charged pions which is due to quantum statistical effects, and which is sensitive to the characteristics of the emitting source, it is necessary first to correct the observed correlation for the effect of Coulomb repulsion. The distribution in relative momentum of two charged pions is strongly affected by Coulomb repulsion as their momentum difference, , approaches zero. The correction for the Coulomb repulsion is done by applying a weight to each pion pair in the background distribution in equation (1). This weight has traditionally been the inverse of the Gamow penetrability factor [9]. The Gamow factor is “pointlike”, in that it describes the emission of an isolated pair of charged particles from a small and otherwise neutral spatial region (fm). Because of the finite size of realistic sources [26] and the multiparticle Coulomb screening which occurs when a large number of charged pions are simultaneously emitted [20], Gamow factor corrections are expected not to be appropriate for central Pb+Pb collisions at CERN SPS energies.
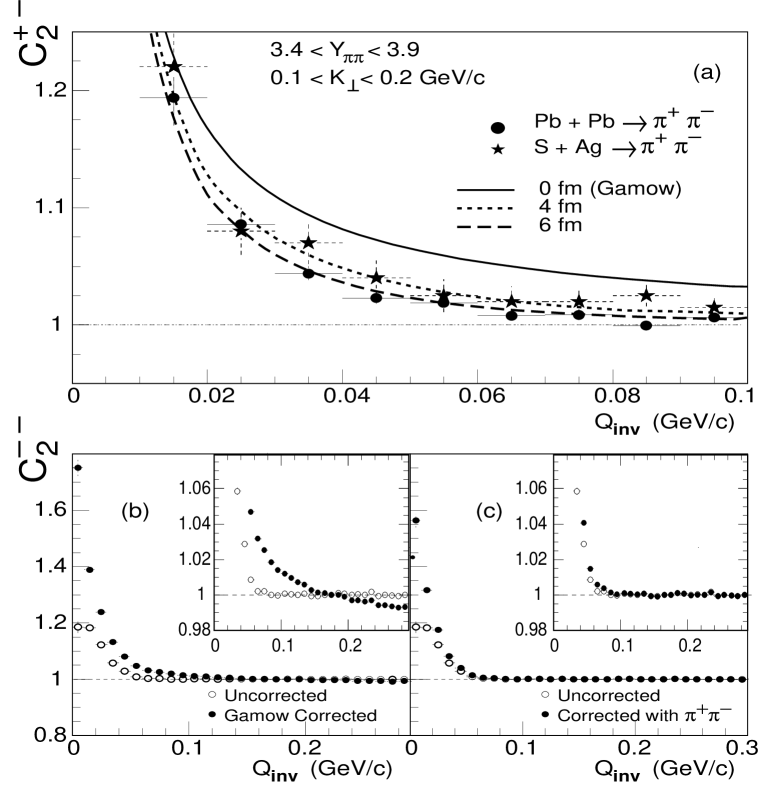
The Coulomb correction for charged pions can be investigated experimentally through measurement of the correlation functions of oppositely charged pairs, where quantum mechanical symmetrization effects do not contribute to the correlation function [20]. Fig. 2, panel (a), shows the correlation function for pairs of oppositely charged pions, obtained from the correlation of oppositely charged hadrons by applying a Monte-Carlo correction for non-pionic contaminations. They are plotted as a function of
| (4) |
near mid-rapidity and for a restricted range for central collisions of S+Ag and Pb+Pb. Also shown is the calculated correlation function for the point-like Gamow function (solid line), and the correlation function due to Coulomb attraction based upon finite source sizes of 4 fm (dotted line) and 6 fm (dashed line), following the approach of Baym and Braun-Munzinger [26]. It is seen that the Coulomb attraction calculated for a point-like source does not describe the measured data, and that the finite source size needs to be taken into account.
Fig. 2, panels (b) and (c), show the measured two-particle correlation function of negative pions, extracted from the negative hadrons with the same procedure mentioned above, as a function of for Pb+Pb collisions, both uncorrected (open circles) and corrected for Coulomb repulsion effects (filled circles). Panel (b) uses the Gamow factor for a point-like source whereas panel (c) employs a parametrisation of the opposite-charge correlation function in panel (a). The two correction procedures generate different correlation functions, both in the peak width at low and in the asymptotic convergence to unity at high . We find that the finite-size correction leads to a constant value of the correlation function at MeV/c (see inset of panel (c)), while the “standard” Gamow correction results in a slope of the correlation function at large and leads to a systematic underestimate of the source parameters for large dense pion sources111 Note that the Gamow function for pairs of like charged particles in a very good approximation is equal to the inverse Gamow function for pairs of unlike charged particles; a slight difference is seen only for MeV/. The same is true also for the model of Baym and Braun-Munzinger [26], independent of the assumed particle source size.. All correlation functions discussed in the remainder of this paper have been corrected for Coulomb repulsion using the finite-size source correction as in Fig. 2, panel (c), obtained from the opposite-charge correlation function.
4 Determination of Source Parameters from Correlation Functions
The data set used for the two particle correlation analysis consists of 80,000 central Pb+Pb events. After tracking quality cuts and non-primary vertex track rejection the average multiplicity for a central Pb+Pb collision within is about 200 negative hadrons. The resulting number of close pairs in this sample enables the analysis of correlation functions in the three relative momentum projections and , in bins in of width 100 MeV/ and bins in pair rapidity of width 0.5, with small statistical error. An independent analysis of the data of VTPC2 and the MTPCs is presented here, with the two data sets overlapping in the region , where the results agree within . In the overlapping region the data was not averaged, but the low rapidity points at are from VTPC2 and the remainder are from the MTPCs. Preliminary results of such a differential analysis of the correlation functions have been presented in [27].
The three dimensional fit to the expression (2) is performed using the maximum likelihood method to fit its five parameters, with the correlation functions evaluated in the Local Centre of Mass System which refers to the mean rapidity in each rapidity bin. Fig. 3 shows a set of projections for a typical correlation function of negative hadrons as a function of and , within and GeV/. Also shown is the result of the fit with the parameters fm, fm and fm. Non Gaussian source functions have been recently proposed, e.g. [28], but we find that a Gaussian source function fits the observed correlation functions at all rapidity and bins very well, as shown in Fig. 3.
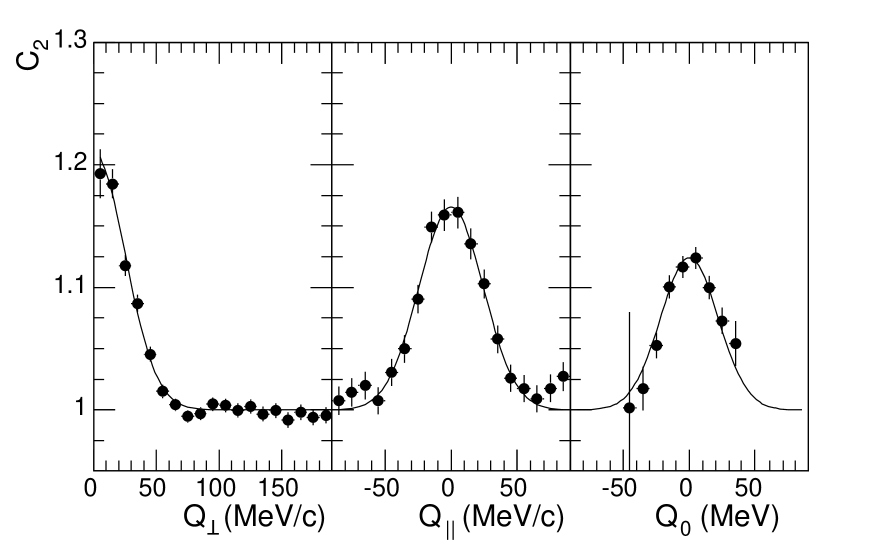
Fig. 4 shows typical fit results for the parameters and as a function of pair rapidity within GeV/ and as a function of within the interval . At mid-rapidity , and peak at 6-7 fm. The source appears to be locally isotropic. At higher rapidities the source parameters are reduced to about 5.5 fm. The parameter , which reflects the duration of emission [8, 22], is approximately constant at fm/c. Previous measurements of in two-particle correlation studies at the SPS with Sulphur beams have yielded very small values of , implying a “sudden” freezeout.
We defer analysis of the correlation intensity parameter to a forthcoming publication but note here that throughout this analysis, in which the pion pair purity is 55%, the fit result for is about 0.45.
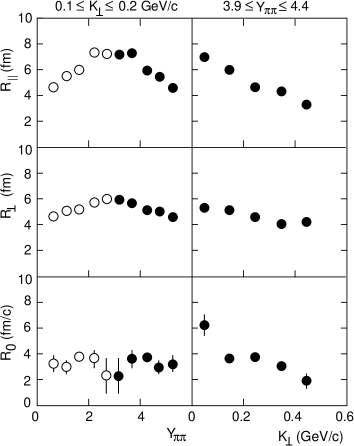
Fig. 5 shows the dependence of the “Yano-Koonin-Podgoretskii” rapidity as a function of pair rapidity for central Pb+Pb collisions. is derived from as
| (5) |
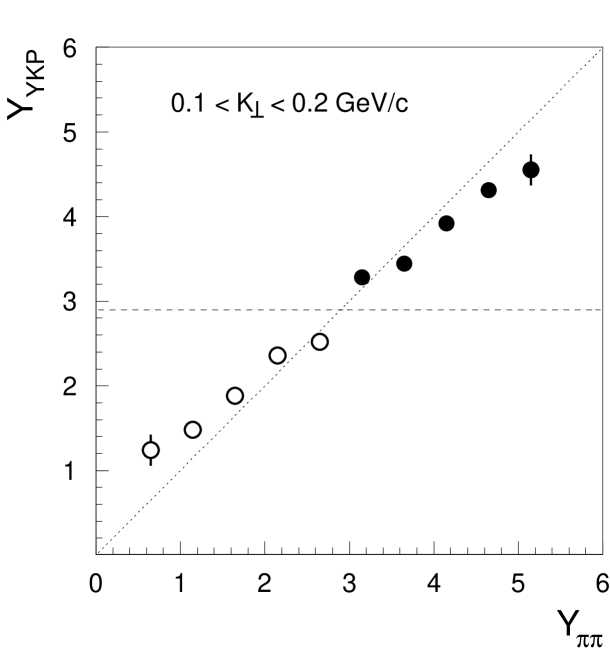
where is determined by fitting expression (2) to the negative hadron two-particle correlation functions in five successive bins of pion pair rapidity . This representation was first used by the GIBS Collaboration [29]. Fig. 5 shows that the rapidity of the local source is strongly correlated with the rapidity of the emitted pion pairs. A non-expanding source would exhibit no correlation, whereas an infinite boost-invariant source would exhibit a strict correlation. The data are consistent with a boost-invariant source, but show some deviation from the boost-invariant scenario at high rapidity, as is expected for a beam of finite energy (). At = 5 the longitudinal expansion velocity is found to be = 0.9.
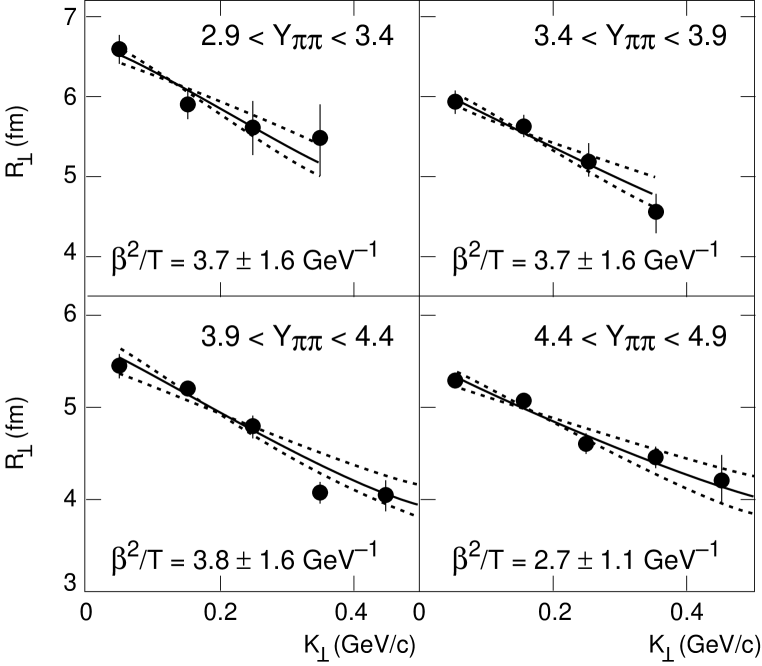
We turn next to an analysis of the transverse source expansion, employing the dependence of on which was predicted by Heinz [22] to be sensitive to the presence and magnitude of a radial velocity field. Fig. 6 shows the dependence of on for four different bins of , where is determined by the fit of (2) to the negative hadron two-particle correlation functions. The solid line is the result of a fit to the data by the function
| (6) |
This expression was derived by Heinz [8] in a model with longitudinal and transverse expansion, under the assumption that the radial profile of the transverse velocity is given by , where is the geometrical RMS radius of a Gaussian approximation to the one dimensional transverse projection of the source density profile at freezeout, and is the distance from the centre 222In [28] one notices that is replaced by a transverse rapidity in order to be valid in the relativistic regime. In the domain of we find in this study the differences between the two is of the order of our systematic error.. The fit parameters are and the ratio with T the freezeout temperature. The dotted lines in Fig. 6 show equation (6) with parameters one standard deviation away from those at minimum . The data in the three lowest rapidity bins are best described with a common set of fit parameters: fm and GeV-1. At forward rapidity both parameters decrease, indicating that the pion emitting source is ellipsoidal in shape. We note here that the effect of long lived resonance decays on the dependence is ignored in the model leading to (6). Wiedemann and Heinz [28] have shown, however, that this effect, in itself produces a slope of with which leads to a relatively small apparent value of GeV-1 if (6) is used to fit the slope.
5 Discussion of Source Parameters
The fit of equation (6) to the dependence of in Fig. 6 fixes the genuinely geometric transverse source radius fm near mid-rapidity. In order to assess this result we recall the geometrical aspects of a Pb+Pb collision. We start from the 208Pb Woods-Saxon density distribution of radius Pb) = 1.15fm = 6.8 fm. In an ideal zero impact parameter collision the primordial participant baryons would be positioned in a cylindrical volume of this dimension. However the NA49 trigger for central events selects a mean impact parameter of about 2 fm [2], resulting in a slight reduction of the azimuthally averaged radius, to about fm. It is important, however, to consider next the transverse density distribution in the primordial source. Right after interpenetration, before significant transverse expansion has occurred, this is a longitudinal cylinder. The transverse density profile is obtained by projecting the two spherically uniform nucleon distributions onto a plane perpendicular to the beam () axis. In order to compare to the geometrical source parameter obtained from the correlation analysis, we recall that the transverse radius = 6.5 fm refers to a projection of the density profile of the cylinder onto one transverse dimension () only. Applying this projection also to the primordial source cylinder, we obtain a nearly Gaussian density profile. Overall, the two projections transform the shape of two uniform spheres (where the radius is identical to the “surface”) to approximately a Gaussian, with RMS radius smaller by than the initial sphere radius. I.e. in the terminology employed for the source at freezeout, with RMS radius = 6.5 fm as obtained above, the primordial source has an RMS radius of fm = 2.7 fm. The source thus expands by a factor of about 2.4 between initial maximum energy density, and final hadronic decoupling. If it is assumed that the hadronic transverse expansion velocity at the RMS radius position is (see below), the system requires a Gaussian mean expansion time of about = 8 fm/.
The dependence of the source radius parameters shown in Fig. 4 exhibits a steep decrease in and a shallower decrease of . The duration-of-emission parameter stays roughly constant with perhaps some indication of a decrease at high . Heinz [8] has provided an estimate of in the framework of the same source model that leads to the estimate of employed above (equation (6)):
| (7) |
where is the overall time of expansion, is the freezeout temperature which we take as 120 MeV and is the width of the source in space-time rapidity which we take to be 1.3 (see bellow). We obtain fm/ near mid-rapidity, decreasing slightly to fm/ at high rapidity. Note that the overall expansion time of the system can be longer than the interval during which hadrons decouple (freeze out) from the source (the duration of the emission); indeed we observe that , where is seen in Fig. 4 to be 3-4 fm/. Recalling the Gaussian parametrization of the correlation functions, the temporal emission pattern of the hadronic fireball can thus be pictured as a Gaussian with mean fm/ and fm/. This is consistent with our above estimate of , the net duration of transverse expansion. The emission of pions fades away at about 3, i.e. after 8 + 33.5 fm/ 18 fm/.
6 Transverse Expansion and Single Particle Spectra
The dependence of extracted from the two-particle correlation data and the fits using equation (6) were shown in Fig. 6 for four rapidity bins. The first three rapidity bins are best described with a common set of parameters, fm and GeV-1. Because the fit parameter is a ratio, there is an ambiguity in the transverse velocity and freezeout temperature , ranging from = 0.86 at = 200 MeV to = 0.61 at = 100 MeV (see Fig. 7). The implied average transverse energy of a single pion varies dramatically over this domain. We remove this () ambiguity and enforce transverse energy conservation by fitting the NA49 transverse mass spectra [16] within the same model.
It has been shown [15, 18, 30, 31] that the spectra of pions and heavier hadrons in Pb+Pb collisions are consistent with the assumption of a radial velocity field. We employ here a parametrization given by Chapman et al. [32] to fit the single particle transverse mass distribution for central Pb+Pb collisions. It refers to the space-time source function [8] as was employed in our above analysis of pion correlations (equation (6). The single particle distributions in this case can be approximated by the expression
| (8) | |||
where
| (9) |
As already mentioned above in the context of equation (6), the model’s parameters are the temperature , the transverse geometrical source radius , the transverse expansion velocity at the distance and the width of the source in the space-time rapidity. The latter is related to the width of the rapidity distribution by
| (10) |
For negative hadrons in a realistic temperature range from 80 to 180 MeV, and GeV giving .
The fit results in again an ambiguous set of solutions with regard to and , but now with a different constraint than the two pion correlation, namely the observed mean transverse momentum. For negative hadrons at mid-rapidity we thus obtain “true” temperatures at freezeout ranging from MeV at to MeV at .
The allowed regions in the plane of freezeout temperature versus transverse surface velocity that result both from the correlation and spectral analysis of negative hadrons are shown in Fig. 7. Overlayed on the same figure is the analogous region of allowed versus obtained by NA49 from the measured transverse mass spectrum of deuterons [33] which were identified by dE/dx and time-of-flight. The contribution of the background under the deuteron peak was determined in small bins of total and transverse momentum [34] and has been subtracted. The bands shown correspond to a one variation from the best fit values taking into account the systematic errors. For negative hadrons the choice of the fit interval gives a contribution to the systematic error which accounts for half of the width of the band, for the deuterons this is negligible. A similar analysis of (more preliminary) NA49 data was carried out by Kämpfer [35].
All data employed in Fig. 7 refer to a rapidity domain about 0.6 units away from mid-rapidity. The negative hadron spectra and correlation data refer to , the deuteron spectra to (kinematically equivalent relative to = 2.9). The details of the analysis of hadronic spectra will be given in a forthcoming publication [33].
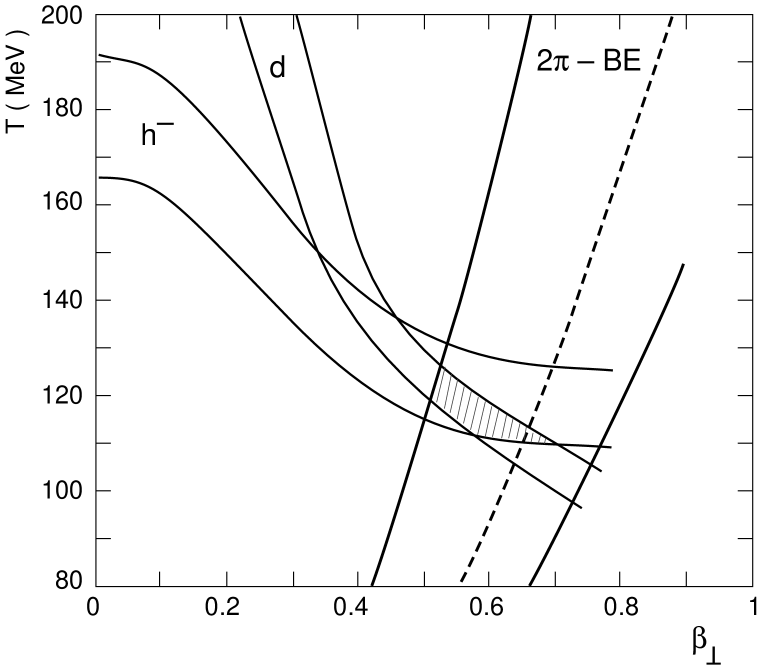
From Fig. 7 we see that the three independent results favour a narrowly defined overlap region, MeV and . The errors given here contain an estimate of the systematic error of the negative hadron and deuteron spectral data included in the width of the bands in Fig. 7. The remaining systematic error from the correlation data was estimated to be negligible for T and to be about (+0.02, -0.05) for . No correction has been made for the decay of long-lived resonances. However the deuteron data should be fairly free of such effects, and Heinz has shown [22] that the dependence of is only weakly affected by this at the relatively high radial velocity extracted here.
7 Conclusions
We have carried out a high statistics analysis of Bose Einstein correlations of negative pions in central Pb+Pb collisions at 158 GeV per nucleon, which has allowed a differential study of the dependence of the correlation function on the pair kinematic variables, in small bins of rapidity and transverse momentum of the pair. The correlation between opposite-charge hadrons measured simultaneously in the same apparatus is used to experimentally determine the Coulomb correction, a method that is shown to be superior to the correction with the standard Gamow factor.
The representation of the correlation function derived by Heinz [8, 22] which is most suitable for a source with longitudinal collective motion is employed to extract the parameters for an expanding source. The five fitted parameters and are functions of the pair rapidity and transverse momentum . The duration of emission given by is 3 to 4 fm/c showing that there is a finite duration of the hadronic freezeout. It is nevertheless small and not consistent with a long duration of a mixed (hadronic-partonic) phase implied by a strong first order phase transition [7]. This statement might have to be modified in a scenario with significant source expansion before hadronization as was pointed out already by Pratt [7]. The rapidity dependence of is found to correspond to a source with large longitudinal expansion, close to the boost-invariant limit.
We then employ a model which contains longitudinal and transverse expansion [8] to extract information about the transverse dynamics of the source from the and dependence of the transverse radius . The results correspond to a source with a Gaussian radius fm, which is a factor of 2.4 larger than the initial transverse RMS radius of the high density zone. The transverse dynamics are indicated by the parameter GeV-1, which however cannot fix the transverse velocity and the temperature of the system independently. The use of the transverse momentum spectra of deuterons and negative hadrons give further constraints fixing MeV and .
With the temperature of the source fixed, the rapidity dependence of gives the overall expansion time fm/c. This agrees with the expansion time needed for the system to grow transversely by a factor of 2.4 with a transverse velocity = 0.55, showing the consistency of the results of the longitudinal and transverse expansion modes.
The observation of longitudinal expansion is not unique to central
nuclear collisions, and
follows from the longitudinal dynamics of incompletely stopped
partons and the decay of their “strings” predominantly ordered in beam
direction [36].
However, no trivial explanation is at hand for the origin(s) of the large
transverse collective velocity field. It may arise from the combined
effects of the initial hadronic and partonic scattering cascades [37]
(in the extreme case from the transverse expansion of a
QCD partonic state prior to hadronization),
or from an isentropic expansion of the tightly packed hadrons
following hadronization, that either generates a radially ordered velocity
field, or enhances such an initial field if it exists already at
hadronization [13, 14].
Acknowledgements: This work was supported by the Director, Office of Energy Research, Division of Nuclear Physics of the Office of High Energy and Nuclear Physics of the US Department of Energy under Contract DE-ACO3-76SFOOO98, the US National Science Foundation, the Bundesministerium fur Bildung und Forschung, Germany, the Alexander von Humboldt Foundation, the UK Engineering and Physical Sciences Research Council, the Polish State Committee for Scientific Research (2 P03B 01912), the EC Marie Curie Foundation, the Polish-German Foundation and the Hungarian Scientific Research Foundation under the contracts T1492 and T7330.
References
- [1] E. Laermann, Nucl. Phys. A610 (1996) 1c, and references therein.
- [2] T. Alber et al., NA49 Collaboration, Phys. Rev. Lett. 75 (1995) 3814.
- [3] G. Goldhaber, S. Goldhaber, W. Lee and A. Pais, Phys. Rev. 120 (1960) 300; G. Cocconi, Phys. Lett. 49B (1974) 459.
- [4] E.V.Shuryak, Phys. Rep. 61 No.2 (1980) 72.
- [5] J. D. Bjorken, Phys. Rev. D27 (1983) 140.
- [6] A. N. Makhlin and Y. M. Sinyukov, Z. Phys. C39 (1988) 69; Y. M. Sinyukov, Nucl. Phys. A498 (1989) 151.
- [7] G. F. Bertsch, Nucl. Phys. A498 (1989) 173; S. Pratt, T. Csörgö and J. Zimanyi, Phys. Rev. C42 (1990) 2646; S. Pratt, Phys. Rev. D33 (1986) 1314.
- [8] U. Heinz et al., Phys. Lett. B382 (1996) 181; S. Chapman, J. R. Nix and U. Heinz, Phys. Rev. C52 (1995) 2694.
- [9] T. Alber et al., NA35 Collaboration, Phys. Rev. Lett. 74 (1995) 1303; T. Alber et al., NA35 Collaboration, Z. Phys. C66 (1995) 77.
- [10] A. Franz et al., NA44 Collaboration, Nucl. Phys. A610 (1996) 240c, and references therein.
- [11] J. Bächler et al., NA35 Collaboration, Z. Phys. C52 (1991) 239.
- [12] E. Schnedermann, J. Sollfrank and U. Heinz, Phys. Rev. C48 (1993) 2462.
- [13] D. Ferenc, Nucl. Phys. A610 (1996) 523c.
- [14] M. Herrmann and G.F. Bertsch, Phys. Rev. C51 (1995) 328.
- [15] I. G. Bearden et al., NA44 Collaboration, Nucl. Phys. A610 (1996) 175c.
- [16] S. V. Afanasiev et al., NA49 Collaboration, Nucl. Phys. A610 (1996) 188c.
- [17] R. Hagedorn Riv. Nuov. Cimento 6 No.10 (1983) 1.
- [18] J. Dodd et al., NA44 Collaboration, Nucl. Phys. A590 (1995) 523.
- [19] J. Sollfrank, M. Gazdzicki, U. Heinz and J. Rafelski, Z. Phys. C61 (1994) 659, and references therein.
- [20] T. Alber et al., NA35 Collaboration, Z. Phys. C73 (1997) 443.
- [21] F. B. Yano and S. E. Koonin, Phys. Lett. B78 (1978) 556; M. I. Podgoretskii, Sov. J. Nucl. Phys. 37 (1983) 272.
- [22] U. Heinz, Nucl. Phys. A610 (1996) 264c.
- [23] H. Appelshäuser, PhD thesis Frankfurt 1997; S. Schönfelder, PhD thesis, MPI Munich 1997 (MPI-PhE/97-09).
- [24] K. Werner, Phys. Rev. D 39 (1989) 780; Z. Phys. C 42 (1989) 85.
- [25] R. Brun, et al., GEANT 3.15 CERN user’s manual.
- [26] G. Baym and P. Braun-Munzinger, Nucl. Phys. A610 (1996) 286c.
- [27] K. Kadija, NA49 Collaboration, Nucl. Phys. A610 (1996) 248c.
- [28] U. Wiedemann and U. Heinz, Phys. Rev. C56 (1997) R610.
- [29] M. Kh. Anikina et al., GIBS Collaboration, Phys. Lett. B397 (1997) 30.
- [30] P. Braun-Munzinger, J. Stachel, J. P. Wessels and N. Xu, Phys. Lett. B344 (1995) 43; Phys. Lett. B365 (1996) 1.
- [31] I. G. Bearden et al., NA44 Collaboration, Phys. Rev. Lett. 78 (1997) 2080.
- [32] S. Chapman, P. Scotto and U. Heinz, Heavy Ion Physics 1 (1995) 1.
- [33] NA49 Collaboration, to be published.
- [34] C. Struck, Diplom thesis Marburg 1997.
- [35] B. Kämpfer, Rossendorf preprint FZR-149 (1996).
- [36] F. Becattini, M. Gaździcki and J. Sollfrank, hep-ph/9710529, to be published in Z. Phys. C.
- [37] K. Geiger and D. K. Srivastava, preprint nucl-th/9706002.