CPT-2004/P.067
BU-HEP 04-15
Light hadron spectra and wave functions in quenched QCD with overlap quarks
on a large lattice††thanks: Work supported in part by US DOE
grants DE-FG02-91ER40676 and DE-AC02-98CH10866, EU contracts
HPRN-CT-2000-00145 and HPRN-CT-2002-00311, and grant
HPMF-CT-2001-01468. We thank Boston University and NCSA for use of
their supercomputer facilities.††thanks: Combined presentations by
J. Howard, L. Lellouch and C. Rebbi at Lattice 2004, FNAL, USA.
Abstract
A simulation of quenched QCD with the overlap Dirac operator has been completed using 100 Wilson gauge configurations at on an lattice. We present results for meson and baryon masses, meson final state “wave functions” and other observables.
1 Simulation Details
We have studied quenched QCD on an lattice, with the Wilson gauge action at and with Neuberger’s overlap Dirac operator for lattice fermions. We used a sample of 100 gauge configurations separated by 10,000 upgrades of a 6-hit Metropolis algorithm (acceptance ). A previous preliminary analysis [1] used the first 60 quark propagators that were produced; results presented here include all 100 quark propagators. We refer to [1] and the references therein for more background information and details of the overlap operator used. New results include the vector meson spectrum, the use of extended sink operators in constructing meson correlation functions, and observation of quenched chiral logs. Results for kaon weak matrix elements are presented in a separate contribution [2].
From Wilson loops, we obtained for the Sommer scale defined by , .
We calculated overlap quark propagators for a single point source, for all 12 color-spin combinations and quark masses , using a multi-mass solver.
The Zolotarev approximation with 12 poles was used for the first 55 configurations. For the remaining 45 configurations, the Chebyshev approximation (degree ) was used, after Ritz projection of the lowest 12 eigenvectors of , as it was found to provide about 20% better performance. The convergence criterion used was .
The computations were performed with shared memory F90 code, optimized and run on 16 and 32 processor IBM-p690 nodes at BU and NCSA.
2 Meson Results
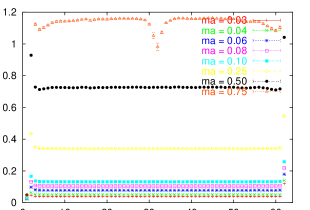
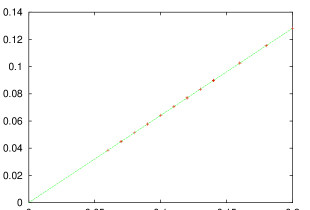
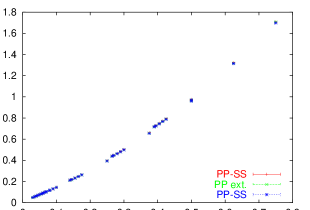
We begin with a verification of the axial Ward identity (AWI) prediction for the ratio
| (1) |
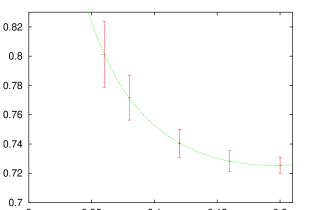
as presented in Fig. 1. The fit to gives , , and , as shown in Fig. 2.
2.1 Meson Spectrum
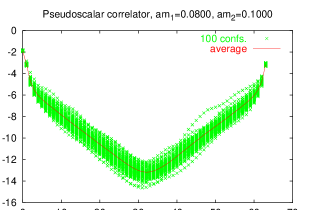
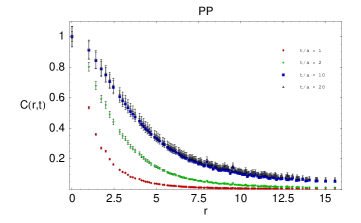
Pseudoscalar density 2-point functions were formed from quark propagators and then fit to the usual cosh form to calculate the ground state mass. An example correlator is shown in Fig. 3, for input quark masses and .
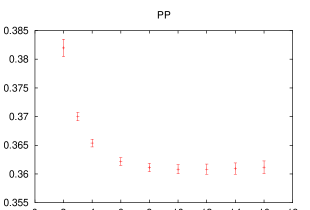
Effective mass plots are often used to determine the fitting window for the correlation function. In some cases (e.g. for vector mesons), determining the best window can be difficult. Therefore, we used a method that scanned the possible windows, and then chose the smallest value of (consistent with the errors) allowed before the clear effect of higher states caused the mass prediction to rise. Use of a cosh fit allowed to be fixed at 32. An example of such a scan is shown in Fig. 4.
The pseudoscalar spectrum for all possible input quark mass combinations is shown in Fig. 5.

2.2 Extended sink operators
Since mesons are not point particles, an increased signal can be obtained by using extended (or smeared) operators at the source and sink [4]. Matrix element calculations required point sources and generating an additional set of propagators with extended sources would have been computationally too costly. Thus we limited our analysis to extended sinks.
The use of extended sinks allowed for a larger fitting window and improved the prediction for mesonic observables. The extended sink correlation function is
| (2) |
where and , and the gauge is fixed to Landau gauge. With , we calculate the quantity shown in Fig. 7. We then use the asymptotic value to define an extended sink correlation function . The functions stabilizes at approximately , representing the meson final state “wave function.”
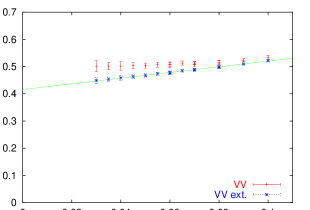
The use of extended sinks was most valuable in the calculation of the vector meson spectrum, due to the increase in the size of the fitting window. The point sink and extended sink vector meson spectra are compared in Fig. 8 for low quark mass, . A fit of the quark-mass dependence of the vector meson mass obtained from the extended sink data gives
| (3) |
2.3 Quenched chiral logs
The sharp rise at low of the ratio of the pseudoscalar mass squared to , which we observe in Fig. 9, can be interpreted as an indication of quenched chiral logs. A value for the quenched chiral log parameter was obtained via a fit to the expression [5], where
| (4) |
and
| (5) |
The resulting value for in the PP-SS channel is .
We fit the degenerate quark mass PP-SS channel results to the expression
| (6) |
where is the PP-SS mass and . The fit is shown in Fig. 9, and the results for the parameters are
| (7) |
consistent with the value of obtained above as well as elsewhere [5, 6, 7]. Note that a fit to in Eq. (6) containing an additional constant term does not change the central values of , , or and produces a value for that is very small and consistent with zero.
3 Baryon Results
In calculating the baryon spectrum, we found that caution is needed in determining an appropriate fitting window for the correlation functions, due to fluctuations at large .
Shown in Fig. 10 are the average baryon propagators for the octet and decuplet, after multiplication by and the mapping . The mapping allows for a clear exposition of the fluctuations.
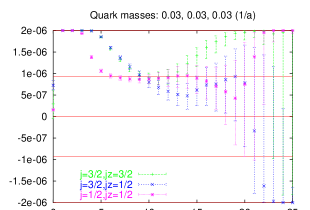
Fig. 11 shows the octet and decuplet baryon masses vs. total quark mass for all quark mass combinations where two of the quarks have the same mass , while the third quark has mass , and for various correlator fitting windows. The sensitivity to the fitting window is apparent. The ultimate fitting window chosen was .
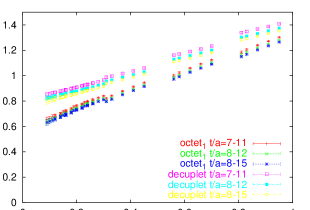
Fig. 12 shows the low quark mass spectrum, with fitting window , for the two octet states
| (8) |
| (9) |
with and . The corresponding correlation functions become identical for , but would describe , -like states, respectively, for .
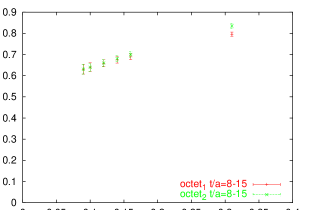
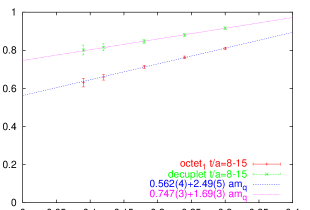
Fig. 13 shows the degenerate quark mass octet and decuplet spectrum for low quark mass () again with fitting window . Extrapolating to the chiral limit we get , , , and correspondingly
| (10) |
| (11) |
while experimentally and .
4 Conclusion
Our results show that use of the overlap formulation is practical, albeit computationally costly, for the calculation of quark propagators on large lattices, and validate the good chiral properties of this discretization. Work in progress includes the evaluation of quark correlation functions in baryon final states and quenched calculations on a lattice at to investigate scaling.
References
- [1] F. Berruto, N. Garron, C. Hoelbling, L. Lellouch, C. Rebbi and N. Shoresh, Nucl. Phys. Proc. Suppl. 129-130, 471 (2004) [arXiv:hep-lat/0310006].
- [2] F. Berruto et al., presentation by L. Lellouch at this conference.
- [3] L. Giusti, C. Hoelbling and C. Rebbi, Phys. Rev. D 64, 114508 (2001) [Erratum-ibid. D 65, 079903 (2002)] [arXiv:hep-lat/0108007].
- [4] S. Hauswirth, arXiv:hep-lat/0204015.
- [5] S. Aoki et al. [CP-PACS Collaboration], Phys. Rev. D 67, 034503 (2003) [arXiv:hep-lat/0206009].
- [6] H. Wittig, Nucl. Phys. Proc. Suppl. 119, 59 (2003) [arXiv:hep-lat/0210025].
- [7] C. Gattringer et al. [BGR Collaboration], Nucl. Phys. B 677, 3 (2004) [arXiv:hep-lat/0307013].