The E917 Collaboration
Antilambda production in Au+Au collisions at 11.7 GeV/
Abstract
We present results from Experiment E917 for antilambda and antiproton production in Au+Au collisions at 11.7 . We have measured invariant spectra and yields for both species in central and peripheral collisions. We find that the / ratio near mid-rapidity increases from in peripheral collisions to in central collisions, a value that is substantially larger than current theoretical estimates.
pacs:
25.75.-q, 13.85.Ni, 21.65.+fEnhanced antimatter and strangeness production have both been proposed as signatures of the phase transition from normal hadronic matter to the quark-gluon plasma (QGP) RafMu82 ; Raf82 ; Koch86 . The yields of strange antibaryons combine both of these signatures in a single production channel, and may prove to be a particularly sensitive probe for the formation of the QGP. Of particular interest is the ratio / RafMu82 , which reflects the relative abundance of quarks to light antiquarks.
However, both and are also produced when the collision does not form a QGP. Hadronic matter with sufficient rescattering can reach a chemical equilibrium containing the full spectrum of hadrons. Equilibrium chemical models of heavy-ion collisions are generally able to reproduce the measured ratios of total yields of particles such as pions and kaons. Such models also predict values for the ratio / in the range 0.15–0.9 at AGS beam energies RafDanos94 ; Bec00 . A thermal model analysis that accounts for the measured K and K-/K+ ratios Welke98 gives a most probable value of / = 1, with unrealistic values yielding an upper limit of 2 for Au+Au collisions.
Hadronic cascade models which explicitly follow the reactions and trajectories of hadrons in the collision zone Stoecker97 ; Bass99 predict values for the / ratio of less than 1. The absorption cross-section for -N processes is not well known at these energies, opening the possibility for differential absorption of the two species to play a role in determining the value of the ratio and its rapidity dependence. However, a study has shown that a reasonable interpretation of this value cannot bring the predictions of cascade models above a ratio of Welke98 . Recent data from E877 on the anti-flow of e877pbar are successfully described by the hadronic cascades that use the normal antiproton annihilation cross-section.
Enhanced antibaryon production may also be due to many-body collisions between pions, e.g. Rap00 ; Greiner00 . The rate of antibaryon production can be estimated from the inverse reaction . Calculations by Rapp Rap00 and Greiner Greiner00 indicate that a significant number of both and may come from these processes, but it is not yet clear how to incorporate these many-body collisions into current hadronic cascade calculations.
In summary, hadronic models with reasonable inputs generally predict . Thus the experimental detection of a / ratio significantly larger than 1 may signal the breakdown of these hadronic models, and possibly the onset of other degrees of freedom in the system. Of particular interest is the centrality dependence of the / ratio, which may discriminate Bleicher99 between the various models attempting to describe antibaryon production: QGP, hadronic scattering, and thermal models. Canonical thermal models should be used in this comparison, since the volume of the emitting system has been shown to affect the ratio of strange to non-strange particles by up to a factor of four Hamieh00 .
There are indications of an abnormally large value of the / ratio from other experiments. Experiment E859 reported a directly measured / ratio of near mid-rapidity in central Si+Au collisions, at a beam energy of 14.6 GSFS . An indirect estimate of (98% C.L.) at y=1.6 for in central Au+Pb collisions was obtained at a beam energy of 11.5 by comparing inclusive antiproton yields from two different experients (E864 and E878) with largely different acceptances E864paper .
In this letter, we present a direct measurement of in Au+Au collisions near mid-rapidity and over an extended range in . We also measure the total spectrum, which includes contributions from both direct production and decay. Using the measurement, we can estimate the contribution to from decay and thus extract the yield of directly produced antiprotons (). We find the ratio to be large in central collisions, and much lower in more peripheral collisions.
The experiment was carried out using the magnetic tracking spectrometer previously employed in AGS experiments E802, E859, and E866 as described in detail in Refs. nim ; Chen98 ; kpkm ; Back99 . An efficient second-level trigger was used in order to study the production of rare particles such as antiprotons. A 197Au beam with momentum 11.7 was incident on a 1-g/cm2 thick Au target. The movable spectrometer subtended polar angles from to . Magnetic field settings of T were used, for which the momentum resolution of the spectrometer, , ranges from 1% to 2%. At these angle and field settings, we have acceptance for and in the rapidity range , where mid-rapidity is at this beam energy. Particle identification is based on the measured momentum combined with a time-of-flight (TOF) wall with a resolution of 135 ps situated 6 m from the target.
We define centrality classes based on the fraction of the total interaction cross-section ( Geer95 ). Using the total kinetic energy of spectator particles measured in a zero-degree calorimeter, the data were divided into two centrality classes, called “Central” and “Peripheral”, containing and of , respectively. We also report a “Minimum Bias” data set without centrality cuts.
The reconstruction, particle identification and tracking algorithms have been described in detail elsewhere kpkm . Antiprotons are accepted up to momentum , above which the identification bands of the K- and time of flight spectrum begin to overlap. A lower momentum cutoff of was necessitated by hadronic interaction rates in the spectrometer material. Pions used to reconstruct ’s were required to have momenta between 0.35–1.8 .
A firm understanding of the background in the TOF-identified sample is required for the measurement of the spectrum. Spectra of the time-of-flight residuals were created in order to estimate these backgrounds in the sample. Here and are the measured and expected flight times of ’s to the TOF wall, and is a particle-by-particle estimate of the timing resolution based on the TOF wall resolution combined with a Monte Carlo simulation of the tracking in the spectrometer. The distributions are parameterized by a Gaussian for the true signal and a background with two components: an exponentially falling contribution from the tails of K- and bands, and a flat random contribution due to misidentified particles. The backgrounds extracted range from 15% to 75% of the total signal, with the largest backgrounds at the extremes of the momentum ranges. Rapidity-transverse mass bins for which the background fraction exceeds 50% have been excluded from further analysis.
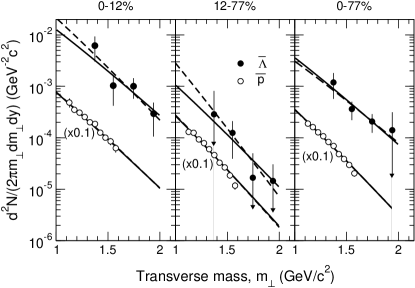
The counting statistics in determining the background are included in the reported statistical error bars. We estimate an additional systematic error in the extracted yield due to background corrections and acceptance uncertainties to be 10%, and the error in the inverse slope, arising mostly from acceptance uncertainties, to be 5%. The measured invariant spectra are shown as open circles in Fig. 1 as a function of transverse mass (), along with independent fits (dashed lines) of a Boltzmann form, , i.e.
The parameters of the fit to the total spectra (, ) are given in columns two and three of Table 1. These spectra include contributions from both direct production () and anti-hyperon decay (), which we now consider.
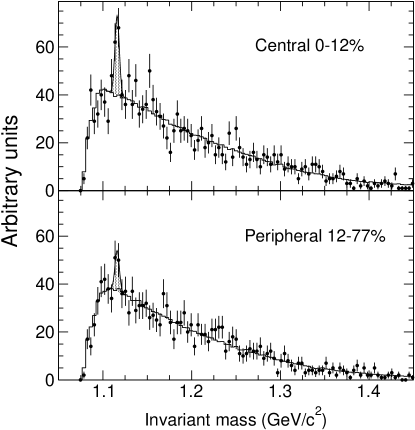
We reconstruct ’s through direct measurement of pairs. This decay channel has a branching ratio of 63.9% PDB . The spectrum of reconstructed invariant mass for accepted pairs is shown in Fig. 2. The experimental resolution for reconstructing ’s is found by initially reconstructing the invariant mass spectrum in the same data set. The peak of the spectrum is found to be at , consistent with the accepted value of . The Gaussian width of the peak is , which is attributable to experimental resolution. To define candidates, a cut of is taken around the nominal . To estimate the background under the peak, we have constructed a mixed-event background, shown as the solid histogram in Fig. 2. Pairs are constructed by selecting random ’s and ’s from the set of all pairs in the centrality class being considered. The background is normalized to the region outside the peak, defined as more than from . Both real and mixed pairs were included only if their opening angle was greater than 15 mrad. This removes most of the inefficiency for detecting close tracks. The remaining two-track inefficiency is estimated by comparison with the mixed-event sample. The correction is then applied on a pair-by-pair basis in generating the background invariant mass spectrum as well as to the signal’s final spectra. This correction has less than a 5% effect on the yields.
We further correct the estimated background for the residual correlations arising from the presence of particles from signal pairs in the mixed-event background. Pairs in the mixed-event background with a member that came from the signal region are assigned a weight equal to the background fraction. This must be done in an iterative fashion; four iterations are sufficient to attain convergence. This correction increases the extracted yields by approximately 15%. From the small remaining discrepancy between the shape of the mixed-event sample and the actual sample, we estimate the systematic error on the measured yield arising from background subtraction to be 15%. The invariant spectra are shown as solid circles in Fig. 1 as a function of transverse mass in all centrality classes.
Since the spectra have a strong contribution from decays, it is advantageous to perform a simultaneous fit to both spectra, in order to obtain the most accurate measure of the / ratio. We have used a Monte Carlo study to parameterize the distribution of ’s originating from decay, as a function of the characteristics of the original spectrum. For a spectrum of Boltzmann form with inverse slopes in the range , we find that the resulting spectrum of ’s within the E917 spectrometer is also Boltzmann in shape, with parameters:
The errors reflect the quality of the Boltzmann fits to the spectra, and result in a negligible systematic error to the final results.
The and transverse mass spectra were therefore fit simultaneously using the functions
From these fits, shown in Fig. 1, we obtain values of the four free parameters , , , and , listed in Table 1. The / ratio and yield obtained in this manner are consistent with those obtained from separate fits to the and spectra, but the precision of the simultaneous fitting method is superior due to the additional constraint on the inverse slope provided by the shape of the spectrum.
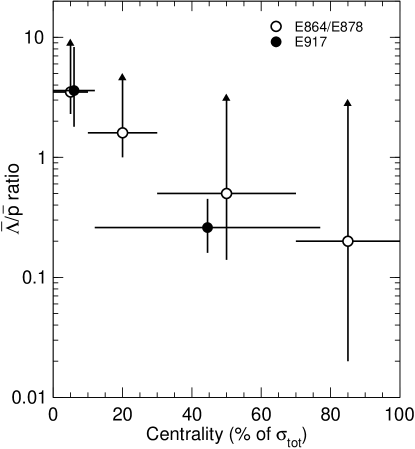
In summary, we have made a direct measurement of production in Au+Au collisions at the AGS. We find that the production increases sharply with centrality, from in peripheral collisions to in central collisions. The total production is of comparable magnitude to the yield, with a substantial fraction of the measured signal attributable to decay products from the .
We find that the ratio / near mid-rapidity increases from in peripheral collisions to in central collisions. When combined with the prior observations of elevated ratios in central Si+Au collisions GSFS and the indirect evidence from experiments E864 and E878 E864paper , the present results indicate that production is larger than direct production in central collisions—and not in peripheral collisions—at AGS beam energies. This effect is clearly shown in Fig. 3. The mechanism responsible for the large / ratio is currently unknown.
Acknowledgements.
This work is supported by the U.S. Department of Energy under contracts with ANL (No. W-31-109-ENG-38), BNL (No. DE-AC02-98CH10886), MIT (No. DE-AC02-76ER03069), UC Riverside (No. DE-FG03-86ER40271), UIC (No. DE-FG02-94ER40865) and the University of Maryland (No. DE-FG02-93ER40802), the National Science Foundation under contract with the University of Rochester (No. PHY-9722606), and the Ministry of Education and KOSEF (No. 951-0202-032-2) in Korea.References
- (1) J. Rafelski, B. Mueller, Phys. Rev. Lett. 48 1066 (1982), erratum Phys. Rev. Lett. 56 2334 (1982).
- (2) J. Rafelski, Phys. Rep. 88 331 (1982).
- (3) P. Koch, B. Mueller, J. Rafelski, Phys. Rep. 142 167 (1986).
- (4) J. Rafelski, M. Danos, Phys. Rev. C 50 1684 (1994).
- (5) F. Becattini et al., hep-ph/0002267; The / ratio is estimated here by assuming the calculated yield of lambda equals the calculated yield of K+, multiplying quoted ratios, and correcting for feed-down.
- (6) G.J. Wang, G. Welke, R. Bellwied, and C. Pruneau, Advances in Nuclear Dynamics 4, Plenum Press, 1998, eds. W. Bauer and H. G. Ritter, pp. 369-378; nucl-th/9807036.
- (7) Exact values for the /direct ratio at AGS energies predicted by transport models have not been published. Review articles on transport models Bass99 state that the models underpredict by a factor of three to five the measured Si + Au ratio of /.
- (8) S. Bass et al., J. Phys. G 25 R1 (1999).
- (9) J. Barrette et al., E877 Collaboration, Phys. Lett. B485 319 (2000).
- (10) R. Rapp and E. Shuryak, hep-ph/0008326.
- (11) C. Greiner and S. Leupold, nucl-th/0009036.
- (12) M. Bleicher et al., Phys. Rev. C 59 R1844 (1999).
- (13) S. Hamieh et al., Phys. Lett. B486, 61 (2000).
- (14) G.S.F. Stephans for E859 Collaboration, J. Phys. G: Nucl. Part. Phys. 23 1895 (1997).
- (15) T.A. Armstrong et al., E864 Collaboration, Phys. Rev. C 59 2699 (1999).
- (16) T. Abbott et al., Nucl. Instrum. Methods A290 41 (1990).
- (17) L. Ahle et al., E866 Collaboration, Phys. Rev. C 57 466 (1998).
- (18) L. Ahle et al., E866 Collaboration, Phys. Rev. C 58 3523 (1998).
- (19) L. Ahle et al., E866 and E917 Collaborations, Phys. Lett. B. 476 (2000).
- (20) L.Y. Geer et al., Phys. Rev. C 52 334 (1995).
- (21) Particle Data Book, European Physical Journal C15 1 (2000).
| Bin | ||||||
|---|---|---|---|---|---|---|
| () | (GeV) | (GeV) | () | (GeV) | ||
| 0-12% | 0.23 | 19 | 0.22 | 3.6 | ||
| 12-77% | 0.18 | 1.2 | 0.19 | 0.26 | ||
| 0-77% | 0.183 | 5.3 | 0.218 | 1.3 |