Response of CsI(Tl) scintillators over a large range in energy and atomic number of ions (Part II): calibration and identification in the INDRA array
Abstract
The light output of the 324 CsI(Tl) scintillators of INDRA has been measured over a large range both in energy: AMeV and in atomic number of incident ions: . An analytical expression for the nonlinear total light response as a function of the energy and the identity of the ion is proposed. It depends on four parameters. For three of them, connected to CsI(Tl) intrinsic characteristics, recommended fixed values are proposed. They are issued from the comparative study of the forward scintillators of INDRA, based on intermediate mass fragment data. The fourth one, related to light collection and to the gain of the associated photomultiplier, is particular and may be accurately obtained afterwards, from light charged particle data. Two applications are presented: fragment identification in telescopes using a CsI(Tl) crystal as residual energy detector and the scintillator energy calibration. The results are successfully confronted to heavy fragment experimental data.
keywords:
PACS number: 29.40.Mc, 32.50.+d(light response of CsI(Tl) to heavy ions, quenching, delta rays)
, , , , , , , , , , , , , , , , , , , , , , , , , , , , , , , , , , , , , , , , , , , , , , , , ,
1 Introduction
INDRA is a 4 axially symmetrical array for the detection of light and heavy charged nuclear reaction products [1, 2] covering huge dynamic ranges, both in energy (from 1 MeV to the maximum available energy 6 GeV at GANIL) and in atomic number (from proton to uranium). It has a high granularity and a shell structure, consisting of several detection layers. For the last layer, which should stop all particles and fragments produced using GANIL beams, thallium-activated caesium iodide scintillators (CsI(Tl)) coupled to photomultiplier tubes were chosen.
The standard calibration procedure for CsI(Tl) is to find a function depending on the energy, but also on the identity of the particle, which describes reasonably well the induced scintillation . The parameters of this function are determined by a global fit procedure which simultaneousely compares the calculated scintillator response to the experimental one for all particles and fragments of well known energies. Afterwards, the unknown energies of the reaction products detected in physical runs are found by means of the calibration function and the related parameters, starting from the measured associated light outputs. Once this is accomplished, one may get a reference map for the identification of the reaction products in a two-dimensional plot showing the energy deposited in the preceding detection layer, for every fragment punching through, versus the total light from the CsI(Tl) crystal. This is the second aim of our work.
For the forward angles of INDRA (3∘ 45∘, rings 2 - 9), the detection layers which precede the scintillators consists of gas ionisation chambers (ICs) and 300 m silicon detectors. The Si detectors have allowed an accurate determination of the residual energy - as presented in subsection 2.2 - for the whole range of fragments passing through and stopped in the scintillators. Thus, there is a tremendous set of data which has facilitated a detailed study of the CsI(Tl) crystal light response, having led to a convenient expression which describes the total scintillation.
Both components of the procedure, measured scintillation and its modelling function, have implied special processing. In the case of INDRA, neither the amplitude of the CsI(Tl) associated signals nor the integral of these signals are measured. Instead, fractions of the total signal are integrated into two time gates, allowing particle identification. Both integrals have rather complex dependences versus the incident particle energy as compared to the whole integral. It is possible to accurately find the latter quantity by software, starting from the two measured signal fractions, as shown in sections 2 and 3.
The exact expression of the total light output of a CsI(Tl) crystal, as predicted by the recombination and nuclear quenching model (RNQM) [3], implies a numerical integration over the energy and this fact is prohibitive for application purposes. Under suitable approximations, the integration may be however analytically performed and a very easily to handle light response expression is deduced. Starting from intermediate mass fragments of known energies, the 3 or 4 involved parameters are determined. Except for the gain parameter, proper to each scintillator crystal and corresponding electronic chain, the values of the other associated fit parameters are fixed, as being connected to intrinsic CsI(Tl) crystal properties. Procedures for fragment identification in a telescope-type map, with the scintillator as residual energy detector, as well as for the energy calibration of the latter one - in the whole dynamic range - are developed and critically analyzed in section 4, containing the RNQM applications.
For the backward angles of INDRA (45∘ 176∘, rings 10 - 17), the scintillators are preceded only by ionization chambers. The calibration of the scintillators leans on the above mentioned light response expression and the CsI(Tl) characteristic parameter values, found at forward angles; the individual gain parameter is determined by means of light charged particle and eventually light fragment data. The calibration so found allows to safely extrapolate the charge identification in a map to regions where no ridge lines are visible because of very low statistics, improving then both charge and energy determination for heavy fragments () detected beyond with INDRA. Details are given in section 4.
Our findings are summarized in section 5.
Notation and values of physical constants and variables used in this paper. See also those in the preceding paper [3].
| Symbol∗ | Definition | Units or Value |
|---|---|---|
| Experimental light output and related variables | ||
| time | s | |
| signal at the last dynode of the CsI(Tl) photomultiplier (PMT) | a.u. s-1 | |
| integral charge of the fast component of the signal | a.u. | |
| decay time constant of the fast component | s | |
| integral charge of the slow component of the signal | a.u. | |
| decay time constant of the slow component | s | |
| integral charge corresponding to the whole signal | a.u. | |
| measured signal at the output of the PMT anodic circuit | a.u. s-1 | |
| approximate total integrated charge experimental light output | a.u. | |
| decay time constant | s | |
| lower value of the decay time constant | s | |
| rise time constant at output of the PMT | s | |
| experimental charge integrated in the “fast” gate | a.u. | |
| experimental charge integrated in the “slow” gate | a.u. | |
| Calculated light output and related variables | ||
| constants in the approximative expressions of | a.u. | |
| gain fit parameter in the friendly analytical expression of L | a.u. | |
| quenching fit parameter in the friendly analytical expression of L | a.u. | |
| fit parameter in the friendly analytical expression of L | MeV | |
| fractional energy loss transferred to a - ray, a fit parameter in the friendly analytical expression of L | ||
| light collection factor | a.u. | |
| PMT gain factor | a.u. | |
∗Most of the notations of the original references have been kept.
2 The thallium-activated caesium iodide scintillators
2.1 CsI(Tl) crystals of INDRA and associated electronics
There are 324 CsI(Tl) crystals in all, with thicknesses ranging between 138 mm and 50 mm from forward to backward angles [1]. All the crystals belonging to one ring have identical shape and size. Because the light output of the CsI(Tl) crystals critically depends on the temperature [4, 5], a water cooling system stabilizes at 20∘C the temperature in the mechanical supports of the CsI(Tl). The CsI(Tl) crystals are coupled to photomultipliers tubes (PMT) [1]. The use of PMTs provides lower energy thresholds for mass identification as compared to those obtained with photodiodes [6]. The stability control of the scintillators is ensured by optically connecting them to a laser system [1], which makes use of a nitrogen laser [7], emitting in the ultraviolet (UV) band, and CsI(Tl) light distributors. The CsI(Tl) PMT signals are fed in 24 input VXI bus modules containing the processing functions. Each channel comprises a constant fraction discriminator, two integrators for “fast” and “slow” parts with accompanying delay and gate generators. The analog to digital conversion is performed by two multiplexed 12 bit converters. Exhaustive descriptions of the CsI(Tl), PMT and associated electronics, as well as of the data acquisition and triggering system are given in [1, 2]. We are doing here only a short presentation, stressing those details which are necessary to make comprehensible the procedures concerning the CsI(Tl) energy calibration and the fragment identification in the IC – CsI(Tl) maps of the backward rings. For energy calibration purpose, rings 10 – 17 were each equipped with a single two-element telescope (80 m and 2 mm thick silicon detectors) - which will be referred to as the calibration telescope (CT). The CT covers part of one of the CsI(Tl) crystals in each backward ring.
2.2 Calculation of the deposited energy into the scintillators
For rings 2 - 9, the calculation of the energy deposited into the CsI(Tl) crystal to which a given light output corresponds - - is based on the energy lost in the preceding layer of a detection cell of INDRA, using the nominal thickness of each silicon detector (m). The silicon detectors were carefully calibrated taking into account the pulse height defect, with an absolute accuracy of . [8]. However, the relative accuracy - between different ions up to Xe and for different energies up to 80 AMeV - is within . For ions as light as Boron, the consequent relative accuracy for the residual energy in CsI(Tl) crystal is at 50 AMeV, at 25 AMeV and at 5 AMeV. For ions as heavy as Xenon, the consequent relative accuracy for the residual energy in CsI(Tl) crystal is at 50 AMeV, at 25 AMeV and at 5 AMeV. One has to note that the relative accuracy of the total energy of the ion, deposited in both Si and CsI(Tl) detectors never exceeds . Starting from the energy deposited in the m Si detector, and by using the stopping power tables of Hubert et al. [9] above 2.5 AMeV and the renormalized variant of those of Northcliffe and Schilling [10] under 2.5 AMeV, the residual energy deposited in the scintillator placed behind it is calculated. For light charged particles and light fragments (), the mass is identified, while for heavier fragments, an hypothesis is necessary for the mass.
For rings 10 - 17, the CTs play the essential role in estimation of the energy deposited into the scintillators, as providing reference energy spectra. Instead of directly looking for the correspondence: total light output - deposited energy into the scintillator, event by event, the incremented spectrum (for each reaction product) is compared to the associated reference one, to which it is stretched. The calibration procedure for the backward rings is presented in subsection 4.4, followed by a description of a rapid fragment identification recipe making use of the same mentioned expression.
All along this paper, the Xe + Sn system at 32 and 50 AMeV incident energies is used and emitting reaction products over a large range, in energy and atomic number, have been selected. The experimental data were taped only for multiplicities higher than or equal to 4 (multiplicity ). Thus, the reaction products in the present application originate only in exit channels involving a non negligible transfer of kinetic energy into internal degrees of freedom. As a consequence, the emitted primary fragments have excitation energies (greater than around 1.5 AMeV) leading mainly to neutron evaporation. The secondary fragments (after evaporation) populate the “attractor” line in the map of nuclides [11] rather than the “stability” line. The corresponding mass formula [11] will be consequently employed when the isotopic mass was not determined. In most of the cases, one CsI(Tl) detector will be used (module 2 of ring 3) to illustrate the described procedure. The nominal thickness of the preceding silicon detector is m.
2.3 The shape of the signal
The light emitted by a CsI(Tl) crystal hit by a charged reaction product has a rise time negligible [12, 13, 14] as compared to the decay time which is in the microsecond range. The rise time is related to the transfer of the energy deposited by the particle to the optical level involved into the scintillation, while the decay time constant concerns the light emission.
Traditionally, the decaying part of a CsI(Tl) scintillation is described by one [15, 16] or two [13] exponentials of short decay-constant (s) or, more often, by one short decay-constant exponential (s) and one long decay-constant exponential (7 s [17]). The short decay-constant depends on the identity of the particle, while the long one is considered to be the same for all particles.
Proton induced signals recorded by means of flash ADCs up to 20 s [18] have shown decaying parts which are curved in a semilogarithmic scale, with a steep descent in the first 3-4 s, which includes the larger part of the integral of the signal. The lower is the incident energy, the steeper is this part of the signal and the higher is its weight in the signal integral. For very low energy (a few MeV), the shape of the decaying signal is a straight line in a semilogarithmic representation versus time, i.e. it shows an exponential decaying time dependence. At higher energy, several exponentials would be necessary for a perfect description of the shape of the whole decaying curve. As in Ref. [17], the authors of Ref. [18] have kept only two. The first one – the “fast component” – for the dominant steep descent part, has a short decay-constant (0.5 s – 1 s), with a strong dependence on the atomic number Z, mass number A and incident energy of the particle. The second one – the “slow component” – has a long decay-constant (5 s [18]) nearly independent of the type of particle.
Pulse shape analysis allows particle discrimination up to Z=5 for the CsI(Tl) scintillators of INDRA. At the highest energies in Ref. [18], the fast component covers at least 65 % of the integral of the signal for hydrogen isotopes at 20 - 40 AMeV, 75 % for helium ones at 30 AMeV, 85% for light fragments (=3-6) at 15 - 25 AMeV [18] and at least 95 % for heavy fragments, as shown in Fig. 1 for Si at 8 AMeV and Kr at 50 AMeV (present work). The above mentioned weights become even more important when the incident energy decreases, i.e. when the average specific electronic stopping power (for which a good estimate, within a mutiplicative factor, is ) is high enough. is the corresponding particle range, and the estimate of the average specific electronic stopping power is derived from the approximation of Bethe-Bloch formula . From the above considerations, one may assume in the latter case that only one decay-constant (,A,Z) is involved for each event. Its value will be close to that of the fast component.

A signal at the crystal PMT output, described as in Ref. [18] by two exponential functions associated to the fast and slow component respectively:
| (1) |
has the total light response corresponding charge got by integrating over time between 0 and .
In one exponential approximation, the same signal would be:
| (2) |
where approximates the integral of the signal, .
3 Reconstruction of the total light output
In the case of INDRA, only parts , of the signal are integrated in the time gates 0 – 400 ns and 1600 – 3100 ns, respectively. Let us make the following exercise: consider the expressions of and provided by the two exponential formula of the signal (1) on one hand, and by the one exponential formula (2) of the signal, on the other hand. The values of the expressions of F and S found in both cases have to be equal. From these equalities, one can derive and the ratio for the data in Ref. [18], but making use of the time gates of INDRA. The results of this estimation are plotted in Fig 2a) against the estimate of the average specific electronic stopping power. This plot has a predictive character: the maximum error done in the integral of the signal estimation would be of about 10% in the case of the most energetic protons but much lower for the charged reaction products with . Fig. 2b) shows the ratio versus the reciprocal of the decay-constant value of the ion in question; the normalization constant is in fact the lower measured value for ions at the lowest energies ( 1 AMeV) and hence the highest stopping powers. This kind of plot could eventually be used in order to correct . In any case, as long as 0.4 (e.g. Ar ions with 810 MeV/nucleon), estimates within 2%. This is the case for most of our data.

In view of the above argument, we shall suppose in the following that the current at the last dynode of the PMT associated to a CsI(Tl) scintillator varies exponentially in time as in Eq. (2), where is the total charge. This current, injected in the anodic circuit of the PMT, leads to the measured current at the output of the PMT base , which may be expressed [19] by means of the equation:
| (3) |
The total light output is proportional to the total charge ; and are the rise time and decay time constants respectively. has been measured for the bases of all PMT (60 ns for rings 11 - 16 and 20 ns for other rings). The shape of the signal given by equation (3) is shown in Fig. 1. By integrating expression (3) within the gates mentioned above, one obtains:
| (4) | |||||
| (5) |
with =390 ns, =1590 ns and =3090 ns (the integration gates have undergone a diminution of 10 ns according to the delay of the signal in the VXI cards). The reason why it was necessary to approximate the decaying shape of the signal by a single exponential function of time - eq. (3) - is that in INDRA experiments, only and (the channels of the charge convertors corresponding to the two gates) are measured and not the integral of the signal. Under this assumption and by means of the two eqs. (4) and (5), it is possible to find the two unknown quantities and and therefore, within a multiplicative constant, the total experimental light output. The measured resolutions (FWHM) of the CsI(Tl) crystals for Si of 7.86 AMeV and particles of 21 AMeV are of for F and for S. This leads to an accuracy of for above 10 AMeV. Below a total energy of 10 MeV the accuracy progressively goes down to 3 - 4, which roughly corresponds to the measured resolution on the total light for particles of 5 MeV. For protons of 21 MeV, the resolutions (FWHM) are: for F and for S, leading to an accuracy of for above 10 MeV. Below this energy, the accuracy progressively goes down to 6 - 7.
4 Approximate formula from RNQM model
4.1 Analytical integration
In practical situations, an analytical integration of the total light output issued from the RNQM [3] would be more suited. This is possible starting from the first order approximation for total light output formula (expression (18) in the previous paper [3]):
| (6) | |||||
if suitable approximations are made for the stopping powers, the concentration of the defects created by the incident fragment and the fractional energy loss deposited outside the primary column by the generated – rays. All these quantities are discussed in the preceding paper [3].
-
i)
For the specific electronic stopping power formula of Bethe-Bloch, the usual approximation: , reasonable above a few AMeV, may be used; here is a constant including the logarithmic term in the Bethe-Bloch formula, much more slowly varying than 1/E.
-
ii)
The created defect concentration estimated by , is well approximated by neglecting the second term () in equation (4) of the preceding paper [3] .
-
iii)
The specific nuclear stopping power, , may also be roughly estimated by an behaviour, as shown in Fig. 2b) of the preceding paper [3]: with constant. In this way, the factor in the denominator of all the terms in expression (6) becomes a constant: , to be included in the multiplicative parameter that will be called , and the nuclear and recombination quenching terms to the denominator of the first two terms (concerning the primary column) in the same expression may be summed and replaced by only one: .
-
iv)
By keeping the zero and first order terms in the Taylor expansion around of the logarithmic term of the fractional energy carried by the – rays (see Eq. (7) of the preceding paper [3]), one may get an approximate expression of :
| (7) |
With the above items i)–iv) assumptions, the first order approximation formula (6) of the total light output depends on three parameters only and may be analytically integrated.
| a) | b) | |
| [a.u.] | 19.5 | variable |
| [a.u.] | 0.71 | 0.25 |
| [MeV] | 3.8 | 3.1 (1.0)∗ |
| 0.26 | 0.27 |
∗ see the text for explanation
The quality of the fragment loci reproduction in a map will be shown in the next subsection.

4.2 A friendly analytical formula for the total light output
The alternative to the item iv) approximation of the fractional energy carried by the – rays is to consider it as a step function of energy:
| (8) |
where is the energy per nucleon threshold for the – ray production and will be a fit parameter too. The advantage is that the first order approximation of total light output expression (6) becomes a simple, easily to handle one:
| (9) |
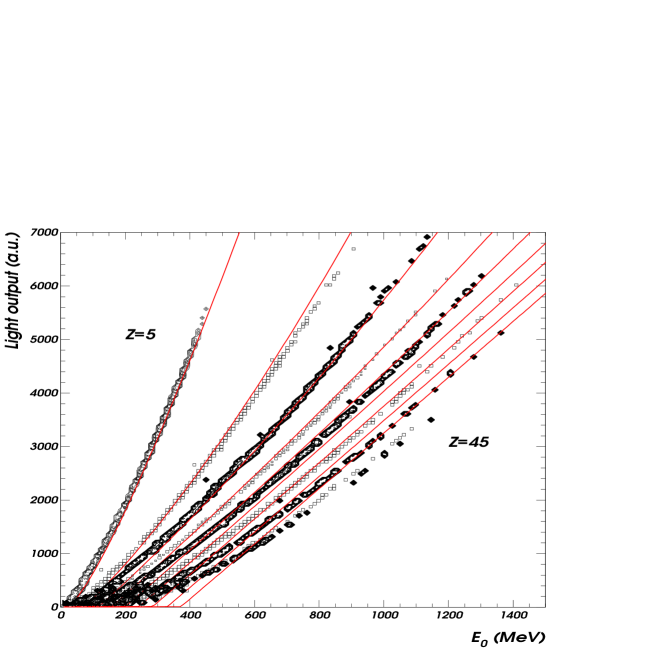
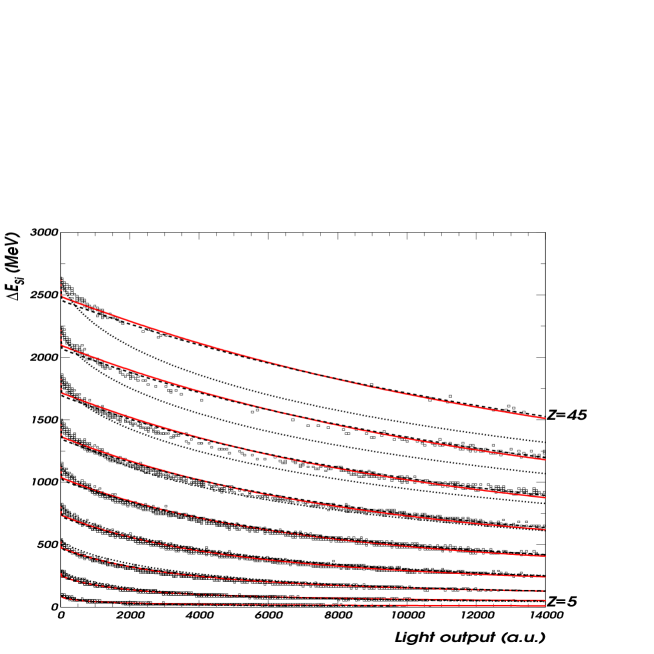
(), very suitable for energy calibration purposes. The fit parameter values are given in column a) of Table 1, and the quality of the fit is shown in Figs. 3,4 (solid lines) and 5. Even if the total light outputs are no more as nicely reproduced as by exact calculations [3], especially for high specific electronic stopping power values, the description of the reaction product identification in the two-dimensional plot (Fig. 4) and the deviations of the calculated energies relative to the true energies (Fig. 5) remain comparable to the exact calculation case. More precisely, the heavy fragment identification in a map is possible with a resolution of one unit charge around =40. The corresponding energy deviations may locally reach up to 15% - 20%, but globally there are inside . About 3% of accuracy are lost as compared to the exact calculations. Note in Fig. 4 that the step function approximation for (solid lines) does not worsen the result as compared to the physical approximation (7) (dashed lines). In fact, it is approximation i) for the Bethe-Bloch formula which is distorting - via the fit procedure - the shape of the light response for the heaviest fragments (Fig. 3).
For the energetic light charged particles, there are discrepancies at high energy, whose origin is the slight underestimation of total light output (see sect 2.3). For energy calibration purpose, the recipe to ameliorate the situation was to use a different gain parameter for low average specific electronic stopping power (), or directly for protons, which constitute most of the data for which the experimentally determined differs from the real experimental light output by (Fig. 2a)). The alternative could be a previous correction of concerning these data, based on the values, as suggested by Fig. 2b).
An interesting point is that the gain parameter values got by using only light fragments, or even light charged particles are very near the values obtained by using a large ion data range up to =45, if the other parameters, provided by the whole range of ions, are kept constant at the values given in Table 1a). Such a conclusion clearly appears in Fig. 6: values are found nearly independent of the upper limit in Z () considered, when the last three parameters are fixed . If only are kept constant at the mentioned values, remain practically the same as long as 14. Otherwise, as the light response induced by intermediate mass fragments or light charged particles is less non-linear than that corresponding to heavy ions, the parameter has the tendency to diminish and, consequently, too, for the same quality of the description.

A search of the fit parameter values was performed for one module of each of the 8 forward rings equipped with preceding silicon detectors, by using as input data the light outputs induced by intermediate mass fragments, accessible in the covered angular domain () for the studied system. It has led to very similar values of the parameters , close to those provided by large and scale data. The quenching parameter is related to the average stopping power of the reaction product, i.e. to its identity and energy, but also to the activator concentration of the crystal, as we shall see in the next subsection. It may vary from one to another ring, but not dramatically. The corresponding averaged values of these 3 parameters - presented in column b) of Table 1 - are the recommended values for the applications when formula (9) is used. was decreased at the lower detection threshold (the value in parenthesis) in order to avoid the discontinuity in the energy spectra induced by the “non-derivability” at of the light output expression as a function of the energy. By keeping fixed, the remaining gain parameter may be accurately determined as a free parameter by using simply light charged particles. The results are very similar to those shown in Figs. 3,4 with solid lines and in Fig. 5.
4.3 Comparative study of the CsI(Tl) crystals of INDRA
The total light output friendly formula (9) was used to perform a comparative study of the CsI(Tl) crystals of INDRA. At forward angles (rings 2 - 9), the experimental values were obtained from elastically scattered light ions on various targets (C, Al, Au). The light ions were produced by secondary beams with atomic number Z = 1 - 6 and mass number A precisely identified. The threshold energy per nucleon required to generate – rays which contribute to the scintillation is an intrinsic characteristic of the CsI crystals. Consequently, after a grid search over all the modules of the 8 forward rings, the parameters , and hence too, were fixed. The crystals belonging to one ring have the same size, the same shape and similar Tl (as well as eventually defect) concentrations. The gains of the associated PMT are the same. For this reason, one would expect that the parameters and :
take nearly the same values for the modules of one ring; the quantities , were defined in the previous paper [3] and , are factors connected to the light collection (geometry of the crystal) and to the PMT gain, respectively. Actually, this is the situation, as shown in Fig. 7a),b) for the modules of ring 2.
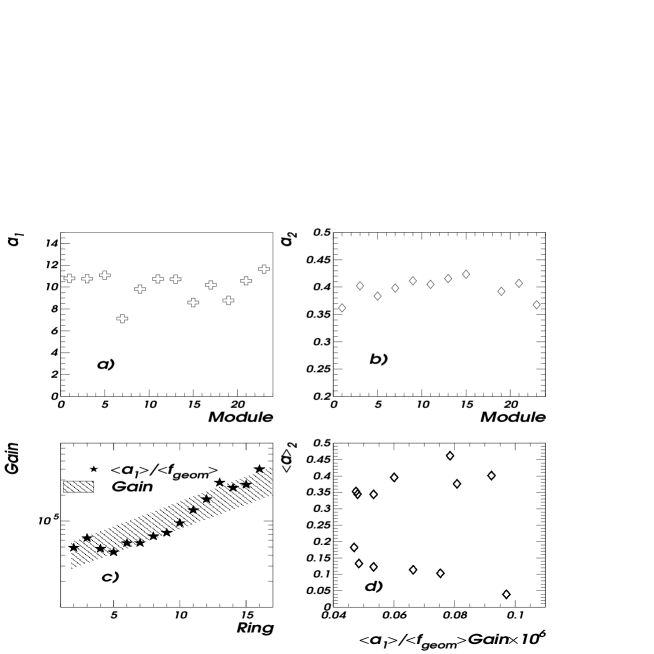
If , the parameter is mainly related to the associated PMT gain. The geometrical light collection factor is proportional to the response of the crystal at source – ray irradiation measured with the same PMT for all the crystals of INDRA. Averaged over the modules of the same ring, the parameter plotted versus the ring number, follows the approximately known values of the PMT gain (provided by the manufacturer) as shown in Fig. 7c). The correlation of the two parameters and may be followed in Fig. 7d), if is previously corrected for the geometric and gain factors. Obviously, there is no mathematical correlation: two groups of detectors are put in evidence. They may correspond to the different concentrations of the Tl activator - from 200 ppm to 2000 ppm - (and eventually of the other crystal imperfection) which could appear during the CsI(Tl) crystal growth through the Bridgman method [20]. At backward angles of INDRA (rings 10 - 17), only light charged particles, available from secondary beams at GANIL, could be used in the fit procedure to get the results presented in Fig. 7c),d). For unitarity, in these last two plots, we have also restricted the forward angle employed data to light charged particles only.
The above statistics performed over more than 300 CsI(Tl) crystals belonging to INDRA array and the related considerations enforce the consistancy of the RNQM and of the exact or approximate light output expressions obtained in its framework. The parameters and, to a certain extent, may be considered as intrinsic characteristics of the CsI(Tl) scintillators used in nuclear physics applications. Insofar, the rather simple formula (9) of the total light output, together with the recommended values in Table 1b) constitute a powerful tool to be used in heavy ion experiments. Starting from easily to obtain light charged particle experimental data (excluding protons if their total light signal is not directly measured), they allow to accomplish useful applications such as heavy fragment identification and their energy determination, in case of lack of directly related information. An example is given in the following subsection.
4.4 Reaction product identification and energy calibration of the backward angle modules of INDRA
There are two major difficulties when the CsI(Tl) scintillators of INDRA placed at polar angle above are exploited. Firstly, in a map the identification is perfect for low atomic number of the fragments (). For higher values the identification of the atomic number becomes uncertain, because of the poor statistics and the lower IC energy resolution, as compared to the Si detectors. Secondly, at large angles it is quite difficult to obtain data of elastic scattering for fragments. Insofar, the calibration of the module belonging to the same ring is performed in two stages.
In the first stage, we consider the CsI(Tl) partially obturated by the calibration telescope CT (Si(80 m) - Si(Li) 2 mm), one per ring. Most of the fragments (4) are stopped in the Si(Li) and therefore identified in the Si – Si(Li) telescope. The corresponding energy spectrum is built for each atomic number . There are energetic light charged particles ( AMeV) passing through the silicon telescope and stopped in the CsI(Tl) crystal coupled behind. The calculated [9, 10] residual energies are the “true” energies deposited in the scintillator. Relied on the analytical expression (9) of the light output, and using the recommended values from Table 1b) for parameters , and , the parameter is determined by a fit procedure. By means of these parameters, the energy spectrum in the scintillator is built for each of the light charged particles punching through the silicon telescope. Put together the silicon telescope and CsI(Tl) scintillator spectra provide the whole energy spectrum for a given particle. These spectra and those of fragments up to =15 stopped in the Si – Si(Li) telescope are the reference spectra for the respective ring, concerning an energy range: for each type of reaction product. At the same time, the parameters allow to perform identification in a map for the whole range of atomic number of light charged particles and fragments passing besides the silicon telescope and entering the CsI(Tl) coupled behind. The energy spectra of these reaction products were compared with the reference spectra; the superposition is quite good.
In the second stage all the other CsI(Tl) scintillators of the ring are calibrated. The energy spectra of a given Z have to be identical to the corresponding reference one (the trigger used in the experiments did not break the axial symmetry of INDRA). An energy spectrum, starting from the light response spectrum, is obtained by stretching it between in order to reproduce the reference spectrum. A minimizing procedure based on the MINUIT package from CERN library is used. It provides the parameters , for the considered module. The parameters (i=1,4) allow afterwards a complete Z identification in the map. The energy spectra of the fragments stopped in the respective scintillator are determined too [23]. The good quality of the procedure is illustrated in Fig. 8, where energy spectra of different particles stopped in one of the scintillators of ring 10 of INDRA are compared to the reference spectra of the same ring.

4.5 And if the – rays would be neglected?
We have to stress once again the importance of taking into account the – ray effect in the light output, especially for reaction products heavier than intermediate mass fragments (). By neglecting it, only the first term in the right side of Eq. (9) would appear. The results remain reasonable for but with values of the fit parameters which change significantly as compared to the case where the knock-on electrons were taken into account. The quality of the fit is drastically degraded for fragments heavier than Z=15. So are particle identification (Fig. 4) and energy calibration.
5 Conclusions
The data obtained with the INDRA array (large range in and ) provided a good opportunity to proceed to a more basic study of the light output of CsI(Tl) scintillators and to derive suitable calibration and identification procedures. Starting from the fast and the slow parts of the light output (fractions of the total light response integrated in the corresponding time gates), it was possible to rebuild the integral of the signal.
Under suitable approximations, the expression of the total light output derived in the preceding paper [3] may be analytically integrated. Even if up to 3% of the accuracy may be lost, the fact presents the huge advantage of extremely short computing time. The derived expressions, easily to handle, were successfully applied for fragment identification in maps and for the energy calibration of the CsI(Tl) scintillators. At forward angles, where a Si detection layer exists, these applications lead to an important reduction of the computing time. At backward angles, where two problems exist: fragment identification and energy calibration of the CsI(Tl) crystals, the above procedure plays an even more important role and corresponds to the optimum way we have found to solve these two tasks.
A comparative study of the CsI(Tl) scintillators of INDRA has shown that the model parameters are meaningful quantities, related to the light collection and the PMT gain, to the activator and eventually crystal imperfection concentrations and to the – ray production energy threshold. Except the gain parameter, all the others are characteristics of the usual CsI(Tl) scintillators. Their averages, performed over the 324 CsI(Tl) crystals of INDRA, allowed to find reliable, recommended parameter values. Together with the related total light expression, they constitute good implements for energy calibration and heavy ion identification applications in heavy ion physics experiments.
References
- [1] J. Pouthas et al., Nucl. Instr. and Meth. A 357 (1995) 418.
- [2] J. Pouthas et al., Nucl. Instr. and Meth. A 369 (1996) 222.
- [3] M. Parlog et al., Nucl. Instr. and Meth. A, preceding paper
- [4] D. Williams, G. F. Snelling and J. Pickup, Nucl. Instr. and Meth. 39 (1966) 141.
- [5] D. W. Straecener et al., Nucl. Instr. and Meth. A 294 (1990) 485.
- [6] D. Guinet et al.,Nucl. Instr. and Meth. A 278 (1989) 614.
- [7] Laser Science Inc., Cambridge, MA, USA.
- [8] G. Tabacaru et al., Nucl. Instr. and Meth. A 428 (1999) 379.
- [9] F. Hubert, R. Bimbot, H. Gauvin, At. Data and Nucl. Data Tables 46 (1990) 1.
- [10] L. C. Northcliffe and R. F. Schillling, Nuclear Data Tables A7 (1970) 233.
- [11] R. J. Charity, Phys. Rev. C 58 (1998) 1073.
- [12] V. K. Liapidevski et al., PTE 2 (1974) 62.
- [13] H. Grassmann, E. Lorentz and H. G. Moser, Nucl. Instr. and Meth. A 228 (1985) 323.
- [14] J. D. Valentine, W. M. Moses, S. E. Derenzo, D. K. Wehe and G. F. Knoll, Nucl. Instr. and Meth. A 325 (1993) 147.
- [15] J. C. Robertson, J. G. Lynch and W. Jack, Proc. Phys. Soc. 78 (1961) 1188.
- [16] J. C. Robertson and J. G. Lynch, Proc. Phys. Soc. 77 (1961) 751.
- [17] R. S. Storey, W. Jack and A. Ward, Proc. Phys. Soc. 72 (1958) 1.
- [18] F. Benrachi et al., Nucl. Instr. and Meth. A 281 (1989) 137.
- [19] Glenn F. Knoll, Radiation detection and measurements, third edition, John Wiley and Sons, Inc. (2000) 229.
- [20] BDH-Merck Ltd, West Quay Rd, Poole, BH15 1HX, England.
- [21] R. Gwin and R. B. Murray, Phys. Rev. 131 (1963) 501.
- [22] F. S. Eby and W. K. Jentschke, Phys. Rev. 96 (1954) 911.
- [23] N. Le Neindre, Thèse docteur de l’Université de Caen, (1999) LPCC T 99-02.