Charged-particle pseudorapidity density distributions from Au+Au collisions at =130 GeV
Abstract
The charged-particle pseudorapidity density has been measured for Au+Au collisions at =130 GeV at RHIC, using the PHOBOS apparatus. The total number of charged particles produced for the 3% most central Au+Au collisions for 5.4 is found to be 4200470. The evolution of with centrality is discussed, and compared to model calculations and to data from proton-induced collisions. The data show an enhancement in charged-particle production at mid-rapidity, while in the fragmentation regions, the results are consistent with expectations from and scattering.
pacs:
25.75.-qNucleus-nucleus collisions at highly relativistic energies from the Relativistic Heavy Ion Collider (RHIC) present a new opportunity for the study of strongly interacting matter under conditions of very high temperature and energy density. Already, data from central Au+Au collisions at energies of =56 and 130 GeV [1] have shown an increase in mid-rapidity particle production over that observed in Pb+Pb collisions at the CERN SPS [2]. In addition, the charged-particle yields, when scaled by the number of participating nucleons (), exceed the values observed in proton-proton collisions at similar . These results have been used to infer an energy density at the highest value of that is considerably larger than was achieved at CERN, and which is well within the region where new physics is to be expected.
The distribution of over the entire range of pseudorapidity , where and is the angle with respect to the beam, represents a time-integral of particle production throughout the collision, and reflects all effects that contribute to the production of charged particles. In addition to the influence of both hard and soft production processes, is sensitive to nuclear effects in the initial parton distributions, as well as to effects from hadronic re-interactions in the final state.
The data for at mid-rapidity () for the most central Au+Au collisions at =56 and 130 GeV[1] are in reasonable agreement with the predictions of a number of models including HIJING[3], a saturation model(EKRT)[4], and purely hadronic models (e.g. LUCIFER[5, 6]). The centrality dependence of at mid-rapidity has also been measured[7, 8]. These results suggest some deviation from both the HIJING and EKRT model predictions, although they are in broad agreement with the results of calculations by Kharzeev and Nardi[9].
An extension of the measurements of data beyond mid-rapidity, for a range of impact parameters, is necessary to further constrain models. It is also of interest to determine whether the observed scaling of the charged-particle yield with at mid-rapidity is modified at large values of where, in proton-nucleus () collisions[10, 11, 12], re-scattering, stopping, and target fragmentation influence the shape of the distributions. In order to address these questions, we have used the PHOBOS apparatus to measure the charged-particle pseudorapidity density from Au+Au collisions at =130 GeV over the range .
The PHOBOS experiment at RHIC largely consists of several arrays of silicon pad detectors. The details of the experimental arrangement are described in Ref. [13]. The procedures used for event selection, the determination of the collision-vertex position, event centrality, and the estimation of , have been described in Refs. [1, 8]. The specific elements of the experiment used in the current measurement and the analysis procedures leading to are described below.
The data samples included in the current analysis were taken at a collision energy of =130 GeV. The collision vertices were confined to a region within 10 cm of the nominal beam crossing and center of the apparatus (). At mid-rapidity, charged particles were detected, and their energy deposition measured, with an octagonal array of pad detectors approximately 1 m long (the “Octagon”) that surrounds the thin-walled Be beam pipe. The Octagon subtends the full azimuthal range, except for regions where sensors that would intercept the acceptance for the tracking spectrometers and vertex finding detectors are removed. For collision vertices within 10 cm, the pseudorapidity coverage of the Octagon is complete for 3.2. Six rings of silicon pad detectors placed at distances of 1, 2 and 5 m, detected particles in pseudorapidity ranges of , , and , respectively. Thus, for collisions within the 20 cm long region in the center of the experiment, there are no significant gaps in the coverage from one sub-detector to the next. The total numbers of pads in the Octagon and Rings are 11,040 and 3,072, respectively.
Two complementary methods were used to analyze the pseudorapidity distribution data. The first method (“Hit Counting”) uses the segmentation of the multiplicity detector. After merging of signals in neighboring pads, in cases where a particle travels through more than a single pad, the deposited energy was corrected for the angle of incidence, so that all tracks originating from the collision vertex possess a common average value of the deposited energy ( keV). Pads containing more than 75% of this value were counted as occupied. This requirement largely suppresses hits from background and from secondary-particles not originating from the primary collision vertex. Then, for a given value of and bin in collision centrality, the number of hit pads was corrected for the effects of multiple occupancy, where more than one particle travels through a given pad, as well as for contributions from the remaining secondary particles, absorption in the beam pipe, and weak decays of primary particles. The number of particles per pad was determined as a function of and centrality bin in two ways. In the first method, the probability of particles passing through a given pad was assumed to be Poisson distributed. The mean occupancy could then be determined from the ratio of occupied to unoccupied pads in a range of for each centrality bin. Second, as a check, the occupancy was also determined from the energy-deposition spectra. A fitting procedure was used to determine the relative contribution to the total energy deposition of one or more particles, thus providing an independent measure of the mean occupancy . Maximum values of approximately 1.6 particles per hit pad were obtained for the most central collisions at mid-rapidity.
To account for effects or biases not treated in the above analysis procedures, a final correction was deduced from GEANT simulations of the detector response using events from the HIJING[3], RQMD[14] and VENUS[15] event generators. The ratio between the simulated, occupancy-corrected distributions and the known “Truth” distributions formed this last set of corrections, which ranged up to 15% in the Octagon and up to 50% in the Rings. These background correction factors, dependent upon both and centrality bin, were applied to the occupancy-corrected data, yielding . The final results obtained using both hit counting methods were in good agreement.
In the second (“Analog”) method, the pseudorapidity distribution was extracted directly from the energy deposition in the multiplicity detectors. The measured energy deposition was transformed into using quantities derived from the results of Monte-Carlo simulations. The average energy per track () was determined as a function of using particles from HIJING events, passed through the GEANT simulation of the detector. The fraction of primary particles was determined from the same simulations. Then, . Although the two methods differ qualitatively in the way in which the energy-deposition information from the multiplicity detectors is used, and rely differently upon the results of Monte-Carlo simulations, they yield results that differ generally by 5% throughout the range in , well within the systematic uncertainties (see below), which are approximately 10%.
The systematic uncertainty in the occupancy correction for the hit-counting analysis was obtained by comparing the results from the full analysis chain using Poisson-derived occupancy corrections with those derived from the measured spectra. The average deviations are less than 3%, yielding a partial systematic error of 3% at mid-rapidity. The systematic uncertainties from the Monte-Carlo simulations have been estimated by using different assumptions in the GEANT simulation, as well as different event generators, including RQMD[14] and VENUS[15]. The variations observed in the derived background corrections are between 4 and 8%, suggesting a total systematic uncertainty of approximately 10%. The systematic errors in the Analog analysis arise from uncertainties in the Monte Carlo simulations, as well as those in the absolute energy calibrations of the Silicon-pad detectors. The latter are approximately 5%, yielding a total systematic error for the Analog method of approximately 10%, similar to that for the hit-counting method.
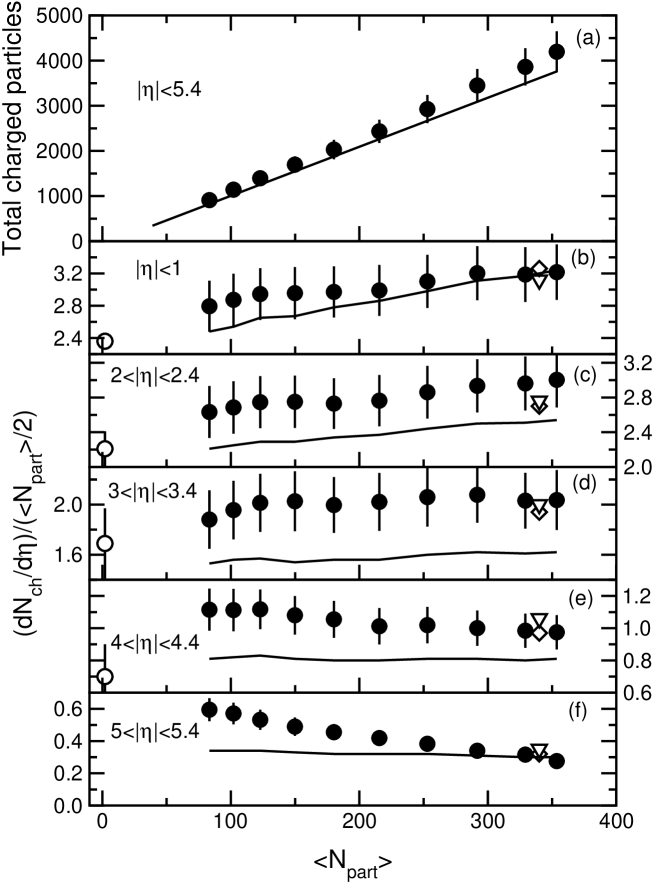
Our final results are presented in Fig. 1(a)-(f), which show the error-weighted average values of from the two procedures for six different centrality bins. The error bars represent a convolution of the estimated systematic errors in the different analyses. The different centrality bins are denoted by the corresponding fraction of the observed total cross section, as well as by the deduced average number of participant nucleons . While the occupancy and background corrections applied to the data from different parts of the apparatus are quite different in magnitude, the data from the Octagon and Ring detectors merge smoothly in most cases. The present analyses give values of that are in good agreement from the independent “Tracklet” analysis presented in [8]. For example, for the 6% most central collisions, we find , compared to 58025 from Ref.[8].
The integral of the distributions , plotted in Fig. 2(a) as a function of centrality, is a direct measure of the total entropy produced in the collisions. Predictions of its magnitude have varied by as much as factor of two [16]. With increasing , the observed values of change smoothly from for the 40-45% centrality bin to for the 3% most central collisions. Per participant pair, these numbers correspond respectively to 21.8 and 23.72.7, compared with the and non-diffractive total charged particle multiplicity of 18.5[17]. The predictions of the HIJING model reproduce the general trend of the centrality dependence, but systematically under-predict the observed values by approximately 10%.
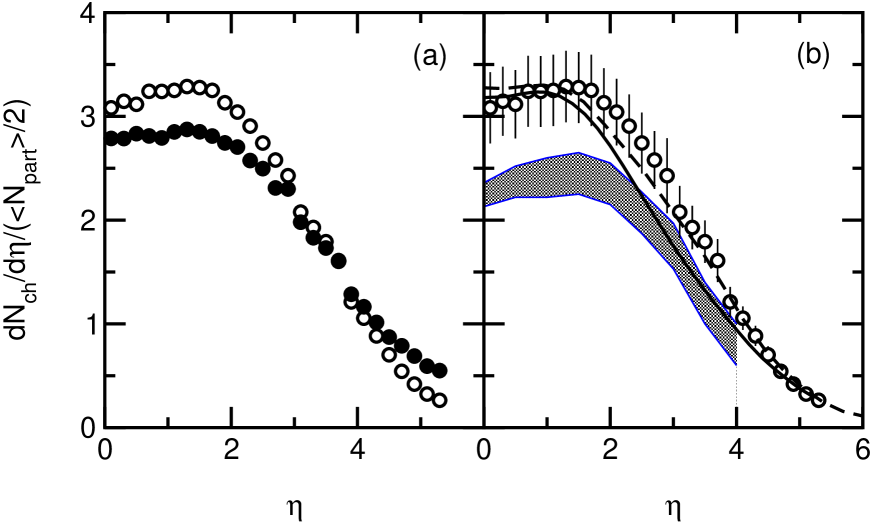
The shapes of the pseudorapidity distributions evolve gradually with increasing centrality, as shown in Fig. 1(a-f). For all centrality bins, there is a plateau region between , followed by a rapid drop-off towards larger pseudorapidities. A more detailed study of the centrality dependence of the shape is given in Figs. 2(b-f) and Fig 3(a). In Figs. 2(b-f), the dependence of normalized per participant pair , is plotted for five pseudorapidity bins ranging from to . Also plotted are data from [18] and [19] collisions, scaled as described below, as open circles, and predictions from the HIJING model as solid lines. The statistical uncertainties are small and the systematic uncertainties are comparable to those described above. Figure 3(a) shows the pseudorapidity distribution for peripheral (35-45%) and central (0-6%) Au+Au collisions, scaled by the respective number of participants.
For all pseudorapidity bins in Fig. 2(b-f), the data evolve smoothly from the most peripheral to the most central collisions. As seen in Fig. 2(b,c) and Fig. 3(a), central collisions yield a 10-15% higher per participant in the plateau region, compared to peripheral events. This difference decreases at larger pseudorapidities and reaches a turnover point between and 4, as seen in Fig. 3(a). Beyond that, a higher yield per participant is found in peripheral collisions. In Fig. 2(d) and (e) this turnover can be seen as a change in slope of the dependence of in the respective bins. In the highest 1.5 units of pseudorapidity, as is observed in collisions at lower energies [10, 11, 12], the scaled charged-particle density actually falls with , being reduced by nearly a factor of two for . Qualitatively, the changes in the distributions from peripheral, to central collisions in the fragmentation regions are similar to those observed in collisions [10, 11, 12].
Finally, a comparison of the shapes from collisions and central Au+Au collisions is given in Fig. 3(b). It shows the scaled pseudorapidity distribution for central collisions (0-6%), compared to scaled data from and collisions, shown as a grey band. The distribution was obtained by scaling the measured distributions from collisions at GeV and collisions at and 546 GeV [18, 19] horizontally by , where , and vertically using the parameterization of from [19]***This empirical scaling is chosen such that the extrapolation of three sets of or data are confined within the band shown on Fig. 3(b).. The grey band gives an estimate of the uncertainty of this extrapolation procedure.
The scaled is found to be higher in central Au+Au collisions than in over the full pseudorapidity range out to , with the largest excess observed in the central plateau region. This is in contrast with the HIJING prediction, which shows an excess in Au+Au collisions only for . A possible origin of this qualitative difference is suggested by the AMPT model of Zhang et al.[20]. In this model, the initial state parton distribution is obtained the same way as in HIJING, but is followed by a parton cascade [21], string fragmentation and hadronic re-scattering using a relativistic transport model [22]. This model reproduces the excess in particle production at higher pseudorapidities seen in Au+Au collisions relative to . Furthermore, predictions of in a completely hadronic framework (e.g. LUCIFER)[6] are very similar to those of the AMPT calculations, and are also in good agreement with the data for the most central collisions. These observations suggest that effects in the hadronic phase should be taken into account to provide a full description of the data. A comparison of the predicted centrality dependence of the full distributions from these models with the data would also be of interest. Further insight will be gained from future RHIC data, which should include more precise reference data from collisions, as well as nucleus-nucleus data at different collision energies. These results will provide a basis for separating the effects of new phenomena from conventional hadronic physics.
This work was supported in part by US DoE grants DE-AC02-98CH10886, DE-FG02-93ER-404802, DE-FC02-94ER40818, DE-FG02-94ER40865, DE-FG02-99ER41099, W-31-109-ENG-38, and NSF grants 9603486, 9722606, and 0072204. The Polish groups were partially supported by KBN grant 2P03B 04916. The NCU group was partially supported by the NSC of Taiwan under contract NSC 89-2112-M-008-024.
REFERENCES
- [1] B. B. Back et al., Phys. Rev. Lett. 85 3100 (2000).
- [2] J. Bälcher et al., Nucl. Phys. A661 45 (1999).
- [3] X. N. Wang and M. Gyulassy, Phys. Rev. D44, 3501 (1991).
- [4] K. J. Eskola et al., Nucl. Phys. B 570 379 (2000).
- [5] D. E. Kahana and S. H. Kahana, Phys. Rev. C59 1651 (1999).
- [6] D. E. Kahana and S. H. Kahana, Phys. Rev. C63 031901(R) (2001).
- [7] K. Adcox et al., [PHENIX collaboration], Phys. Rev. Lett. 86, 3500 (2001).
- [8] B. B. Back et al., Submitted to Phys. Rev. Lett., preprint nucl-ex/0105011.
- [9] D. Kharzeev and M. Nardi, Phys. Lett. B507 121 (2001).
- [10] W. Busza, Acta. Phys. Pol. B8, 333 (1978).
- [11] C. De Marzo et al., Phys. Rev. D26 1019 (1982).
- [12] D. S. Barton et al., Phys. Rev. D27, 2580 (1983).
- [13] B. B. Back et al., Nucl. Phys. A661 690 (1999).
- [14] H. Sorge, Phys. Rev. C52, 3291 (1995).
- [15] K. Werner, Phys. Rep. 232 87 (1993).
- [16] S. A. Bass et al., Nucl. Phys. A661, 205 (1999).
- [17] A. Wroblewski, in Proceedings of the XIV International Symposium on Multiparticle Dynamics, Lake Tahoe, June 1983, pp. 579.
- [18] G. J. Alner, et al., Z. Phys. C33 1 (1986).
- [19] F. Abe et al., Phys. Rev. D41 2330 (1990).
- [20] B. Zhang et al., Phys. Rev. C61, 067901 (2000).
- [21] B. Zhang, Comp. Phys. Comm. 109, 193 (1998).
- [22] B. A. Li and C. M. Ko, Phys. Rev. C52, 2037 (1995).