Neutron beam test of CsI crystal for dark matter search
Abstract
We have studied the response of Tl-doped and Na-doped CsI crystals to nuclear recoils and ’s below 10 keV. The response of CsI crystals to nuclear recoil was studied with mono-energetic neutrons produced by the 3H(p,n)3He reaction. This was compared to the response to Compton electrons scattered by 662 keV -ray. Pulse shape discrimination between the response to these ’s and nuclear recoils was studied, and quality factors were estimated. The quenching factors for nuclear recoils were derived for both CsI(Na) and CsI(Tl) crystals.
keywords:
Dark Matter , CsI(Tl) , CsI(Na) , PSD , Quality factor , Quenching factorPACS:
29.40.Mc , 95.35.+d , 14.80.Ly1 Introduction
It is known that a major component of matter in the Universe is not ordinary matter(luminous stars and/or baryons) but nonbaryonic exotic matter[1]. The Weakly Interacting Massive Particle(WIMP) is one of the strongest candidates for this dark matter, and direct searches for WIMPs using various detection techniques have been undertaken [2, 3, 4, 5, 6, 7].
The sensitivity of WIMP detection strongly depends on various parameters of the detector, such as detection threshold, mass of the detector, background rate, pulse shape discrimination(PSD) capabilities, etc. A WIMP may interact with the target nuclei through a WIMP-nucleus elastic scattering, and the detection of the nuclear recoil signal may give a signature of WIMP detection. The expected recoil energy is several tens of keV, depending on the masses of the target nucleus and the WIMP. However, because of the high stopping power of the recoil nucleus, the light yield of a scintillation detector is 5-10 times lower in comparison to a signal from a of equivalent energy due to quenching effect in normal crystals. Thus, the detection threshold should be low enough to measure a few keV of energy.
The expected event rate of the WIMP-nucleus interaction is less than 1 event /kg/day. Such a low event rate requires an extremely low background rate, on the order of several counts/kg/day/keV, and a large detector size in order to increase the signal rate. To reduce the background rate, the PSD between nuclear recoils and background ’s or electrons in the several keV region, can be utilized.
A CsI crystal is a good candidate for a WIMP detector thanks to its large light yield and relatively good PSD capability. Also, it is relatively easy to fabricate large detector volumes because the crystals are not hygroscopic. The large masses of Cs and I nuclei enhance the cross-section for a WIMP-nucleus, spin-independent interaction(which depends on [8]). However, the detailed response of the crystal to low energy radiation has not been fully investigated. Recently, the feasibility of using CsI(Tl) crystals as a WIMP detector was shown[9], while several other groups reported the characteristics of a CsI(Tl) crystal for WIMP detection[10, 11].
We studied here the response of CsI crystals with several different doping concentrations of Tl and Na to neutrons and ’s. The energy region was several keV for the ’s and several tens keV for the nuclear recoils. In this paper, the measurements of PSD and the quenching effect of the nuclear recoils for both CsI(Tl) and CsI(Na) crystals are reported.
2 Experiments
The response of CsI crystals to neutrons was studied using a tandem accelerator(maximum terminal voltage of 1.7 MV) at the Korea Institute of Geoscience and Mineral resources(KIGAM). Mono-energetic neutrons of 2.62 MeV were produced at zero degrees via the 3H(p,n)3He reaction, using a 7 to 9 nA beam of 3.4 MeV protons on a 3H target. These neutrons produce nuclear recoils with energies near that expected for WIMP interactions.
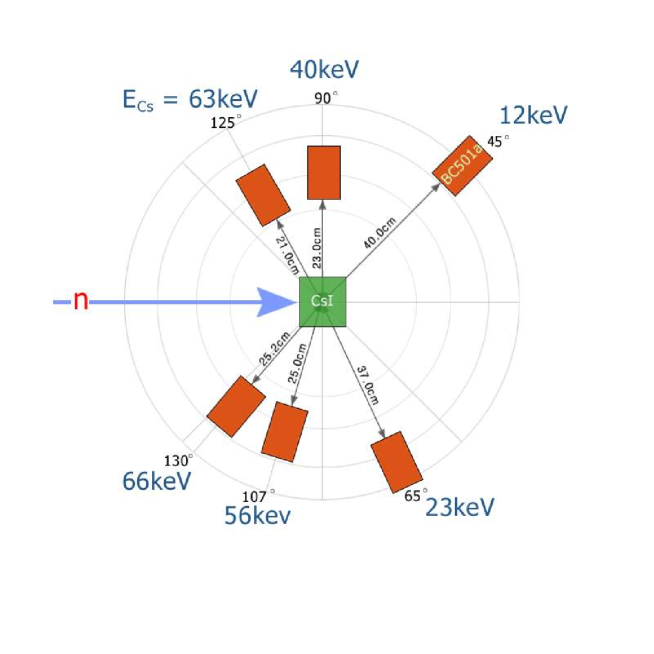
Figure 1 shows a schematic of the experimental setup. A CsI crystal was located at zero degrees with respect to the proton beam line. The CsI crystal was 3 cm 3 cm 3 cm, in cubic shape, and with all 6 faces polished. Two 3-inch PMTs(D726UK, Electron Tubes Limited), with green-extended RbCs bi-alkali photocathodes, were directly attached to the top and bottom surfaces. The top and bottom sides of the crystal were completely covered by the PMT cathode plane, and the other four sides were wrapped with two layers of Teflon (0.2 mm thick) followed by black vinyl sheets. In order to identify neutrons scattered from CsI, six neutron detectors were located at various angles ranging from 45 to 130 degrees. The detailed locations of the neutron detectors are shown in Figure 1. The neutron detectors were made of liquid scintillator(BC501A) contained in a cylindrical Teflon container of 12.7 cm diameter 10 cm long. One 2-inch PMT(H1161, Hamamatsu Photonics) was used for readout. Each neutron detector was contained in a polyethylene block, about 5 cm thick, and was shielded with lead and borated paraffin blocks. The recoil energy() of the nucleus can be calculated by a simple kinematical equation using the incident neutron energy and the scattering angle of the neutron, as determined from the position of neutron detector:
| (1) |
where is neutron energy, and are the masses of neutron and recoiling nucleus(Cs or I)111In the real calculation, the average mass of Cs and I was used. respectively, and is the neutron scattering angle.
The signals from a CsI crystal are amplified using home-made, fast amplifiers (8) with low noise and high slew rates. One output from these amplifiers (8) was directly connected to a digital oscilloscope(LeCroy LT364) in order to record the pulse shape. The other signal is amplified (10), again using a Philips amplifier(Philips 770), and connected to a discriminator(Philips 711) to form the trigger logic. The discriminator threshold was set to the level of single photoelectrons. In order to suppress the accidental trigger from PMT dark current, at least 4 photoelectrons within 1 (actually 2 photoelectrons within 0.5 for each PMT) were required(a so-called “4-fold” coincidence). The detailed description is shown in the reference[9].
The event rate of 4-fold coincidences of the signals from the crystal was about 1200 Hz when the neutron beam was on. Most of these events were due to the backgrounds induced by the neutron beam. In order to reduce the trigger rate, a time coincidence of a CsI signal(4-fold) and the neutron detector signal must occur within 500 ns. This reduced the trigger rate to less than 3 Hz. Trigger timing was determined by the neutron detector. The CsI signal was digitized by the digital oscilloscope(LeCroy LT364) with a 100 MHz sampling frequency and a 10 full range. The trigger timing for the oscilloscope was set at 3 . The neutron detector signal was digitized by a charge sensitive camac ADC(LeCroy 2249A). Data acquisition used ROOT[13] on a linux machine.
In order to compare the pulse shape of a nuclear recoil to that of a , the crystal was irradiated with a 137Cs source to induce Compton scattering. This induced a signal which is distributed uniformly inside the crystal. These data were taken separately using the same setup, but without the proton beam. The trigger was a 4-fold coincidence from a crystal.
Table 1 shows a list of the crystals tested. Two doping materials, Na and Tl, with various concentrations, were tested. The crystals were supplied by the Institute for Single Crystals in Kharkov, Ukraine. Growing methods of each crystal are indicated in the table.
The doping concentrations of the CsI(Tl) crystals were measured by the ICP-AES (Inductively Coupled Plasma - Atomic Emission Spectrometry) method. The 4 corners of each crystal were scratched by a razor blade, and sent to two independent institutes. Each institute measured two samples for each crystal. The errors of the doping concentration shown in the table are the standard deviation of the 4 measurements.
For CsI(Na), the doping concentrations were measured by ICP-MASS (Inductively Coupled Plasma - Mass Spectrometry) method. The measurement was done by only one institute and the measurement errors were claimed to be 2-3 %.
3 Analysis
3.1 Typical low energy signal from a CsI crystal
The single photoelectron(SPE) signal from a PMT has less than a 10 ns full width. After amplification, the signal is stretched a bit due to the inherent shaping time of the amplifier(the rise time is about 10 ns and the fall time is about 20 ns). Hence, the SPE signal spreads about 30-40 ns in the time spectrum. It is known that the decay time of CsI(Tl) is about 1 s [14]. Since the number of photoelectrons for low energy events (less than 10 keV where WIMP signals are expected to occur) was less than 60 (or 30 per one PMT), the SPEs were clearly separated from each other in an event. That is, a low energy real event can be identified as a set of SPEs above a threshold cut within a timing window of 10 s.
An example of a low energy signal is shown in Figure 2. This signal was produced by 5.9 keV X-ray from a 55Fe source. The average number of photoelectrons from a CsI(Tl) crystal was about 5 p.e./keV. As expected, the signal was composed of a set of well separated peaks composing the SPE signal. In order to reduce the noise contribution, a ’clustering algorithm’ was developed to identify SPEs. The pedestal of each event was estimated in the first 2 window before the trigger for each PMT. Each peak of about a 30-40 ns width and above a threshold value was considered one cluster.
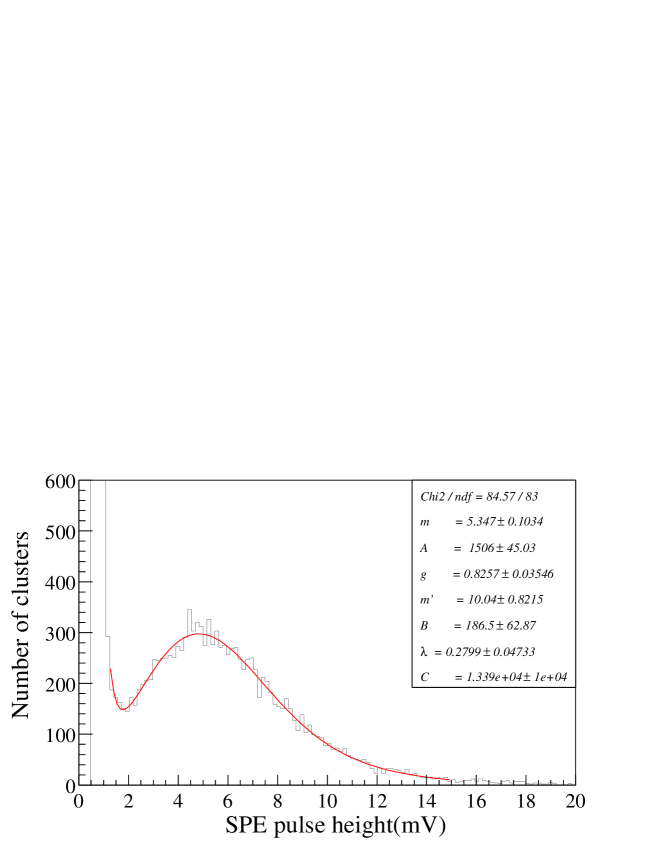
Figure 3 shows the pulse height distribution of the clusters composed of having 4 keV 8 keV, where is the measured electron-equivalent energy. The figure shows separation between the SPEs and the noise, with a peak to valley ratio of about 2. If the cluster is a real SPE, the pulse height distribution should follow a Poisson distribution, because the amplification at the first dynode inside the PMT follows Poisson statistics. In an attempt to understand the shape of the spectra, a fit was done using two superimposed Poisson functions(one for the SPE and the other for the SPE-overlapped signal) and an exponential function for noise, as expressed in the following equation.
| (2) |
where is the pulse height, is a number corresponding to the mean of the Poisson distribution, and is the gain factor of the PMT(from the second dynode). The results of the fit are overlaid in the figure as a solid line, where the reduced of the fit is about 1. The ratio of the mean values of two Poisson distributions, , was 1.88, compared to an expected value of 2. The ratio of the contributions of the two Poisson distributions is about 12%. So, we could conclude that the cluster is a SPE ( 80%) or due to overlapped photoelectrons( 20%). The same fit was performed for events of 2 keV 4 keV. A single Poisson function will fit the SPE spectrum.
3.2 Neutron identification
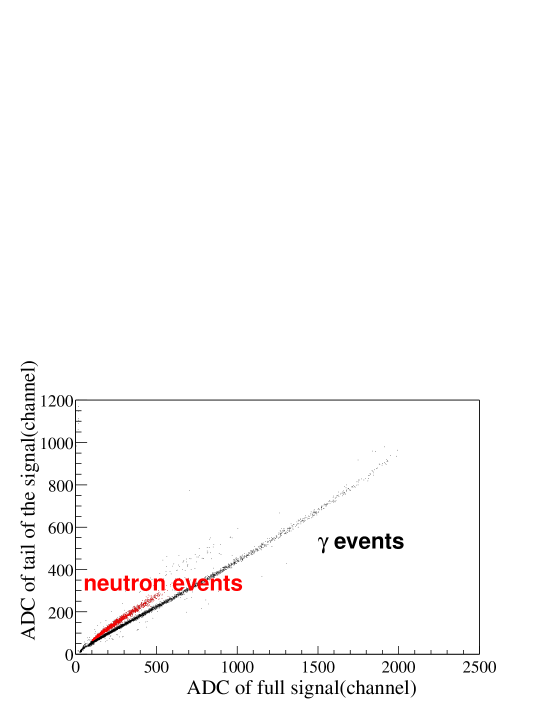
In order to identify neutron induced events, we required a coincidence between one of the 6 neutron detectors and the CsI crystal. Furthermore, neutron scattering events can be selected by separating neutrons and ’s in the neutron detector. It is well known that liquid scintillator(BC501A) can separate neutrons from ’s using PSD. The neutron(proton recoil) events have a longer tail than events for the same energy loss[14] in the BC501A liquid scintillator. Therefore, using the ratio of the total charge to the charge in the tail of the signal, the neutrons can be clearly separated from ’s. Figure 4 shows the neutron identification plot for the neutron detector. Above 300 keV, the neutron- separation is about 2.7 which is sufficient for neutron-event selection. The detailed description for neutron detector will be described in a separate report[15].
3.3 Timing characteristics of CsI crystal
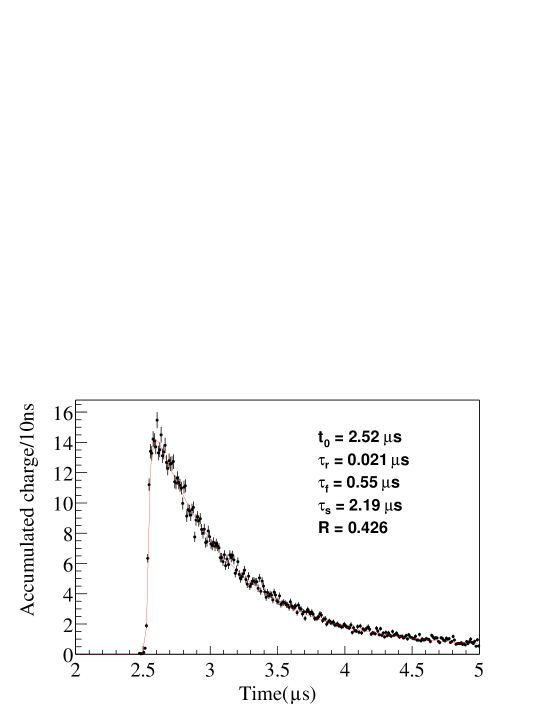
To study the overall timing characteristics of a crystal at low energy, we accumulated whole events for each crystal. Figure 6 shows the accumulated time spectrum of a CsI(Tl-0.073mole%) crystal for neutron induced events, whose measured energy is 4 keV 10 keV. In the figure, the time scale is in , and the timing of the neutron detector was set to 3 .
The timing characteristics of the CsI response can be parameterized by a rise time(), two decay times( and ), and the ratio of slow to fast decay components():
| (3) |
where time zero(), overall normalization(), and the amount of background photoelectrons() are included. The amount of background photoelectrons was estimated from the number of photoelectrons within a 2 s window during the 1 s prior to the event. The constant values were obtained by averaging all the events under analysis, resulting in about 0.1-0.3 photoelectrons per 1 s. The fit was over 10 s even though the figure shows only 5 s. The values of parameters from the fit are shown in Table 2. For the Tl-doped crystals, the rise time is about 20 ns and it has two components of decay times, fast(about 0.54 s) and slow(about 2 s) components. For the Na-doped crystals, the rise time is about 30 ns, the fast decay component is about 0.41 s, and the slow decay component about 2.4 s. The time characteristics of CsI(Na) are similar to those of CsI(Tl) at low energy. This is not an expected feature because it is well known that the decay time of CsI(Na) is much shorter than that of CsI(Tl) at high energy[14].
We do not observe a significant dependence on the doping concentration except for the case of CsI(Tl-0.071mole%). Both CsI(Tl-0.071mole%) and CsI(Tl-0.073mole%) have the same doping material and the same concentration, and the only known difference is the growing method, Kyropoulos(CsI(Tl-0.071mole%)) and Bridgman(CsI(Tl-0.073mole%)). However, it is not clear if different doping methods cause different time characteristics because we tested only one CsI(Tl) crystal made by Kyropoulos method.
4 Pulse Shape Discrimination
4.1 Comparison between nuclear recoil and signals
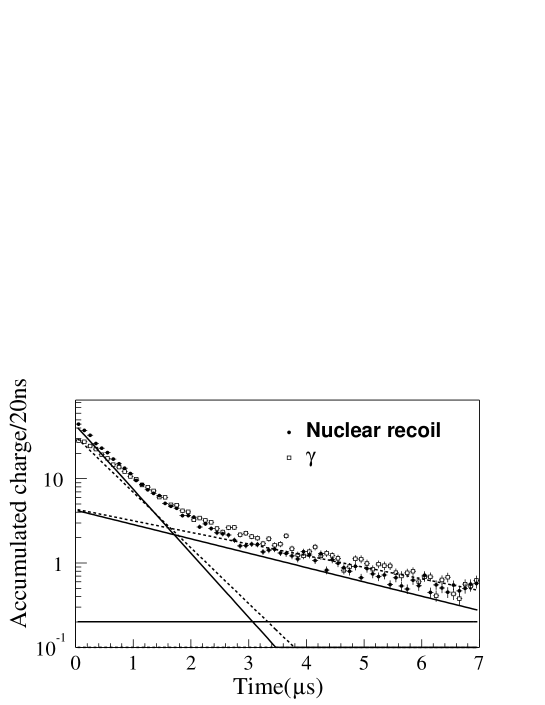
Pulse shape discrimination(PSD) with a CsI crystal is possible due to different timing characteristics between neutron induced (nuclear recoil) and induced events[16]. Figure 7 shows the accumulated time spectrum of a CsI(Tl-0.073mole%) crystal for 4 keV 10 keV, where the time spectrum for events and that for nuclear recoil events are overlaid. For each event, the timing of the first photoelectron was used as . The ambiguity due to improper determination of should affect the time distribution, especially for the low energy event which does not have a sufficient number of photoelectrons. Eq. 4 shows the fit function for the time spectrum, which is similar with Eq. 3. In order to reduce the bias on the determination, the fit was done over 0.3 s. Each component of the time spectrum is drawn as a solid line(nuclear recoil) or a dashed line(). The amount of background photoelectrons for both cases are also shown. The fit shows that nuclear recoil events clearly have a shorter tail than events.
| (4) |
4.2 Quality factor
To quantify the capability for neutron- discrimination among the different crystals, and to evaluate the sensitivity of a WIMP search, a quality factor was defined[17] as
| (5) |
where is the fraction of signal events passing the event selection criteria and is the fraction of background events which passed the same criteria. For an ideal detector, and . Therefore, a smaller quality factor means a better separation between signal and background events.
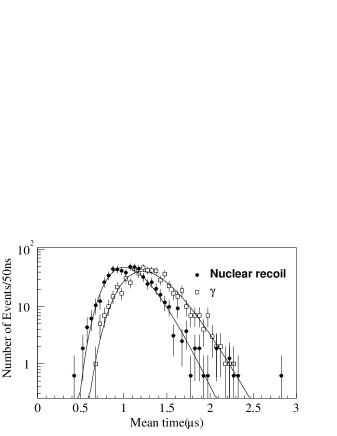
For a simple separation parameter, a mean time is defined as;
| (6) |
where is the charge of the -th cluster, is the time of the -th cluster, and is the time of the first cluster(assumed as time zero). Figure 8 shows the mean time distribution for nuclear recoil and events for a CsI(Tl-0.073mole%) with events between 6 keV 7 keV. Nuclear recoil and events show different mean times. By selecting the proper signal window, we can choose the event sample which maximizes the signal to background ratio.
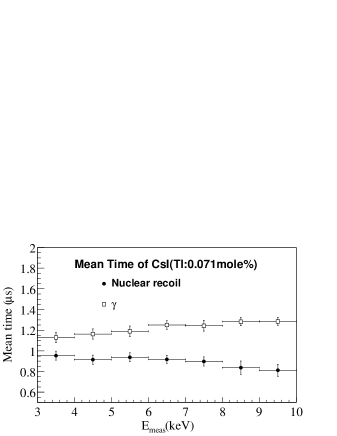
However, due to background photoelectrons which are uniformly distributed, the mean value of the distribution is longer than the real mean time. To estimate the effect of background photoelectrons, the mean value of the mean-time distribution is calculated with the time constants(, , and ) obtained from the fit shown in Eq. 4 for each energy bin. The variance of the mean time distribution is calculated by removing the contribution from the background photoelectrons by assuming a quadratic sum(), where , , and are the variance of the distribution, the background photoelectrons, and the signals, respectively. Figure 9 shows the mean time of the nuclear recoil and events calculated from the time constant of the crystal. The errors are only statistical.
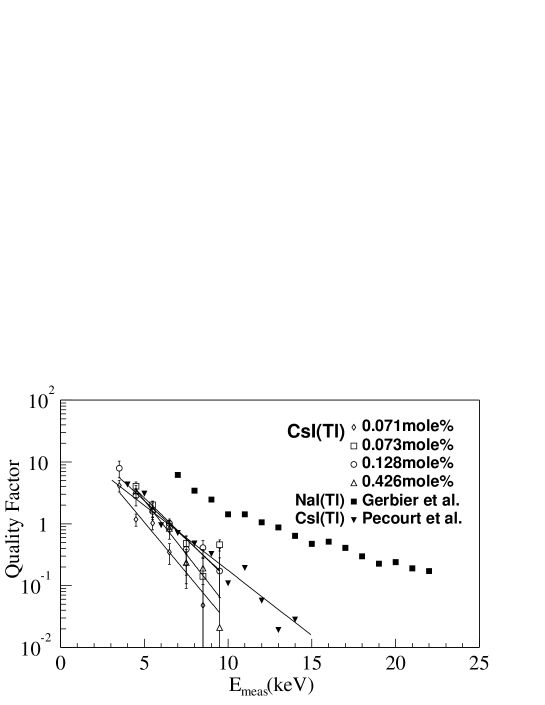
Figure 10 shows the quality factors for CsI(Tl) for various doping concentrations. The results from previous measurements for CsI(Tl)[10] and for NaI(Tl)[18] are overlaid. For CsI(Tl), the present results show a bit more energy dependence than Ref. [10]. However, in the energy region less than 5 keV where most of the WIMP signals are expected, both measurements are comparable. CsI(Tl) shows in comparison to NaI(Tl) about a 10 times smaller quality factor. In our measurement range, we do not observe a significant dependence of the quality factor on doping concentrations.
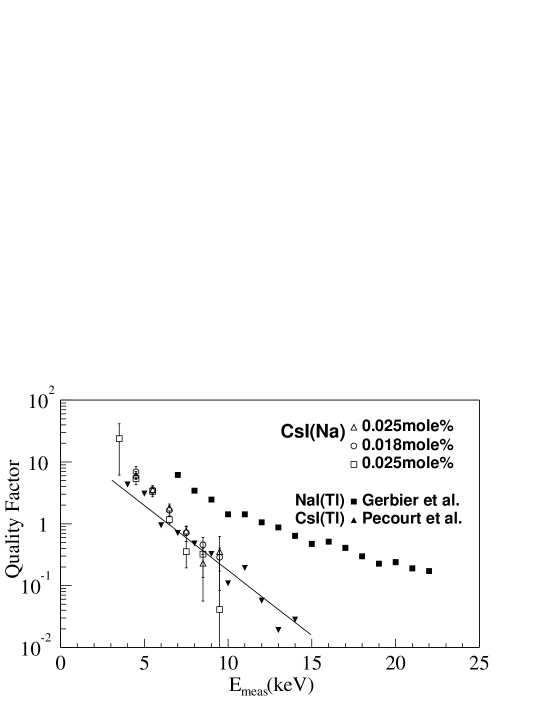
Figure 11 shows quality factors for a CsI(Na) crystal. The quality factor of CsI(Na) is about 2 times larger than that of CsI(Tl), but still about 5-10 times smaller than that of NaI(Tl). The quality factor for a CsI(Na) crystal is about 2-3 times worse than CsI(Tl) crystal in the 7 keV region, and is almost comparable above that region.
5 Quenching factor
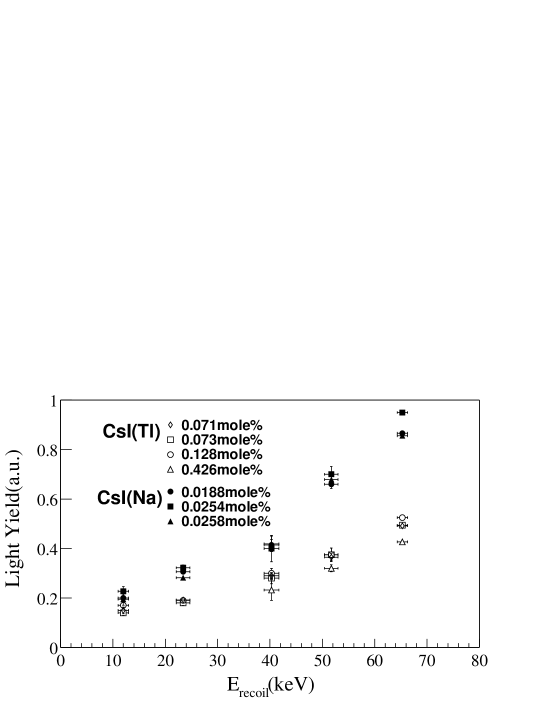
The light yield as a function of recoil energy() for various crystals is shown in Figure 12. The recoil energy is calculated by Eq. 1. As expected, CsI(Na) shows about a 30% larger light yield than CsI(Tl) for the same recoil energy. However, the light yield of the crystals with different doping concentrations are consistent with each other within errors, except for CsI(Tl-0.426mole%), whose light transmission was not good. It seems that the light yield is already saturated as indicated by the doping concentration in our measurement range.
The energy calibration to obtain uses a 5.9 keV X-ray from 55Fe for the CsI(Tl) crystal. Non-linearity of the light yield of the CsI(Tl) crystal at low energy[19] is considered as a systematic error of . For the CsI(Na) crystal, the energy calibration uses a 59.5 keV X-ray from 241Am since CsI(Na) is not sensitive to low energy photons, due perhaps to some unknown surface effect. The response of CsI(Na) is assumed to be linear within our measured energy range because the low energy response( 10 keV), including the non-linearity for CsI(Na), has not yet been studied.
Using and , the quenching factor is calculated to be;
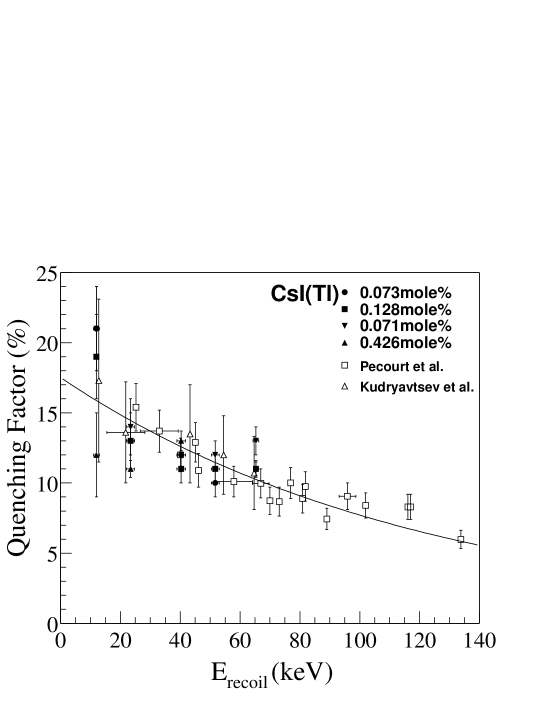
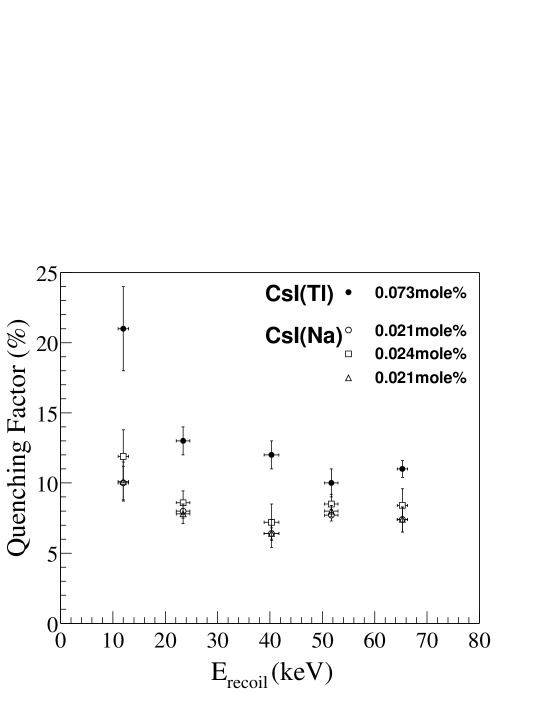
Figure 13 shows that our measured quenching factors for CsI(Tl) are in good agreement with previous measurements[10, 12] within errors. The quenching factors for a Na-doped CsI crystal, which were measured for the first time, are shown in Figure 13. For the comparison, the quenching factors for CsI(Tl-0.071mole%) are shown together. The quenching factor of CsI(Na) is about 50% smaller than that of CsI(Tl).
6 Conclusion
The intensive studies on the response of CsI(Tl) and CsI(Na) crystals were performed at low energies ( 10 keV), and the low energy response for a CsI(Na) crystal is reported for the first time. The pulse shape discrimination(PSD) between and nuclear recoil events was measured and the quality factor was estimated using PSD. The PSD and quality factor for CsI(Tl) are similar to previous measurements. The quality factor for a CsI(Na) crystal is about 2-3 times worse than for a CsI(Tl) crystal in 7 keV region, and almost comparable above that region.
The quenching factor for CsI(Tl) and CsI(Na) crystals of various doping concentrations were also measured. As expected, CsI(Na) shows larger light output than CsI(Tl) even in the low energy region. However, the quenching factor of CsI(Na) for nuclear recoil is about a factor of two smaller than that of CsI(Tl).
Acknowledgments
This work is supported by Creative Research Initiatives Program of Korean Ministry of Science and Technology. We thank Dr. K. D. Kim and other staffs of Korea Institute of Geoscience and Mineral Resources(KIGAM) for their support to the experiment. Also, we thank E. Hungerford for many helpful comments.
References
- [1] Gerard Jungman, Marc Kamionkowski, and Kim Griest, Phys. Rep. 267 (1996) 195.
- [2] R. Bernabei et al., Phys. Lett. B480 (2000) 23.
- [3] N. J. C. Spooner et al., Phys. Lett. B473 (2000) 330.
- [4] R. Abusaidi et al., Phys. Rev. Lett. 84 (2000) 5695.
- [5] M. Altmann et al., The contribution paper to The X International Symposium on Lepton and Photon Interactions at High Energies, July 23, 2001, Rome, Italy.
- [6] P. Di Stefano et al., astro-ph/0004308.
- [7] L. Baudis et al., Phys. Rev. D 59 (1999) 022001.
- [8] J. D. Lewin, P. F. Smith, Astro. Phys. 6 (1996) 87.
- [9] H. J. Kim et al., Nucl. Inst. Meth A457 (2001) 471.
- [10] S. Pécourt et al., Astro. Phys. 11 (1999) 457.
- [11] H. B. Li et al., hep-ex/0001001; M. Z. Wang et al., nucl-ex/0110003.
- [12] V. A. Kudryavtsev et al., hep-ex/0005031.
- [13] R. Brun and F. Rademakers, ROOT - An Object Oriented Data Analysis Framework, Proceedings of AIHENP ’96 Workshop, Lausanne, Sep. 1996; Nucl. Instrum. Methods A389 (1997) 81.
- [14] G. F. Knoll, Radiation Detection and Measurement, 2nd edition, John Willey & Sons, 1989.
- [15] M. J. Hwang et al., to be submitted to Nucl. Instrum. Methods.
- [16] J. B. Birks, The Theory and Practice of Scintillation Counting, p519, Pergamon Press, 1964.
- [17] R. J. Gaitskell et al., Nucl. Phys. Proc. Suppl. 51B (1996) 279.
- [18] G. Gerbier et al., Astro. Phys. 11 (1999) 287.
- [19] P. Dorenbos et al., IEEE Trans. Nucl. Sci. 42 (1995) 2190; W. Mengesha et al., ibid., 45 (1998) 456.
| Doping Material | Concentration(mole%) | Growing method |
| Tl | 0.0730.02 | Bridgman |
| Tl | 0.1280.01 | Bridgman |
| Tl | 0.4260.23 | Bridgman |
| Tl | 0.0710.01 | Kyropoulos |
| Na | 0.0188 | Kyropoulos |
| Na | 0.0254 | Kyropoulos |
| Na | 0.0258 | Kyropoulos |
| Doping(mole%) | (s) | (s) | (s) | R | mean time(s) |
|---|---|---|---|---|---|
| Tl(0.0730.02) | |||||
| Tl(0.1280.01) | |||||
| Tl(0.4260.23) | |||||
| Tl(0.0710.01) | |||||
| Na(0.0188) | |||||
| Na(0.0254) | |||||
| Na(0.0258) |