Caloric Curves and Nuclear Expansion
Abstract
Nuclear caloric curves have been analyzed using an expanding Fermi gas hypothesis to extract average nuclear densities. In this approach the observed flattening of the caloric curves reflects progressively increasing expansion with increasing excitation energy. This expansion results in a corresponding decrease in the density and Fermi energy of the excited system. For nuclei of medium to heavy mass apparent densities are reached at the higher excitation energies.
pacs:
24.10.i,25.70.GhIn a recent paper measurements of nuclear specific heats from a large number of experiments were employed to construct caloric curves for five different regions of nuclear massnatowitz02 . Within experimental uncertainties each of these caloric curves exhibits a plateau region at higher excitation energy. In reference natowitz02, it was pointed out that applying the simple Fermi gas relationship between excitation energy, , and temperature, , for a nucleus of mass ,,
| (1) |
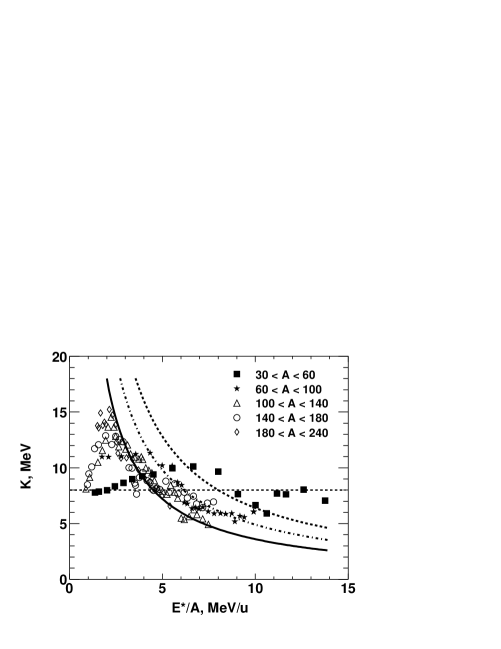
where is the inverse nuclear level density parameter, to a large body of caloric curve data leads, at low excitation energy, to an increase in the apparent value of , followed at higher excitation energies by a rather rapid decrease in the apparent value of natowitz02 ; hasse86 ; bortignon87 ; shlomo90 ; shlomo91 ; natowitz95 . These results are presented in Figure 1. For this figure the data presented in Figure 5 of reference natowitz02, have been smoothed by making a running average of three points adjacent in excitation energy. This reduces the scatter in the points and makes the trends in the data clearer. Together these data span a range of fragmenting system masses .
Previous work has shown that the initial heating of the system leads to a small expansion of the nucleus, the washing out of shell effects and an increase in the nucleon effective masshasse86 ; bortignon87 ; shlomo90 ; shlomo91 ; natowitz95 . This results in a decrease of the nuclear level density, reflected as an increase in the inverse level density parameter, hasse86 ; bortignon87 ; shlomo90 ; shlomo91 ; natowitz95 . The magnitudes of these effects are mass dependentshlomo90 ; shlomo91 . These trends are seen very clearly in Figure 1 at excitation energies MeV/nucleon. However, at excitation energies ranging from MeV/nucleon for the heaviest systems to MeV/nucleon for the lighter systems, the inverse level density parameters start to decrease with increasing excitation energy, reaching low values, near 6 MeV, at the highest excitation. (Exceptions are the three highest points in the A= 100-140 window. As discussed in reference natowitz02, , these data points may indicate onset of a qualitatively different feature but this is not verified by the other data available.)
As can be seen in Figure 1, the general trend of the decrease of is similar to that which results from a temperature which remains constant with increasing excitation energy. This onset of the decrease, reflecting the onset of a plateau in the caloric curves has been taken as the signal of a new behavior. Based on comparisons with calculationshasse86 ; bortignon87 ; shlomo90 ; shlomo91 ; bonche84 we and others have previously described it as a departure from normal Fermi gas behavior.
To explore the nature of that departure in greater detail we note that in the simple, non dissipative, uniform density Fermi gas modelpreston62 the relationship between the thermal excitation energy per nucleon, , the temperature, , and the Fermi energy , , is just
| (2) |
Using the usual expression for a, the Fermi gas level density parameter,
| (3) |
, the inverse level density parameter for an expanded nucleus of equilibrium density, , may be writtennorenberg02
| (4) |
where is the normal nuclear density and is the ratio of the effective mass of the nucleon to the mass of the free nucleon. At the temperatures at which we are interested in using this expression should be close to 1, indicating that the shell effects and collective effects leading to increased level density above that predicted by the Fermi gas model are no longer importanthasse86 ; bortignon87 ; shlomo90 ; shlomo91 . Above the excitation energy where goes to 1, the relative density of a heated uniform Fermi gas at equilibrium can be extracted from the ratio of the apparent inverse level density parameter, , to , the inverse level density parameter for a uniform Fermi gas, with assumed to be 1, at .
| (5) |
We have used this relationship of equation (5) to derive the excitation energy dependence of the relative nuclear density, . We applied this method to the determination of points for each mass region only at excitation energies at and above the entry points into the caloric curve plateaus. These points have been derived from the caloric curves in reference natowitz02, and shown to have a mass dependence consistent with that predicted by calculations which indicate the onset of Coulomb instabilities in the heated nucleusbonche84 ; levit85 ; besprovany89 . In evaluating this expression we have used the Fermi energy determinations of Moniz et al.moniz71 in equation (3) to determine the appropriate reference value of for the mass region being investigated.
To evaluate K() and the density it is required that be determined. We used an iterative technique to derive of / and . This technique consisted of first estimating the relative density as (Kapp/K0)3/2, employing this density estimate to evaluate the binding energy difference associated with expansion and subtracting that from the total excitation energy E∗ to obtain . Using this estimate of allowed a new estimate of K() and density to be made. The process was repeated until self consistent values of and were obtained. The binding energies at different densities were calculated using a liquid drop model mass formulakleban02 with the bulk term extracted from the density and relative neutron excess dependent nuclear matter equation of state of Myers and Swiateckimyers98 . The surface term was scaled as the bulk term and the Coulomb term corrected for the expansion. The binding energy changes evaluated in this way show a near parabolic dependence on density similar to that employed in the Expanding Emitting Source Model of Friedmanfriedman88 . However the absolute values are slightly lower.
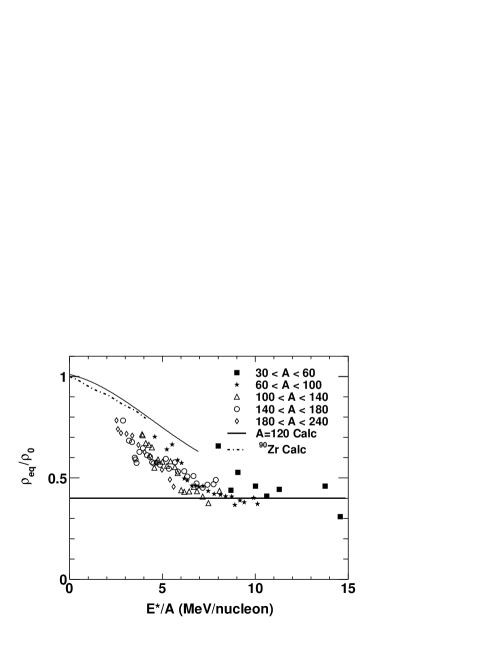
The results, derived from the inverse level density data of Figure 1, are presented in Figure 2 as a plot of relative density, , versus excitation energy per nucleon. While the mass dependence seen in Figure 1 continues to be apparent in Figure 2, the general trend of decreasing nuclear density is similar in each mass region. In the present ansatz, the decreasing values of with excitation energy, seen in figure 1 lead to decreasing nuclear densities. We see that at the entry into the caloric curve plateaus, densities near are indicated. Over a span of a few MeV/nucleon in excitation energy the densities drop into the range of , a value indicated by the thin horizontal line on the figure. At higher excitation the densities extracted in this manner remain near .
Modest expansion is a general feature of calculations focusing on the thermal properties of heated nucleishlomo91 ; bonche84 ; levit85 ; hasan98 . For comparison to the present results we have plotted in Figure 2 calculated average densities derived from the recent finite temperature Hartree-Fock (FTHF) calculations of Hasan and Vary for 90Zrhasan98 and densities for estimated from a model which assumes a trapezoidal density distribution and phenomenological dependencies on temperature derived from previous worksshlomo91 ; shlomo02 . As seen the two results are quite similar. The result of the FTHF calculations are limited to energies below MeV because the model space takes a limited number of oscillator shells in to account. Comparison of the data with these calculations indicates that above the Coulomb instability point the density decreases more rapidly with increasing excitation energy.
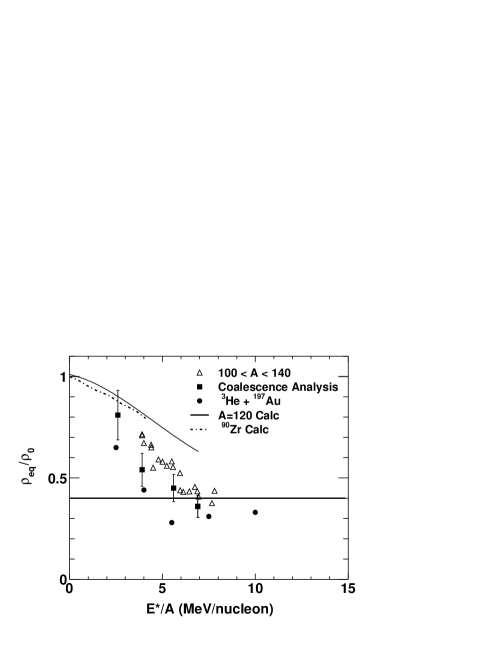
While direct measurement of the size or density of the fragmenting system are difficult to obtain, many previous theoretical and experimental results have suggested that low densities such as those indicated by the present analysis are reached in multi-fragmenting systemssuraud89 ; gross93 ; bondorf85 ; friedman88 ; sugawa99 ; feldmeier00 ; gulminelli97 ; desesquelles98 ; schwarz01 ; cibor00 . We have previously reported average densities deduced from coalescence measurements for fragmenting medium mass nucleicibor00 . In Figure 3, the average densities obtained with that coalescence approach are compared with the present results for the mass region. The average densities indicated by these two independent techniques are seen to be in good agreement. Bracken et al.bracken96 have extracted sizes and average densities versus excitation energy by analyzing barriers for ejectiles in high energy 3He + 197Au collisions. These, also plotted in figure 3, result in slightly lower densities.
In conclusion, it appears that this simple hypothesis of expansion of an equilibrated non-dissipative Fermi gas is sufficiently accurate to allow density information to be derived from reported caloric curve measurements. The present experimental results indicate that, as nuclei are heated, a more rapid rate of expansion with increasing excitation energy commences at the Coulomb instability temperature. This was suggested already in the early work of Bonche, Vautherin and Levitbonche84 ; levit85 . The mass dependence of the Coulomb instability temperature is such that the excitation energy and temperature at which this occurs increases with decreasing mass. At the higher excitation energies densities near are reached. For medium to heavy mass systems, some recent studies have presented evidence for observation of critical behavior in the excitation energy range where the present work indicates a rapid decrease in densityhauger00 ; elliott02 ; kleine02 . The critical temperatures reported in those studies are close to the Coulomb instability temperatures. The influence of the Coulomb energy on observables used to determine the critical point is not completely clarified at presentsrivastava01 ; richert01 .
I Acknowledgements
This work was supported by the U S Department of energy under Grant DE-FG03- 93ER40773 and by the Robert A. Welch Foundation.
References
- (1) J.B. Natowitz, R. Wada, K. Hagel, T Keutgen, M. Murray, Y. G. Ma*, A. Makeev, L. Qin , P. Smith and C. Hamilton, Phys. Rev. C 65, 034618 (2002).
- (2) R. Hasse and P. Schuck, Phys. Lett. B 179, 313 (1986).
- (3) P.F. Bortignon and C.H. Dasso, Phys. Lett. B189, 381 (1987).
- (4) S. Shlomo and J.B. Natowitz, Phys. Lett. B252, 187 (1990).
- (5) S. Shlomo and J.B. Natowitz, Phys. Rev. C 44, 2878 (1991).
- (6) J.B. Natowitz, D. Fabris, F. Haddad, K. Hagel, J. Li, Y. Lou, N. Mdeiwayeh, G. Nebbia, G. Prete, R. Tezkratt, D. Utley, G. Viesti, R. Wada and B. Xiao. Proceedings of the Nuclear Chemistry Award Symposium, 209th Meeting of the American Chemical Society, Anaheim, World Scientific Press, Singapore, (1995) p 1.
- (7) P. Bonche, S. Levit and H. Vautherin, Nucl. Phys. A427, 278 (1984); Ibid, A436, 265 (1986).
- (8) M.A. Preston, Physics of the Nucleus, Addison-Wesley Publishing Company, Massachusetts (1962) p 125.
- (9) W. Norenberg, G. Papp and P. Rozmej GSI Preprint 2002-3, January, 2002 B.
- (10) S.Levit and P.Bonche, Nucl. Phys. A437, 426 (1985).
- (11) J. Besprovany and S. Levit Phys. Lett. B217, 1 (1989).
- (12) E. J. Moniz, I. Sick, R.R. Whitney, JR Ficenec, R.P. Kephart, W. Trower, Phys. Rev. Lett. 26, 445 (1971).
- (13) M. Kleban, B. NerloPomorska, J. F. Berger, J. Dechargé, M. Girod, and S. Hilaire, Phys. Rev. C 65, 024309 (2002).
- (14) W. D. Myers and W. J. Swiatecki, Phys. Rev. C 57, 3020 (1998).
- (15) W. A. Friedman, Phys. Rev. Lett. 60, 2125 (1988).
- (16) M. A. Hasan and J. P. Vary, Phys. Rev. C 58, 2754 (1998).
- (17) S. Shlomo, private communication.
- (18) E. Suraud, C. Gregoire and B. Tamain, Prog Part and Nucl. Phys. 23, 357 (1989) and references therein.
- (19) D. Gross et al., Prog. Part.and Nucl. Phys. 30, 155 (1993) and references therein.
- (20) J. Bondorf et al., Nucl. Phys. A433, 321 (1985).
- (21) Y. Sugawa and H. Horiuchi, Phys. Rev. C 60, 607 (1999).
- (22) H. Feldmeier and J. Schnack, Rev. Mod. Phys. 72, 655 (2000).
- (23) F. Gulminelli and D. Durand, Nucl. Phys. A615, 117 (1997).
- (24) P. Desesquelles, M. D’Agostino, A. S. Botvina, M. Bruno, N. Colonna, A. Ferrero, M. L. Fiandri, E. Fuschini, F. Gramegna, I. Iori, G. V. Margagliotti, P. F. Mastinu, P. M. Milazzo, A. Moroni, F. Petruzzelli, R. Rui, G. Vannini, J. D. Dinius, C. K. Gelbke, T. Glasmacher, D.O. Handzy, W. C. Hsi, M. Huang, M. A. Lisa, W. G. Lynch, C. P. Montoya, G. F. Peaslee, L. Phair, C. Schwarz, M.B. Tsang and C. Williams, Nucl. Phys. A633, 547 (1998).
- (25) C. Schwarz, S. Fritz, R. Bassini, M. Begemann-Blaich, S.J. Gaff-Ejakov, D. Gourio, G. C ross, G. Imme, I. Iori, U. Kleinevoss, G. J. Kunde, W.D. Kunze, U. Lynen, V. Maddalena, M. Mahi, T. Mohlenkamp, A. Moroni, W.F.J. Muller, C. Nociforo, B. Ocker, T. Odeh, F. Petruzzelli, J. Pochodzalla, G. Raciti, G. Riccobene, F.P. Romano, A. Saija, M. Schnittker, A. Schuttauf, W. Seidel, V. Serfling, C. Sfienti, W. Trautmann, A. Trzcinski, G. Verde, A. Worner, H.F. Xi and B. Zwieglinski, Nucl. Phys. A681, 279 (2001).
- (26) J. Cibor, R. Wada, K. Hagel, M. Lunardon, N. Marie, R. Alfaro, W. Q. Shen, B. Xiao, Y. Zhao, J. Li, B. A. Li, M. Murray, J. B. Natowitz, Z. Majka and P. Staszel, Phys. Lett. B473, 29 (2000).
- (27) D. Bracken, Thesis, Indiana University (1996), To be published.
- (28) J. A. Hauger, B. K. Srivastava, S. Albergo, F. Bieser, F. P. Brady, Z. Caccia, D. A. Cebra, A. D. Chacon, J. L. Chance, Y. Choi, S. Costa, J. B. Elliott,1, M. L. Gilkes, A. S. Hirsch, E. L. Hjort, A. Insolia, M. Justice, D. Keane, J. C. Kintner, V. Lindenstruth, M. A. Lisa, H. S. Matis, M. McMahan, C. McParland, W. F. J. Mueller, D. L. Olson, M. D. Partlan, N. T. Porile, R. Potenza, G. Rai, J. Rasmussen, H. G. Ritter, J. Romanski, J. L. Romero, G. V. Russo, H. Sann, R. P. Scharenberg, A. Scott, Y. Shao, T. J. M. Symons, M. Tincknell, C. Tuve , S. Wang, P. Warren, H. H. Wieman, T. Wienold, and K. Wolf, Phys. Rev. C 62, 024616 (2000).
- (29) J. B. Elliott, L. G. Moretto, L. Phair, G. J. Wozniak, T. Lefort, L. Beaulieu, K. Kwiatkowski, W.-C. Hsi, L. Pienkowski, H. Breuer, R. G. Korteling, R. Laforest, E. Martin, E. Ramakrishnan, D. Rowland, A. Ruangma, V. E. Viola, E. Winchester, S. J. Yennello Preprint LBNL-47711, Phys. Rev. Lett. 88, 042701 (2002)
- (30) M. Kleine Berkenbusch, W. Bauer, K. Dillman, and S. Pratt, L. Beaulieu, K. Kwiatkowski, T. Lefort, W.-c. Hsi, and V. E. Viola, S. J. Yennello, R. G. Korteling and H. Breuer, Phys. Rev. Lett. 88, 022701 (2002).
- (31) B. K. Srivastava, S. Albergo, F. Bieser, F. P. Brady, Z. Caccia, D. A. Cebra, A. D. Chacon, J. L. Chance, Y. Choi, S.Costa, J. B. Elliott, M. L. Gilkes, J. A. Hauger, A. S. Hirsch, E. L. Hjort, A. Insolia, M. Justice, D. Keane, J. C. Kintner, V. Lindenstruth, M. A. Lisa, H. S. Matis, M. McMahan, C. McParland, W. F. J. Müller, D. L. Olson, M. D. Partlan, N. T. Porile, R. Potenza, G. Rai, J. Rasmussen, H. G. Ritter, J. Romanski, J. L. Romero, G. V. Russo, H. Sann, R. P. Scharenberg, A. Scott, Y. Shao, T. J. M. Symons, M. Tincknell, C. Tuv , S. Wang, P. Warren,H. H. Wieman, T. Wienold, and K. Wolf, Phys. Rev. C 64, 041605(R) (2001).
- (32) J. Richert, and P. Wagner, Phys. Rep. 350, 1 (2001).