The reaction 2H(p,pp)n in three kinematical configurations at Ep = 16 MeV
Abstract
We measured the cross sections of the 2H(p,pp)n breakup reaction at Ep=16 MeV in three kinematical configurations: the np final-state interaction (FSI), the co-planar star (CST), and an intermediate-star (IST) geometry. The cross sections are compared with theoretical predictions based on the CD Bonn potential alone and combined with the updated 2-exchange Tucson-Melbourne three-nucleon force (TM99’), calculated without inclusion of the Coulomb interaction. The resulting excellent agreement between data and pure CD Bonn predictions in the FSI testifies to the smallness of three-nucleon force (3NF) effects as well as the insignificance of the Coulomb force for this particular configuration and energy. The CST also agrees well whereas the IST results show small deviations between measurements and theory seen before in the pd breakup space-star geometries which point to possible Coulomb effects. An additional comparison with EFT predictions (without 3NF) up to order N3LO shows excellent agreement in the FSI case and a rather similar agreement as for CD Bonn in the CST and IST situations.
I Introduction
The three-nucleon system has for a long time been the testing ground for nucleon-nucleon forces as they act in the lightest systems composed of nucleons. State of the art calculations – using Faddeev techniques in momentum space – of the three-nucleon scattering allow the comparison of numerically exact theoretical predictions with a wide range of observables such as elastic or breakup cross sections and polarization data. Though the overall agreement between theory and experiment is rather good there remain certain discrepanciesglo96 . The most prominent one is the drastic underestimation by all modern NN potentials of the vector analyzing power in low-energy (i.e. at energies below 25 MeV) nucleon-deuteron (Nd) elastic scatteringglo96 . Both in the proton-deuteron (pd) and neutron-deuteron (nd) reactions theory lies about 30% below the data in the angular region of the analyzing power maximumwit94 ; kij95 ; kij96 . Also the minima of the Nd elastic scattering angular distributions for laboratory energies starting from about MeV are underestimated by pure two-nucleon (2N) force Faddeev calculationswit98 ; nem98 .
For the breakup process the low-energy nd space-star configuration in which all three nucleons are emerging in the c.m. system with equal momenta in a plane perpendicular to the incoming beam direction presents a puzzle. Modern NN forces give too small nd space-star cross sections at low energiesste89 ; str89 ; geb93 ; set96 ; zho01 . On the other hand, in this energy region the pd breakup data are systematically below the theoretical nd predictions thus pointing to the importance of Coulomb effects rau91 ; gro96 ; pat96 ; ish03 .
With a recent measurement of the nd breakup in an nn quasi-free scattering configuration vwi02 , together with earlier unpublished Bochum data lub92 , a new discepancy may show up. It is remarkable that recent predictions using the chiral perturbation theory approach do not remedy the situation epe02 .
These discrepancies point to the necessity of including new ingredients in addition to the “standard” two-body input into the 3N continuum calculations such as e.g. three-body forces. However, present-day 3NF’s show only small effects on the low-energy elastic scattering vector analyzing power tor98 . On the other hand, adding the -exchange Tucson-Melbourne (TM) 3NF coo79 ; coo81 , adjusted to reproduce the experimental triton binding energy nog97 , fills in the cross section minima at higher energieswit98 .
Whereas good systematic studies exist for the symmetric space star (SST), the IST and CST configurations have not yet been explored in the pd breakup at low energies. Therefore, kinematically complete cross section measurements in these configurations were performed. In addition, because in former investigations at other energies glo96 ; rau91 ; gro96 ; pae01 there has been very good agreement between 2H(n,nn)1H and 2H(p,pp)n data themselves as well as when compared with results from modern Faddeev calculations with realistic NN potentials for FSI geometry we measured it simultaneously.
In section II we shortly describe the underlying theory. In section III and IV the details of the experiment and of the data analysis are given. The resulting data are compared to the theory in section V. We summarize in section VI.
II Theory
The theoretical predictions presented in this work are based on solutions of 3N Faddeev equations in momentum space using a realistic NN interaction alone and combined with a 3N force.
The long-range Coulomb force acting between two protons is totally neglected. In the following we give a short outlook of the underlying formalism and of the numerical performance. For more details we refer to glo96 ; wit88 ; glo83 ; hue93 ; hue97 , and references therein.
The break-up operator sums up all multiple scattering contributions, which originate from the interactions of three nucleons via 2N and 3N forces, through the integral equation hue97
| (1) |
Here is the NN -matrix , is the free 3N propagator, and is the sum of a cyclical and anticyclical permutations of three objects. The 3NF is split into three parts
| (2) |
where each one is symmetrical under the exchange of two particles. For instance, in the case of exchange 3NFcoo79 ,coo81 , such a decomposition corresponds to the three possible choices of the nucleon undergoing off-shell scattering.
The transition operator for the breakup process can be expressed in terms of a operator as glo96 , hue97
| (3) |
We solved Eq.(1) in a partial-wave projected momentum-space basis at the nucleon laboratory energy MeV using the modern CD Bonn mac96 interaction. This interaction reproduces the NN data set with a high accuracy as measured by a /datum very close to 1. In the calculations all partial-wave states with total angular momenta in the two-nucleon subsystem up to were taken into account. We checked that this restriction is sufficient at the energy of the present study. In the calculations charge independence breaking (CIB) of the NN interaction in the state was taken into account by including the total 3N isospin T=3/2 contribution in this particular partial wave and using pp and np CD Bonn interactions wit81 .
To check the magnitude of 3NF effects we combined the CD Bonn potential with the updated version of the TM 3NF (TM99’) fri99 ; coo01 . In this calculation we neglected the total isospin T=3/2 contribution in the state. Such a restriction to the np force for the state does not have a significant effect on the CST and IST cross sections but is decisive for the np FSI cross sections.
In recent years significant progress has been achieved towards a deeper understanding of the low-energy nuclear dynamics within the chiral Effective Field Theory (EFT) framework. This approach is based upon the approximate and spontaneously broken chiral symmetry of Quantum Chromodynamics. As shown by Weinberg Weinb91 in the early 1990’s, nuclear forces can be systematically derived within the chiral expansion. The smallness parameter is given by the ratio of a generic low-momentum scale corresponding to external nucleon momenta or the pion mass to a hard scale associated with the -mass. Very promising results have already been achieved for few-nucleon systems in this framework, see e.g. epe02 ; epe01 ; EM03 ; Ep04 . For a recent review on this and related topics the reader is referred to BvK . While in our previous studies only np forces have been worked out, in Ep04 ; epe03_2 also isospin breaking effects have been included and thus nn, np and pp forces are now available. Further, we have used a novel regularization scheme for pion-loop integrals proposed in epe03 , which allows for a better separation between the long- and short-distance contributions compared to dimensional regularization. In the present work, we apply for the first time pp and np forces at next-to-leading order (NLO), next-to-next-to-leading order (N2LO) and next-to-next-to-next-to-leading order (N3LO) in the chiral expansion from Ep04 ; epe03_2 to study 3N scattering. We remind the reader that chiral 3N forces should be taken into account at N2LO and N3LO. In fact, one important advantage of the EFT framework compared to the conventional approach is attributed to the fact, that it allows to include three- and more-nucleon forces consistent with the NN interactions. The inclusion of the chiral 3N forces at N2LO and, especially, at N3LO requires, however, additional quite extended work and will be deferred to upcoming publications. It should, therefore, be understood, that the EFT results at N2LO and N3LO presented in this work are incomplete. We, nevertheless, think that it is justified to present already the EFT predictions based solely on the NN force for three consecutive orders in the chiral expansion. We also remind the reader that, at least for conventional interactions, the effects of the 3N force for the observables considered are rather modest.
III Experiment
The measurements were performed at the Cologne FN tandem Van de Graaff accelerator facility. The unpolarized protons were produced by a sputter ion source and accelerated to a laboratory energy of 16.0 MeV. We used typical beam currents of 150 nA focussed into a beam spot of 2 mm diameter inside an Ortec 2800 scattering chamber. Behind the scattering chamber the beamline was terminated by a Faraday cup.
The target foils used in our measurement consisted of solid deuterated polyethylene with a thickness of and a carbon backing layer of on each side and were mounted in a triple target holder. Rotation of the targets with about 700 rpm provided for much increased target lifetime. For the detection of protons of the pd breakup reaction and the elastic and inelastic proton scattering from carbon we used 2000 m thick room-temperature silicon surface barrier detectors with an energy resolution of better than 50keV (FWHM). The detectors were positioned with an accuracy of 0.1˚ and 1 mm in the scattering chamber in a symmetrical arrangement for 23 coincidences. Table 1 shows the scattering angles for all coincidence detectors. Fig. 2 shows the calculated kinematical loci for the three experimental situations.
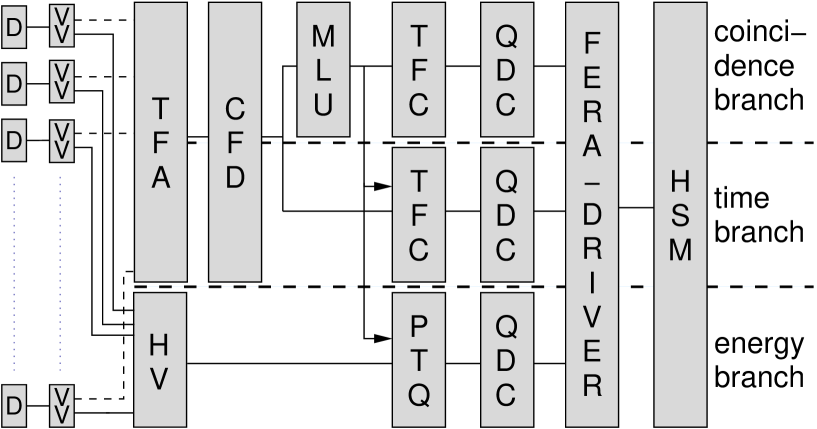
Two additional detectors at a laboratory angle of = 30, = 0 and 180 served as monitors for the absolute normalization of the breakup cross section. Each detector had a total counting rate of less than 8kHz and therefore no significant dead-time or pile-up effects occurred. The signals from all detectors were processed simultaneously by our new coincidence electronics and recorded in list mode on magnetic tape. A block diagram of the electronics is shown in Fig. 1.
The main features of this new setup are the use of QDCs (charge-to-digital converters) and an MLU (memory look-up unit) wich allows free programming of arbitrary coincidences between up to 16 detectors in very short time.
Each coincidence event consisted of a logical status word containing the kinematical configuration, the energies and the time-of-flight differences of the particles detected. In order to control the experiment on-line, the software package PAW (Physics Analyzing Workstation) cer95 was used. The coincidence events were checked by incrementing and displaying two-dimensional energy spectra, background-corrected S-curve projections, and distance-parameter spectra.
IV Data Analysis
The coincidence events were stored as triplets () event by event on magnetic tape together with a status word. At vanishing angular- and energy-resolutions in a kinematically complete measurement the breakup events appear on ideal point-geometry kinematical loci in the plane. The measured events scatter around these ideal (point-geometry) kinematical loci mainly due to finite detector apertures.
For the projection of the breakup events onto the kinematical curve (S curve) we assumed a two-dimensional Gaussian distribution of the data around this curve. Therefore the correct projection of a true () event was done by assigning it the proper location on the point-geometry kinematical curve by using “reference matrices”. For every event in the calibrated , plane they contain the numerically calculated information about the shortest distance to the S curve.
IV.1 Time-difference spectra and background subtraction
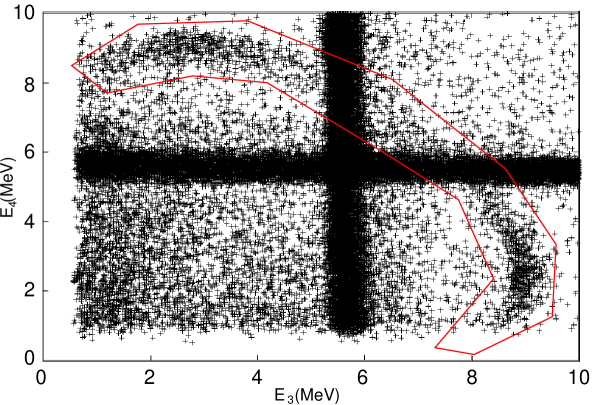
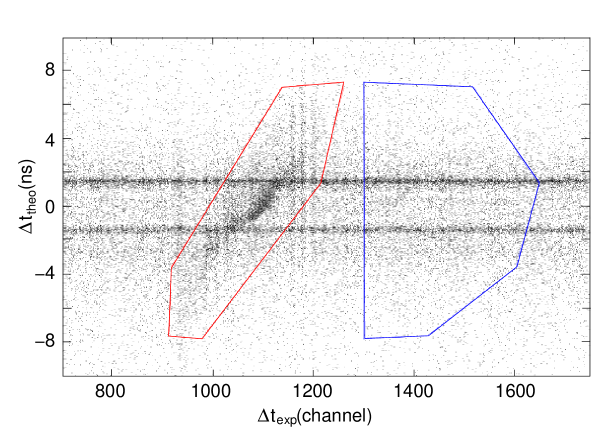
Fig. 3 shows a typical E3, E4 event matrix with true coincident events along the kinematical locus and background from accidental coincidences. This background consisted mainly of random coincidences due to elastic scattering and reactions with the target nuclei and and truly random coincidences from various sources. The background-correction procedure is based on methods similar to those described in pat96 ; gol83 ; prz99 and is therefore summarized briefly. First time-of-flight differences are calculated from the known distances of the detectors to the target and under the assumption that the particle masses were those of the detected nucleons of the pd breakup. Thus a linear relation between the calculated and measured time-of-flight differences is expected. When building two-dimensional time-difference matrices by sorting the events according to their calculated time-of-flight differences and the directly measured time-of-flight differences (Fig. 4) the true breakup events therefore produce a straight ridge above the uniformly distributed random coincidence events. The smaller enclosed region on the left in Fig. 4 encompasses this peak but also contains a contribution from random coincidences which has to be subtracted. The larger polygon marked C(r) contains only random events. It has the area of the “true + random” polygon C(tr+r) suitably enlarged by a factor V in the texp direction (with V as large as possible). The error from the random-background subtraction enters only with this reduction factor V.
IV.2 Distance-parameter spectra
In order to subtract the accidental background properly all events in the two time-difference windows at a given distance from the kinematical locus are summed up along this curve. The “true” distance-parameter spectrum is obtained by subtracting the “accidental” from the “true+accidental” spectrum. Only events between the dotted lines are then used for projections onto the S curve.
IV.3 S-curve projection
Thus, after application of our projection procedure to both regions C(tr+r) and C(r) the number of true pd breakup events is given by
| (4) |
with a statistical error of
| (5) |
where refers to discrete bins with this width on the S curve.
As discussed in prz99 the choice of the binning width
is – within certain
limits – somewhat arbitrary but should be governed by the criterion that narrow
structures such as the FSI peaks should not be distorted. Here a bin width
of 200 keV was chosen.
The yields of our S-curve spectra were normalized using the relation
| (6) |
where denotes the differential cross section of the monitor reaction, is the solid angle of the monitor detector and is the background and dead-time corrected monitor peak intensity. is the true (i.e. background and dead-time corrected) pd breakup intensity over an interval of the arc length S. and are the solid angles of the coincidence detectors. We used the monitor reaction 2H(p,p)2H for which the elastic scattering cross section was published cah71 ; sag94 . A typical monitor spectrum used for calibration is shown in Fig. 5. Explicitly we used the elastic scattering cross section value at 16.0 MeV and =30 of
| (7) |
The errors of the results for the breakup cross section are of different origins. The main systematic error is due to the normalization cross section and the errors of the solid angles. Additionally we have another systematic error from the projection procedure due to the distribution of the breakup events around the kinematical point-geometry loci and uncertainties of their assignment to the correct location there. Therefore we had to choose a maximum distance from the S curve within which the true breakup events were expected. We took a distance of typically 0.8 MeV.
The possible loss of breakup events due to these cuts was checked by varying the maximum distance from the S curve. For the true breakup events this loss is less than 1%. Statistical errors were assumed to originate from the absolute breakup yield and the background subtraction. These errors depend on the bin width chosen; in our case with = 400 keV (CST, IST) and 200 keV (FSI) typical relative errors between 1 and 3% were assigned. A study of the effects of averaging over the finite target-detector geometry showed that only in the FSI situation and only at the FSI peaks proper the cross section is lowered by at most 1.2%. Therefore, here the comparison is made with point-geometry calculations only.
V Results and Discussion
We compare our data with theoretical predictions in two ways; one is the “classical” Faddeev calculation using modern precision NN potentials, with and without a three-nucleon force, the other a new effective-field theory (EFT) calculation up to order N3LO.
V.1 Comparison to Faddeev calculations with CD Bonn and TM99’
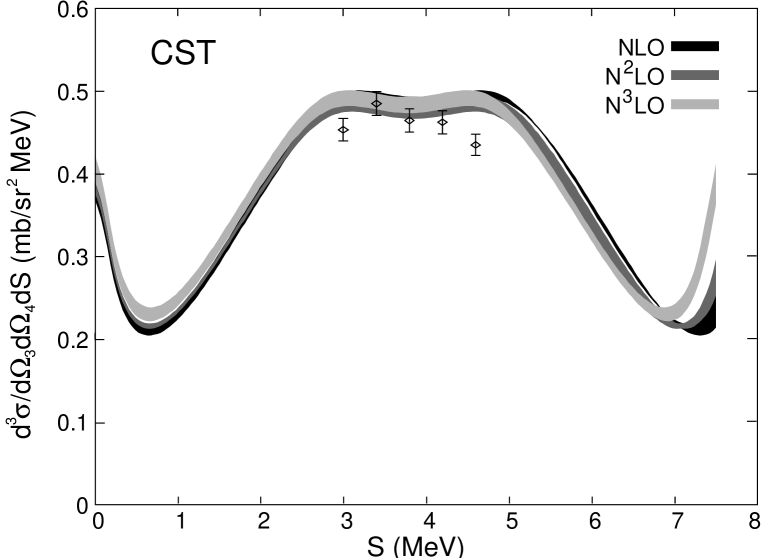
Since the results of a number of former systematic studies had shown that in the present breakup configurations the use of different modern precision potentials leads to very small cross-section changes we compare our results to Faddeev calculations with the CD Bonn potential only. For the 3NF the modified Tucson-Melbourne TM99’ force is used. In the following three figures also the percentage deviation of the cross sections caused by the TM99’ 3NF is shown.
| (8) |
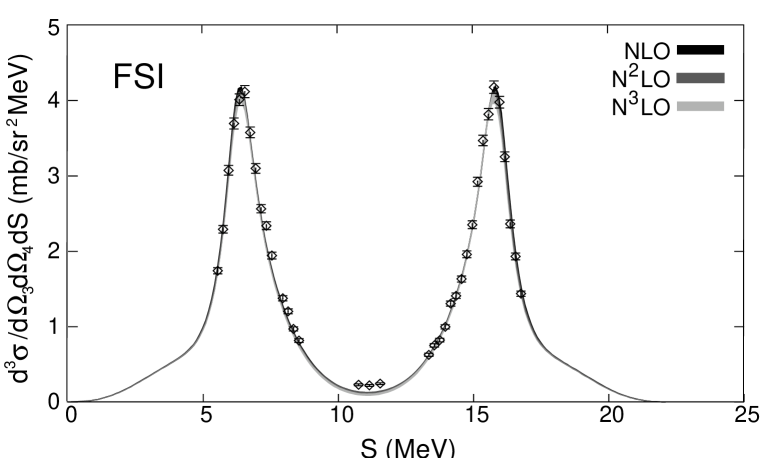
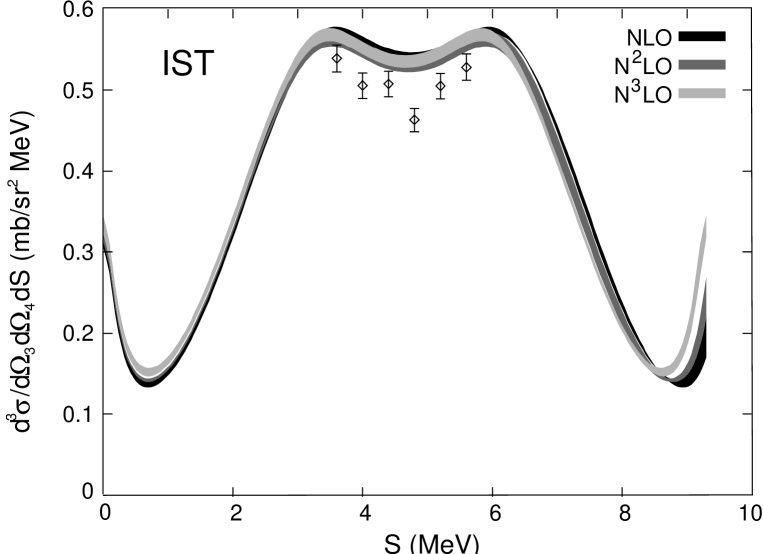
In Figs. 7, 8, and 6 we present our pd breakup cross-section data for the CST, the IST, and the FSI situations and compare them to point-geometry theoretical predictions. The agreement between experiment and theory is excellent for the FSI and CST situations which would suggest that at these FSI and CST situations Coulomb-force effects do not play a significant role. In the IST there is a slight overestimate of the theory over the data which may be caused by Coulomb effects not contained in the theory.
It is seen that the effects of the TM99’ 3NF are very small for most regions of the S-curve. For the FSI peaks and CST and IST geometries the changes of the cross section caused by the TM99’ 3NF are smaller than . Only in the region of the S-curve between two np FSI peaks effects of up to are seen and the TM99’ brings the theory closer to data.
Finite-geometry corrections in the CST and IST configurations proved to be insignificant. In the FSI situation there is a small (1.2%) averaging effect in the relatively narrow structures of the FSI peaks proper which does not affect significantly the excellent agreement between the data and the predictions.
V.2 Comparison to EFT predictions
It is interesting that the EFT calculations in all orders also show excellent agreement with the data in the FSI situation. In the very limited S range of the data in the two other situations the NLO prediction is significantly above, whereas the N2LO prediction is pretty close to the data, like in the case of CD-Bonn. Note that in the order N2LO the EFT 3N forces are not yet included, which therefore is a preliminary and inconsistent result. In the case of N3LO, again without the EFT 3N forces, the bandwidth is somewhat larger than for N2LO and there is a slight tendency for the predictions to lie above the N2LO ones. Since in both cases, N2LO and N3LO, there is underbinding for 3H, one can possibly expect, like for the conventional forces, that the inclusion of the proper EFT 3N forces will shift the predictions downwards. The underbinding at N3LO is stronger than for N2LO, which might compensate the slightly higher values in N3LO compared to N2LO.
Substantial differences between different orders show up in regions of the S curve which have not been accessible to this experiment. A quantitative comparison reveals that the conventional force predictions lie close to the lower border of the N3LO predictions in the minima.
VI Summary
We present new deuteron breakup cross-section data for the np FSI configuration, a coplanar star and an intermediate-star configuration. The data are compared to predictions from nd breakup Faddeev calculations using the CD Bonn potential with and without the TM99’ three-nucleon force, as well as with predictions from EFT which, however, in the case of N2LO and N3LO, are still preliminary, since 3N forces at these orders required for consistency reasons are not yet included.
Comparison with earlier results suggests that the good agreement between the data and theoretical predictions for the FSI situation follows the known systematics in this energy region and therefore should also apply for the analogue neutron-deuteron breakup. There is good agreement in the coplanar-star situation, but this may be fortuitous in view of the missing Coulomb interaction in the theoretical prediction. The slight overestimate of the data by the theory in the intermediate-star situation reminds of the space-star situation studied earlier, see e.g. pae01 . The EFT predictions are in excellent agreement with the data only for the FSI configuration. In the case of the CST and IST situations the N2LO predictions are rather close to the ones of CD-Bonn, but that result has to be regarded as preliminary since the 3N force contributions required for consistency reasons are still missing. This is even more the case for N3LO since there the 3H underbinding without proper 3N forces is larger than for N2LO. Calculations including those proper 3N forces are underway.
Acknowledgements
This work was supported by the Polish Committee for Scientific Research under grant no. 2P03B00825, and by DOE under grants nos. DE-FG03-00ER41132 and DE-FC02-01ER41187. This work was also supported by the U.S. Department of Energy Contract No. DE-AC05-84ER40150 under which the Southeastern Universities Research Association (SURA) operates the Thomas Jefferson Accelerator Facility. The numerical calculations have been performed on the Cray SV1 and T3E of the NIC in Jülich, Germany.
References
- (1) W. Glöckle, H. Witała, D. Hüber, H. Kamada, and J. Golak, Phys. Rep. 274, 107 (1996).
- (2) H. Witała, D. Hüber, and W. Glöckle, Phys. Rev. C49, R14 (1994).
- (3) A. Kievsky, M. Viviani, and S. Rosati, Phys. Rev. C52, R15 (1995).
- (4) A. Kievsky, S. Rosati, W. Tornow, and M. Viviani, Nucl. Phys. A607, 402 (1996).
- (5) H. Witała, W. Glöckle, D. Hüber, J. Golak, and H. Kamada, Phys. Rev. Lett. 81, 1183 (1998).
- (6) S. Nemoto, K. Chmielewski, S. Oryu, and P.U. Sauer, Phys. Rev. C58, 2599 (1998).
- (7) M. Stephan, K. Bodek, J. Krug, W. Lübcke, S. Obermanns, H. Rühl, M. Steinke, D. Kamke, H. Witała, Th. Cornelius, and W. Glöckle, Phys. Rev. C39, 2133 (1989).
- (8) J. Strate, K. Geissdörfer, R. Lin, W. Bielmeier, J. Cub, A. Ebneth, E. Finckh, H. Friess, G. Fuchs, K. Gebhardt, S. Schindler, Nucl. Phys. A 501, 51 (1989).
- (9) K. Gebhardt, W. Jaeger, C. Jeitner, M. Vitz, E. Finckh, T. N. Frank, Th. Januschke, W. Sandhas, H. Haberzettl, Nucl. Phys. A 561, 232 (1993).
- (10) H.R. Setze, C.R. Howell, W. Tornow, R.T. Braun, W. Glöckle, A.H. Hussein, J.M. Lambert, G. Mertens, C.D. Roper, F. Salinas, I. Šlaus, D.E. Gonzales Trotter, B. Vlahovic, R. L. Walter, and H. Witała, Phys. Lett. B388, 229 (1996).
- (11) Z. Zhou, A.S. Crowell, J. Deng, W. Glöckle, C.R. Howell, H. Kamada, B. Qi, R.A. Macri, X. Ruan, H. Tang, R.L. Walter, and H. Witała, Nucl. Phys. A684 545c (2001).
- (12) G. Rauprich, S. Lemaître, P. Niessen, K.R. Nyga, R. Reckenfelderbäumer, L. Sydow, H. Paetz gen. Schieck , H. Witała, and W. Glöckle, Nucl. Phys. A535, 313 (1991).
- (13) R. Großmann, G. Nitzsche, H. Patberg, L. Sydow, S. Vohl, H. Paetz gen. Schieck, J. Golak, H. Witała, W. Glöckle, and D. Hüber, Nucl. Phys. A603, 161 (1996).
- (14) H. Patberg, R. Großmann, G. Nitzsche, L. Sydow, S. Vohl, and H. Paetz gen. Schieck, Phys. Rev. C53, 1497 (1996).
- (15) Search for Space Star Anomaly in pd Breakup Reaction at 13 MeV, T. Ishida, T. Yagita, S. Ochi, S. Nozoe, K. Tsuruta, F. Nakamura, H. P. g. Schieck and K. Sagara, Mod. Phys. Lett. A18, 436 (2003).
- (16) A. Siepe, J. Deng, V. Huhn, L. Wätzold, C. Weber, W. von Witsch, H. Witała, W. Glöckle, Phys. Rev. C65, 034010 (2002).
- (17) W. Lübcke, Dissertation, University of Bochum, 1992, unpublished.
- (18) E. Epelbaum, A. Nogga, W. Glöckle, H. Kamada, U.-G. Meißner, H. Witała, Phys. Rev. C66, 064001 (2002).
- (19) W. Tornow, H. Witała, and A. Kievsky, Phys. Rev. C57, 555 (1998).
- (20) S. A. Coon, M. D. Scadron, P. C. McNamee, B. R. Barrett, D. W. E. Blatt, and B. H. J. McKellar, Nucl. Phys. A317, 242 (1979).
- (21) S. A. Coon, W. Glöckle, Phys. Rev. C23, 1790 (1981).
- (22) A. Nogga, D. Hüber, H. Kamada, and W. Glöckle, Phys. Lett. B409, 19 (1997).
- (23) H. Paetz gen. Schieck, H. Witała, J. Golak, J. Kuroś, R. Skibiński, Few-Body Systems 30, 81 (2001). Phys. Rev. C23, 1790 (1981).
- (24) H. Witała, Th. Cornelius, and W. Glöckle, Few-Body Syst. 3, 123 (1988).
- (25) W. Glöckle, The Quantum Mechanical Few-Body Problem, Springer-Verlag, Berlin/Heidelberg 1983.
- (26) D. Hüber, H. Witała, and W. Glöckle, Few-Body Syst. 14, 171 (1993).
- (27) D. Hüber, H. Kamada, H. Witała, and W. Glöckle, Acta. Phys. Pol. B28, 1677 (1997).
- (28) R. Machleidt, F. Samarucca, Y. Song, Phys. Rev, C53, R1483 (1996).
- (29) H. Witała, W. Glöckle, H. Kamada, Phys. Rev. C 43, 1619 (1991).
- (30) J. Friar, D. Hüber, and U. van Kolck, Phys. Rev. C 59, 53 (1999).
- (31) S.A. Coon and H.K. Han, Few-Body Syst. 30, 131 (2001).
- (32) S. Weinberg, Phys. Lett. B 251, 288 (1990); Nucl. Phys. B 363, 3 (1991).
- (33) E. Epelbaum, H. Kamada, A. Nogga, H. Witała, W. Glöckle, U.-G. Meißner, Phys. Rev. Lett. 86, 4787 (2001).
- (34) D.R. Entem and R. Machleidt, Phys. Rev. C 68, 041001 (2003).
- (35) E. Epelbaum, W. Glöckle and U.–G. Meißner, nucl–th/0405048, to appear in Nucl. Phys. A.
- (36) P.F. Bedaque and U. van Kolck, Ann. Rev. Nucl. Part. Sci. 52 339 (2002).
- (37) E. Epelbaum, W. Glöckle and U.–G. Meißner, Eur. Phys. J. A 19 125 (2004).
- (38) E. Epelbaum, W. Glöckle and U.–G. Meißner, Eur. Phys. J. A 19 401 (2004).
- (39) CERN Program Library Long Writeup Q121, PAW, 1995.
- (40) D. Gola, W. Bretfeld, W. Burgmer, H. Eichner, Ch. Heinrich, H. J. Helten, H. Kretzer, K. Prescher, H. Oswald, W. Schnorrenberg, and H. Paetz gen. Schieck, Phys. Rev. C27, 1394 (1983).
- (41) M. Przyborowski, M. Eggert, R. Engels, M. Menzel, L. Sydow, H. Paetz gen. Schieck, H. Witała, J. Golak, J. Kuros, W. Glöckle, Phys. Rev C 60, 064004 (1999).
- (42) R.T. Cahill, J. Greenwood, H. Willmes, D.J. Shadoan, Phys. Rev. C4, 1499 (1971).
- (43) K. Sagara, H. Oguri, S. Shimizu, K. Maeda, H. Nakamura, T. Nakashima, S. Morinobu, Phys. Rev. C50, 576 (1994).
| CST | IST | FSI | |
|---|---|---|---|
| 71.2 | 68.6 | 51.5 | |
| 0 | 15 | 0 | |
| 180 | 165 | 180 |