Present address: ]IPN Orsay, F-91406 Orsay Cedex, France Present address: ]Universidad Santiago de Compostela, Spain Present address: ]CERN, CH-12211 Geneve 23, Switzerland Present address: ]University of Tsukuba, Ibaraki, Japan Present address: ]Inst. of Modern Physics, Lanzhou, China
Low-energy cross section of the 7Be(p,)8B solar fusion reaction from Coulomb dissociation of 8B
Abstract
An exclusive measurement of the Coulomb breakup of 8B into 7Be+p at 254 MeV was used to infer the low-energy 7Be(p,)8B cross section. The radioactive 8B beam was produced by projectile fragmentation of 350 MeV 12C and separated with the fragment separator FRS at GSI in Darmstadt, Germany. The Coulomb-breakup products were momentum-analyzed in the KaoS magnetic spectrometer; particular emphasis was placed on the angular correlations of the breakup particles. These correlations demonstrate clearly that E1 multipolarity dominates within the angular cuts selected for the analysis. The deduced astrophysical factors exhibit good agreement with the most recent direct 7Be(p,)8B measurements. By using the energy dependence of according to the recently refined cluster model for 8B of Descouvemont, we extract a zero-energy factor of eV b. These errors do not include the uncertainty of the theoretical model to extrapolate to zero relative energy, estimated to be about 5% by Descouvemont.
pacs:
25.40.Lw, 25.60.-t, 25.70.De, 26.65.+tI Introduction
The so-called “solar neutrino problem” has been solved by the results of the Sudbury Neutrino Observatory (SNO) Ahm01 ; SNO05 . The SNO experiment has shown strong evidence that the neutrino-flux deficit measured in charged-current interactions is a result of neutrino flavor oscillations between electron-neutrino production in the Sun and their detection on Earth. The flux measured in neutral-current interactions of high-energy solar neutrinos is in general agreement with the flux predicted by the standard solar model (SSM, Refs. BP04 ; Tur04 ). The current slight discrepancy between the flux predicted by the SSM and the neutral-current flux measured by SNO SNO05 may be significant or not depending on the uncertainty of the flux prediction: a small but significant deficit could, e.g., be evidence for oscillations into sterile neutrinos. To that end it is essential to further reduce the uncertainty of nuclear inputs to the SSM in order to refine its predictions. One critical quantity is the 7Be(p,)8B cross section at solar energies since it is linearly related with the high-energy solar neutrino flux stemming from 8B -decay.
In recent years, many attempts have been undertaken to measure this cross section with high-precision in direct-proton-capture measurements using radioactive 7Be targets Ham01 ; Str01 ; Bab03 ; Jun03 . Unfortunately, these results do not yield a completely consistent picture: The earlier measurements (Refs. Ham01 ; Str01 ) yield lower zero-energy astrophysical factors, , around 19 eV b, whereas the two more recent ones (Refs. Bab03 ; Jun03 ) obtain results which are about 15% higher. All (p,) data sets, however, were found to be consistent with an energy dependence of as given by the cluster model of Descouvemont and Baye Des94 .
In view of their importance for astro- and elementary-particle physics, it is desirable to cross-check these results by other, indirect measurements that have different systematic errors. One possibility is Coulomb dissociation (CD) of 8B in the electromagnetic field of a high- nucleus. Such measurements have been performed at intermediate Kik98 ; Dav01 and high energies Iwa99 . The present paper reports on a CD experiment similar to that of Iwasa et al. (GSI-1, Ref. Iwa99 ), but with an improved experimental technique: In GSI-1, the incident 8B beam could not be tracked before the target, whereas in the present run we could measure the angles before and after the target with good precision. Preliminary results of the present study have been published earlier Sch03 . For the present publication, the data were re-analyzed, leading to slightly different results for the lowest-energy data points.
Another indirect method to deduce is to determine the Asymptotic Normalization Coefficients (ANC) of the proton wave functions bound in the 7Be potential. This method makes use of the fact that due to the very low proton binding energy radiative proton capture is extremely peripheral and can be calculated directly from the ANC. These ANC are determined from low-energy proton-transfer or from proton-removal cross sections Muk01 ; Tra04 ; Cor03 . A recent re-examination of ANC-results for 7Be(p,) by Trache et al. yielded a relatively small central value of eV b Tra04 . Still, this value is in line with all published values of except for Ref.Jun03 .
It is important to compare the results from direct and indirect methods to determine the astrophysical -factors with each other since the indirect methods could also be used to study astrophysically interesting reactions between unstable nuclei where direct-capture reactions cannot be applied. The reaction 7Be(p,)8B could be an ideal test case, provided that the remaining inconsistencies in (0) from the different, direct and indirect, methods can be resolved.
In the present paper, we give a comprehensive report of the CD experiment performed at GSI Sch03 where we impinged a secondary 8B beam with an incident energy of 254 MeV on a 208Pb break up target. As already mentioned in our earlier publication, we focus on a crucial question that must be answered if one wants to use the CD method to derive a precise value for (0): the contribution of E2 multipolarity to CD of 8B. One can calculate that E1 is the dominant multipolarity in CD as well as in direct proton capture, but it is obvious that the equivalent photon field from a high- target nucleus seen by a projectile at a few hundred MeV per nucleon contains also a strong E2 component. Experimental limits for a possible E2 contribution were extracted in the work of Kikuchi et al. Kik98 and Iwasa et al. Iwa99 ; both papers found negligible E2 contributions. Recently, Davids et al. have reported positive experimental evidence for a finite E2 contribution in CD of 8B, mainly from the analysis of inclusive longitudinal momentum () spectra of 7Be fragments measured at 44 and 81 MeV Dav01 ; Dav03 ; they therefore subtracted a calculated E2 contribution from their data. In order to resolve these discrepancies, we have analyzed observables that should be particularly sensitive to contributions from E2 multipolarity, namely the angular correlations of the 8B-breakup particles, proton and 7Be.
II Model calculations
Accurate model calculations of the CD of 8B are essential for several reasons. From a practical point of view, the relatively bad energy resolution of the CD method requires to simulate e.g. the effects of cross talk between neighboring energy bins, of the finite size and resolution of the tracking detectors etc. These simulations require a CD event generator that is reasonably close to reality so that the remaining differences between the measured and simulated cross-section distributions can be attributed to the factor. For this purpose we have used a simple potential model of 8B.
Since the current experiment (like most other direct and indirect studies of the 7Be(p,)8B reaction) does not allow to measure at solar energies, the data set has to be extrapolated towards . For this purpose we have to use the most sophisticated model available. We will show below that a cluster model of 8B Des04 seems to be suited best for a reliable extrapolation.
II.1 Nuclear-structure of 8B
The isotope 8B has one of the lowest proton binding energies of all particle-stable nuclei known in the chart of nuclides ( keV, Til04 ). The relevant parts of the 7Be and 8B level schemes are depicted in Fig.1.
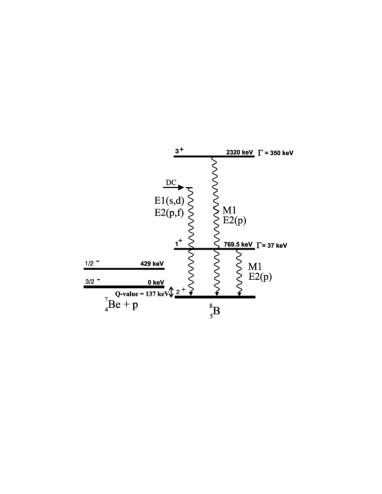
The simplest model for 8B is that of a p-wave proton coupled to an inert 7Be core with to form the 8B ground state with . We have adopted this simplified single-particle model of 8B to calculate cross sections within the simulations to be described below. Details of the model are described in Ref. Dav03 . The proton is bound in a Woods-Saxon potential with radius parameter fm and diffuseness fm. As usual, the p-wave potential depth has been adjusted to match the 8B proton binding energy, this yields a depth of 43.183 MeV. The s-, d- and f-wave potentials have been adjusted to reproduce the s-wave scattering lengths of the mirror 7Li+n reaction Koe83 , this yields MeV for channel spin =1 and MeV for channel spin =2. We note that we obtain for the dominant channel spin =2 an s-wave scattering length for 7Be+p of fm which agrees well with the recently measured value of fm (Angulo et al. Ang03 ).
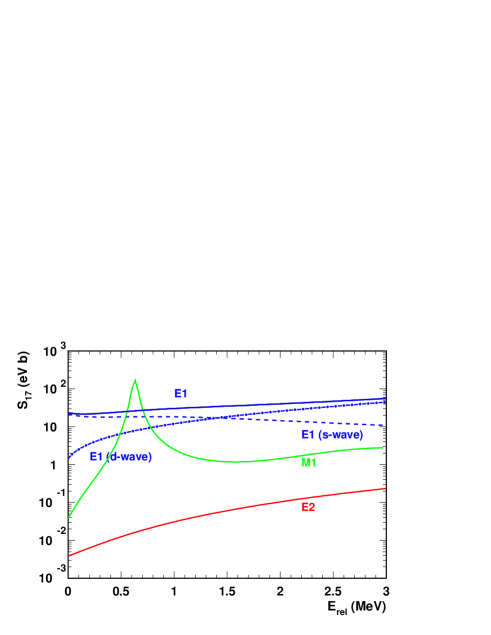
With this model we obtain astrophysical -factors as a function of the proton-7Be relative energy, , as shown in Fig.2. The non-resonant direct capture into the 8B ground state proceeds mainly via s- and d-wave captures and E1 -emission. Capture of p- and f-waves followed by E2 emission plays an insignificant role, in particular at solar energies. The resonant component proceeds through the resonance at 770 kev (632 keV above threshold) which decays mainly by M1 emission and is limited essentially to a narrow region around the resonance energy, with minor but finite contributions at relative energies above the resonance. The M1-resonance cross section has been obtained from experimental data Fil83 , it is not contained in the model of Ref. Dav03 . We have ignored entirely the high-lying M1 resonance at 2.32 MeV since it cannot be seen in our high-energy CD experiment, due to both, the small cross section in CD and its large width.
The potential model of 8B sketched above ignores the well known cluster structure of 7Be (see e.g. Ref. Nun97 ). Descouvemont and Baye Des94 have therefore applied a model where 8B is assumed to consist of e.g. p+(7Be=3He+4He) or 3He+(5Li=p+4He) three-cluster structures, including excited states of the clusters. Later, this model was slightly refined Des04 by allowing also for variations in the cluster separation and by using different effective nucleon-nucleon interactions; the results were found to be largely unchanged. Our potential model can be viewed as a simplification of the cluster model where the cluster distance is artificially set to zero; the spectroscopic information available for 7Be points, however, to a finite cluster distance of 3.5 fm Des04 .
For computational simplicity, we will use the potential model to simulate the differential observables in our experiment and come back to the cluster model at the end of this article where we discuss the extrapolation of towards zero relative energy.
II.2 Coulomb dissociation of 8B
As proposed by Baur et al. Bau86 , CD can be used favorably to measure radiative-capture cross sections by making use of the strong flux of equivalent photons originating from a heavy target nucleus as seen by a fast-moving projectile, which replaces the presently insufficient intensity of available real-photon sources. Assuming first-order perturbation theory for the electromagnetic excitation process, CD cross sections can be converted directly to photo-dissociation cross sections. The latter are related to the astrophysically relevant radiative-capture cross sections by the principle of detailed balance. It is obvious that the indirect method of CD needs theoretical input in the conversion process.
There are several sources for complications. They can be identified and minimized by selecting appropriate observables and kinematical conditions in the experiment.
-
1.
Several multipolarities (E1, E2, M1, …) with different weights contribute in radiative capture reactions and Coulomb breakup. In principle, they can be disentangled by studying angular distributions in CD, preferably in the center-of-mass system of the excited nucleus. Their relative strengths depend on projectile energy and scattering angle.
-
2.
An exchange of more than one photon (“higher-order effects”) destroys the direct relation between the CD cross section and the photo-dissociation cross section. High projectile energies and large impact parameters reduce this effect.
-
3.
The nuclear interaction between projectile and target induces nuclear breakup and absorption. It becomes relevant for small impact parameters.
These are general features of CD that can be included in the theoretical description of the breakup mechanism in various approximations which lead to corrections of the simple pure-Coulomb first-order approach.
II.2.1 Semiclassical calculations
The Coulomb-breakup mechanism can be described both in fully quantal approaches and semi-classical models Ald56 . In the latter case the projectile is assumed to move on a classical trajectory with respect to the target. In our case, we use the semi-classical model in first-order perturbation theory (PT) to describe the CD of 8B in the Coulomb field of 208Pb, as described in more detail elsewhere Ber94 ; Typ02 ; Dav03 . The excitation amplitude is calculated in the relativistic approach assuming a straight-line trajectory but correcting the excitation functions for the deflection in the Coulomb field of the target Win79 . This is appropriate at the high incident energy used in the present experiment (254 MeV) and justified a posteriori by the good agreement with the measured angular distributions.
In addition to CD, nuclear overlap of 8B and 208Pb has to be considered. This will mainly take flux out of the 7Be+p exit channel; feeding this channel by nuclear interaction has been calculated to be of minor importance by Bertulani and Gai Ber98 . In order to take nuclear absorption into account we modified the relativistic Coulomb-excitation functions by multiplying them with a correction factor as described in Ref. Typ02 . This factor is derived from an eikonal approximation of the excitation functions taking both Coulomb and nuclear potentials into account. In the present case we assume a diffuse absorptive nuclear potential with a depth of 20 MeV and a radius of 9.91 fm, i.e. the sum of the projectile and target radii. As we will see below, this choice reproduces well the integral scattering-angle distribution.
II.2.2 Dynamical calculations
Higher-order effects from the exchange of more than one photon can be considered in semi-classical calculations that study the time-evolution of the projectile system during the scattering. As compared to a first-order calculation, the momenta of the outgoing particles are modified in the Coulomb field of the target leading to a distortion of relative-energy and angular-momentum distributions. Esbensen et al. Esb04 ; Esb05 have proposed that discrepancies between the results from radiative-capture and from CD studies of the 7Be(p,)8B reaction are due to deficiencies of the method how to evaluate from CD cross sections by using first-order PT. They point out that a full dynamical calculation of CD, if compared to a first-order PT calculation, will lead to an increased factor at low and a reduced one at high , thus producing a smaller slope of vs. and a better agreement between the results from the two methods. However, the amount of this modification depends on the assumed E2 strength and thus is model dependent. Recently, fully quantal calculations became available that consider the post-acceleration of the fragments in the Coulomb field of the target. In contrast to dynamical calculations in the semiclassical approach, they predict an increase of the cross section at low relative energies Alt05 . More theoretical work is required in order to obtain a consistent picture of higher-order effects.
To follow the suggestions of Esbensen et al., we have also performed dynamical calculations of the CD of 8B at 254 MeV following the approach as described in Dav03 for lower projectile energies assuming the simple potential model for 8B. The 8B nucleus moves on a Coulomb trajectory taking the deflection into account. E1 and E2 multipoles were considered in the standard far-field approximation with the full strength as predicted by the model.
In both theoretical approaches, triple-differential cross sections for the CD of 8B are obtained. These distributions of observables cannot be compared directly to the measured data, but have to be folded with the respective experimental resolutions. To this end, the cross sections were converted to statistically distributed “event” distributions from both (PT and dynamical) calculations and run through our experimental filter as will be described in more detail below.
III Experimental procedures
Several other CD studies of 8B breakup Kik98 ; Dav01 have used intermediate energies between 46 and 83 MeV as available from cyclotron-based radioactive-beam facilities. At GSI, the 18 Tm SIS-18 synchrotron allows to go much higher in incident energy. We have chosen a 8B incident energy of 254 MeV limited by the maximum bending power of the KaoS spectrometer used for determining the momenta of the break-up particles, p and 7Be. In the following we will describe in detail the preparation and identification of the secondary beam as well as the experimental equipment used to measure the breakup.
III.1 Preparation and properties of the 8B beam
The 8B secondary beam was produced at the SIS/FRS radioactive-beam facility at GSI Gei92 by fragmenting a 350 MeV 12C beam in a 8 g/cm2 Be target and separating it from contaminant ions in a 1.4 g/cm2 wedge-shaped Al degrader placed in the FRS intermediate focal plane.
Typical 8B beam intensities in front of KaoS were per 4 sec spill; the only contaminant consisted of about 20% 7Be ions which could be identified event by event with the help of a time-of-flight measurement. For this purpose a 3 mm thick plastic scintillator detector was installed in the transfer line between FRS and KaoS, about 85 m upstream from the breakup target, to serve as a time-of-flight (ToF) start detector. Positions and angles of the secondary beam incident on the Pb breakup target were measured with the help of two parallel-plate avalanche counters (PPAC) located at 308.5 cm and 71 cm upstream from the target, respectively. The detectors, which were designed and built at RIKEN Kum01 , had areas of and allowed to track the incident 8B beam with about 99% efficiency and with position and angular resolutions of 1.3 mm and 1 mrad, respectively. In addition, they provided a ToF stop signal with a resolution of 1.2 ns (FWHM). Fig.3 shows a two-dimensional plot of the ToF between the scintillator detector and the second PPAC detector in front of the target.
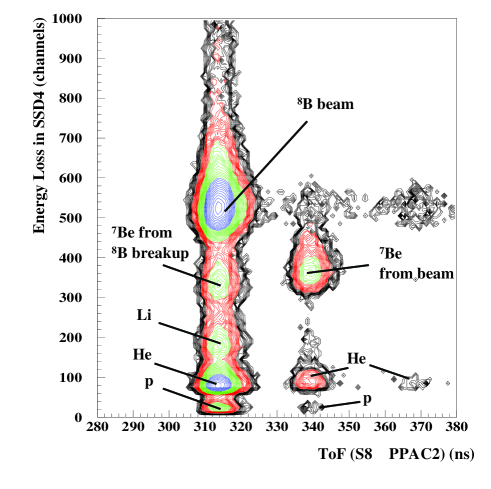
One can see that a ToF measurement alone is sufficient to separate the 8B beam from contaminants on an event-by-event basis.
III.2 Detection of break-up fragments
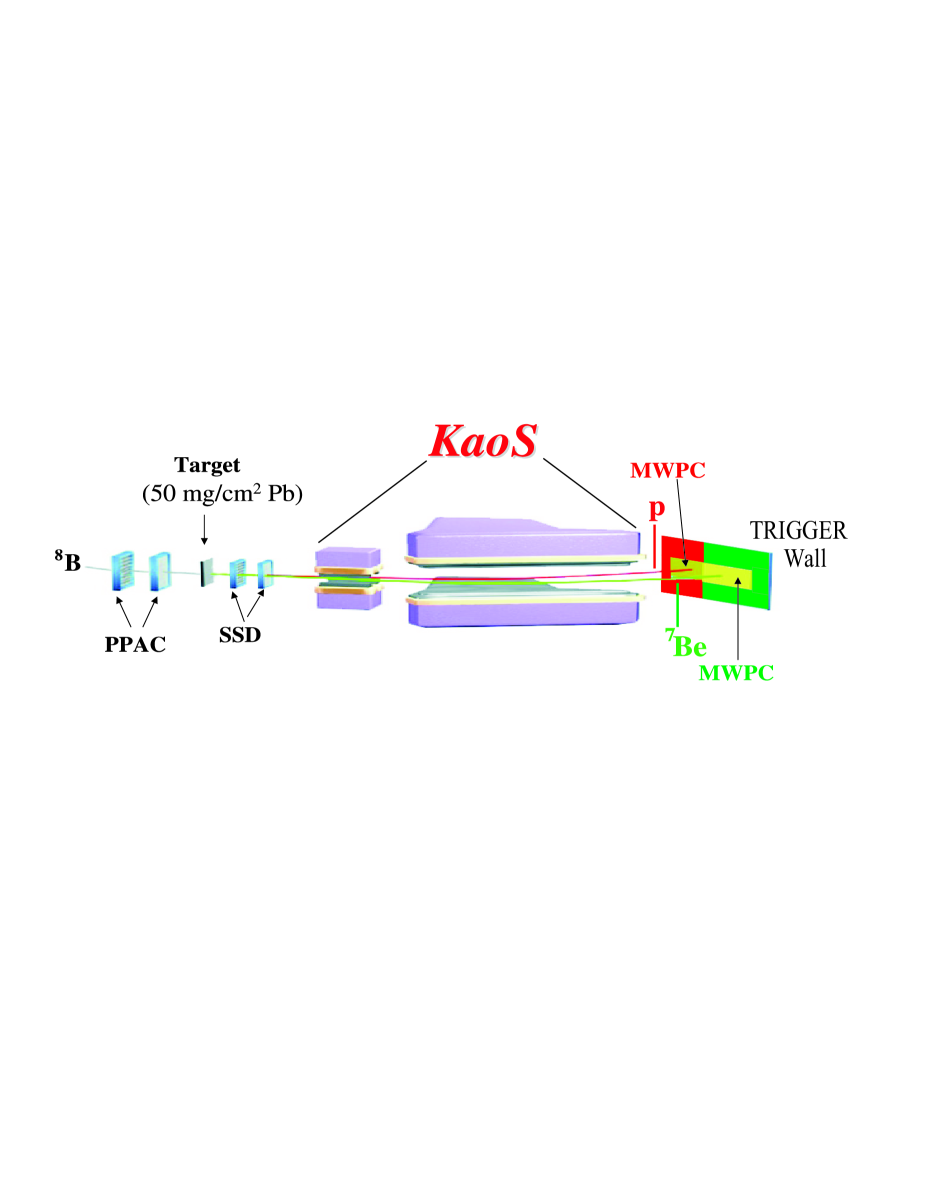
A schematic view of the experimental setup to detect the breakup of 8B in semi-complete kinematics (i.e. without detecting coincident -rays) at the KaoS spectrometer at GSI is shown in Fig.4. Apart from the PPAC tracking detectors mentioned above, it consisted of (i) the 208Pb breakup target; (ii) two pairs of Si strip detectors; (iii) the magnets of the KaoS spectrometer; (iv) two large-area multi-wire proportional chambers (MWPC); (v) a ToF wall serving as a trigger detector. The individual components will be discussed in detail below.
III.2.1 Fragment tracking: Si strip detectors
Downstream from the Pb target (which consisted of 52 mg/cm2 208Pb enriched to 99.00.1% and had an area of 24 mm in height times 36 mm in width), the angles and positions as well as the energy losses of the outgoing particles were measured with two pairs of single-sided Si strip detectors (SSD). These detectors (300 m thick, 100 m pitch) were located at distances of about 15 cm and 30 cm downstream from the target. Fig.5 shows schematically the layout of the SSD detector array.
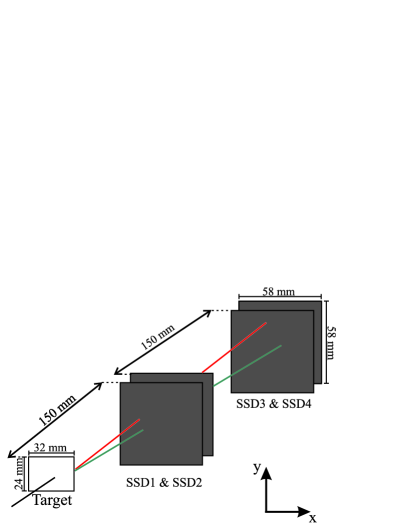
The vacuum of the beamline housing the PPAC’s, the target and the SSD detectors was separated downstream from ambient air by a stainless-steel window of 50 m thickness.
III.2.2 The KaoS magnetic spectrometer
The KaoS magnetic spectrometer Sen93 consisted of a large-aperture quadrupole and a horizontally-focussing dipole magnet. The ratio between the smallest and largest momentum accepted by KaoS amounted to about two, making KaoS an ideal instrument to detect breakup of neutron-deficient nuclei into a proton with =1 and an ion with . Prior to our measurement, the magnetic field of the KaoS dipole had been mapped in three dimensions to obtain an empirical field map; this map was then used to simulate the passage of charged particles through the magnet using the code GEANT-3 geant . To avoid multiple scattering of the fragments in air, the chamber inside the quadrupole and dipole magnets was filled with He gas at 1 bar pressure, separated from the ambient air by thin He-tight foils.
III.2.3 Fragment tracking: Multi-wire chambers and trigger detectors
Behind the magnets, two large-area MWPC were installed as close to the focal plane as possible. One chamber, with horizontal and vertical dimensions of 60 cm and 40 cm, respectively, detected the positions of protons behind KaoS. The other one, 120 cm wide and 60 cm high, was set to detect the 8B non-interacting beam and the 7Be fragments. The separation of the position measurements of protons and the heavy ions allowed to optimize each detector voltage for optimum detection efficiency.
Behind the focal plane and parallel to it, a plastic-scintillator wall with 30 elements (each 7 cm wide and 2 cm thick) was installed and used for trigger purposes. The wall was subdivided into two sections covering the respective MWPC in front of them. Coincident signals in the left hand (proton) part and in the right hand (ion) part of the wall indicated a breakup event (“breakup” trigger). Singles hits in the right hand section were interpreted as “beam” triggers and recorded with a down-scale factor of 1000.
III.3 Monte-Carlo simulations
Monte-Carlo simulations of the Coulomb breakup of 8B and the detection of the breakup products are an indispensable part of the present experiment. They were essential in planning the experiment, helped to estimate the energy resolution and detection efficiencies, and were instrumental in determining the proton and 7Be momenta from the measured positions. As a tool for these Monte-Carlo simulations the program package GEANT-3 geant was used.
The Monte-Carlo simulations started with an event generator that simulated CD of 8B on 208Pb in first-order perturbation theory or via a fully dynamical calculation by the theoretical approaches mentioned above (subsect.II.B). Technically, the event generator produced statistically-distributed ensembles of 500,000 CD-“events” each that were used as input to a GEANT simulation of the passage of each breakup particle through the Pb target, the SSD detectors, the beamline exit window, the He-filled interior of the magnets and the air behind KaoS before hitting the MWPC volumes. At the target, the emittance of the 8B as measured with the PPAC’s was imposed, the momentum spread was assumed to be the nominal FRS momentum acceptance, .
Momenta of each particle type (p,7Be,8B) were obtained from two position measurements in the SSD and one position measurement in the respective MWPC. To calculate each particle type’s momentum, a 36-term polynomial expression was derived; its parameters were obtained in a GEANT simulation by sending particles with known momenta (covering evenly the range of relevant momenta) through the setup and fitting the momenta as a function of the positions by varying the 36 polynomial parameters. In a similar way, the invariant-mass resolution of the experiment could be obtained by simulating breakup events of known invariant mass and reconstructing this quantity from the simulated positions. The top panel in Fig.6 shows the resolution ( width) as a function of the p-7Be relative energy, , as determined from the simulation.
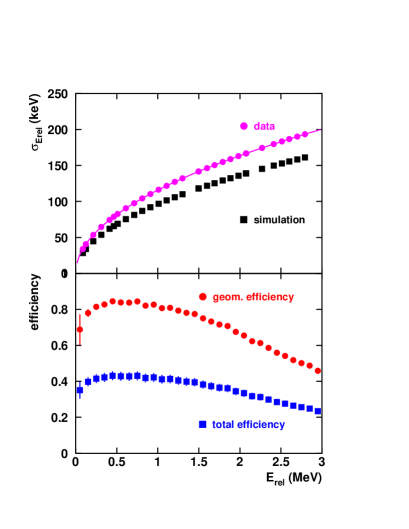
Bottom: Geometrical efficiency (upper set of data points). In addition, we show in the lower set of data points also the total efficiency including all analysis conditions.
The efficiency of our setup at high is mainly given by the finite sizes of the SSD and MWPC detectors. Below the maximum around 0.5 to 1 MeV, the efficiency drops due to overlap of the proton- and 7Be hit patterns in the SSD leading to apparent multiplicity 1 instead of 2. Numerical values of the efficiency could be obtained by simulating the full set of 500,000 CD events with and without the above conditions and plotting the ratios of these numbers for different, evenly spaced bins. This distribution is shown in the lower panel of Fig.6. The upper set of data points (circles) is obtained by requiring two separated p-Be hits inside all detector volumes. The lower set of data points (squares) is obtained by taking into account the intrinsic detector and trigger efficiencies and applying all analysis conditions, see subsect. IV.B below. It can be seen that the major part of the distribution is covered with high total efficiency (about 30-40%). It should be noted that this curve is insufficient to correct measured data for efficiency: the total efficiency is a multi-dimensional function of both the original and the smeared-out (by the experimental resolution) angles and momenta of both particles. Therefore, we pass the theoretical “events” through the experimental filter and compare the results to the same quantities derived from the data.
IV Data reduction and results
The experiment described in the present paper recorded events
from three different sources:
(i) breakup events originating in the Pb target;
(ii) down-scaled beam particles;
(iii) background from a variety of sources (e.g. cosmic rays).
Though event classes (i) and (ii) are mainly correlated with a
corresponding trigger type (“breakup” trigger for class (i),
“beam” trigger for class (ii)) we have checked if by chance the
trigger types and event classes were mixed in rare cases, and have
corrected for that.
In the following, we first show how the total number of incident 8B projectiles is obtained from the “beam” trigger events. We then explain how the breakup events originating in the Pb target were identified.
IV.1 Total number of 8B projectiles
The absolute number of 8B ions impinging on the 208Pb breakup target needs to be known to determine absolute cross sections. To this end, “beam” trigger events were analyzed to select those that correspond to 8B in the -ToF plot, Fig. 3. A 3 window around the 8B energy-loss peak in each SSD was chosen. To convert the integrated number in this spectrum to the total number of incident 8B ions, the down-scale factor of the “beam” trigger (103) and the efficiencies for detecting 8B ions in the ToF detectors (3 mm scintillator, PPAC detectors) as well as in the (SSD) detectors have to be taken into account. These numbers were derived from sets of linear equations containing the coincidence count rates and the respective efficiencies. A small number (0.48%) of 8B ions was found for the “breakup” trigger condition due to random-noise coincidences with the left (“proton”) part of the plastic-scintillator wall. Together with the total from the “beam” trigger condition we obtain a total of 8B ions impinging on the breakup target.
IV.2 Identification and tracking of breakup products
The coincident p and 7Be signals resulting from breakup in the 208Pb target were identified among the class (i) events (“breakup” trigger) in several successive steps:
-
1.
The -ToF condition was applied to select only incident 8B ions (see above).
-
2.
A multiplicity of in each SSD was required. That meant that at least one empty strip was found between two adjacent hit clusters.
-
3.
A 3-window around the peak corresponding to the energy loss of 7Be in each SSD selected 7Be as one of the reaction products.
-
4.
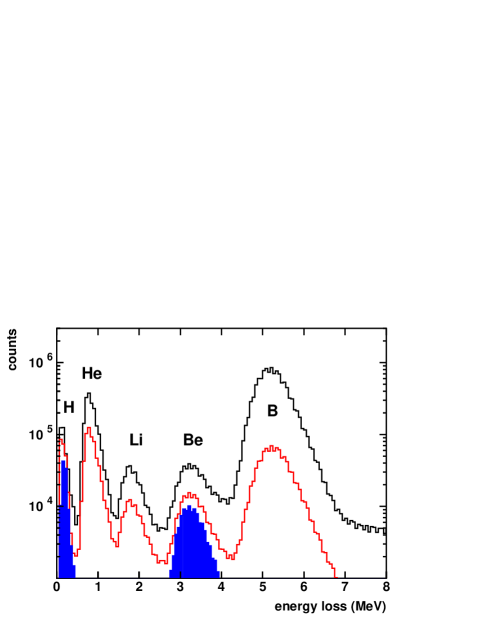
The coincident protons were found among all events with keV keV in each SSD where the trajectories had a closest distance to the coincident 7Be trajectory inside a volume given in x and y by the size of the target (18 mm in x- and 12 mm in y-direction) and in z-direction (along the beam axis) of 25 mm around the target (located at ). The low-energy cutoff was chosen individually for each detector; the number of protons below this cutoff was estimated by fitting a Gaussian to the low-energy tail of the Landau distribution.
The inclusive spectra resulting from conditions 1 and 2 above are shown by the intermediate thin histogram in Fig.7, whereas conditions 3 and 4 lead to the innermost (filled) histograms in Fig.7. This procedure removed all breakup events in layers of matter other than the target and led to a practically background-free measurement.
The breakup protons loose only about 200 keV in the 300 m thick SSD. Nevertheless, after imposing the vertex condition, the energy-deposition signals of protons in the SSD are clearly resolved from noise.
IV.3 Invariant-mass reconstruction
IV.3.1 Proton-ion opening angles
The p-7Be relative energy, , is derived from the total energies, , of the particles, their 3-momenta, , and the p-Be opening angle, according to
| (1) |
Whereas the proton and 7Be momenta can be obtained only from the rather complicated momentum reconstruction procedure described in the next subsection, the p-7Be opening angle, , can be determined directly from constructing the vectors connecting the breakup vertex in the target with the corresponding hit positions in the SSD. Since protons fire only a single strip in each SSD, their positions are given by the strip centroid, and the variances of these positions - assuming that the hits are evenly distributed over the strip width - by the the strip pitch, 100 m, divided by . In contrast, the larger energy deposits by the 7Be ions produce broader hit patterns in our setup, with rather large fluctuations of the widths.
To reconstruct a breakup event, the p and 7Be hits in each SSD have to be separated by at least one empty strip. Since this affects the efficiency for identifying a breakup event for low , we have to make sure that the GEANT simulation accurately reproduces this efficiency. This has been achieved by introducing a weighting function in GEANT that gradually increases the efficiency for detecting two separated hits from zero to one over the appropriate distance for each detector so that experimental and simulated distance distributions look alike. In Fig.8 we plot the horizontal-distance distribution between
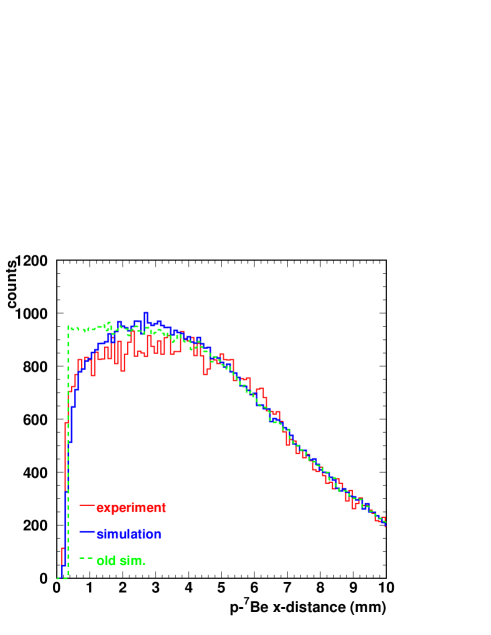
proton and 7Be hits in the first SSD. One can observe that experiment and simulation yield very similar distributions. It should be emphasized that in our earlier data analysis a step function was assumed for this efficiency that jumped from zero to full efficiency at a fixed distance of 0.4 mm in each SSD. This is visualized by the dashed histogram in Fig.8; it clearly shows that we overestimated the GEANT detection efficiency for small in our previous paper Sch03 . As we will show below, this leads to slightly larger cross sections at low compared to those of Ref. Sch03 .
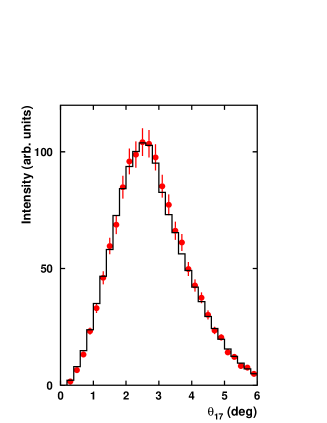
The validity of this procedure can be checked immediately by inspecting the integral distribution of p-7Be opening angles, , both in experiment and in simulation. These distributions are shown in Fig.9. The agreement is excellent.
IV.3.2 Momentum reconstruction of the fragments
As mentioned already above, momenta for each particle (p,7Be,8B) where calculated from two position determinations in front of KaoS (in the SSD) and from another position determination behind KaoS (in the MWPC). These 6 coordinates were converted to momenta using three sets of 36-term polynomial expressions, one for each ion. By combining event by event the longitudinal momenta of p and 7Be, one can check the accuracy of the momentum reconstruction; its width is a measure how well angular straggling effects are treated in the GEANT simulation. The comparison shows that the simulated momentum widths are more narrow by 20% compared to experiment. Therefore, the simulated values shown in Fig.6 (squares) where uniformly increased by 20% (circles).
IV.4 Angular distributions
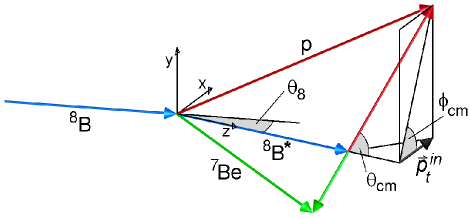
In the following we will present some angular distributions that can be shown to be sensitive to an E2 amplitude in CD. Fig. 10 shows the coordinate systems used. With 8B∗ we denote the momentum vector of the (excited) 8B prior to breakup, as it is reconstructed from the measured proton and 7Be momentum vectors. The angle is the laboratory scattering angle of 8B∗ relative to the incoming 8B beam. The polar angles, , and the azimuthal angles, , of the breakup protons are measured in the rest frame of the 8B* system. In the same way, one can calculate the transverse proton momentum vector in the reaction plane ().
IV.4.1 Comparison to perturbation-theory calculations
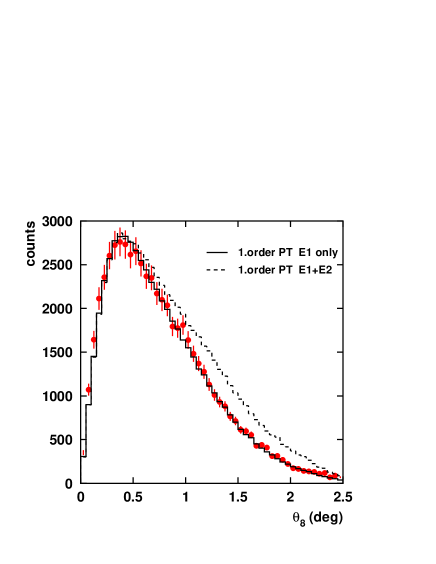
Fig.11 shows the distribution, in comparison to two model calculations using first-order PT as discussed in subsect. II.B. The full histogram denoting pure E1 multipolarity follows the data points very well, even to very large angles. The dashed histogram, where both E1 and E2 with their full theoretical strengths were assumed, deviates from the data points markedly for values above about 0.7 degrees. Note that the theoretical histograms were folded with the experimental response. We conclude that even the distribution already indicates E1 dominance, in a similar way as demonstrated in the paper by Kikuchi et al. Kik98 .
We present in Fig. 12 the distribution of for three different upper limits in , 0.62∘, 1.0∘, and 2.5∘. In classical Rutherford scattering, this corresponds to impact parameters of 30 fm, 18.5 fm, and 7 fm, respectively. Relative energies between p and 7Be up to 1.5 MeV were selected.
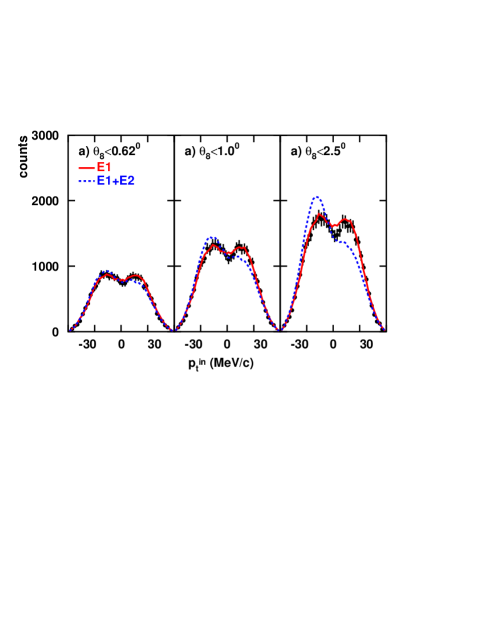
The experimental data for all three -cuts can be reproduced well by a PT calculation that includes only E1 multipolarity (full histograms in Fig. 12, the theoretical curves were normalized individually to the data sets). If E1-plus-E2 multipolarity is used in the PT calculation, the different impact-parameter dependences of E1 and E2 multipolarity lead to markedly different shapes for the different -cuts (dashed histograms in Fig.12). In particular for large values of , the latter distributions show a large asymmetry with respect to that is in clear disagreement with our data points.
By comparing Fig.12 with similar plots in our earlier Letter (Fig.2 of Ref.Sch03 ) one can see the improvement in the GEANT simulation which was achieved by the modified prescription for the p-Be hit resolution (see subsect. IV.3.1). The dips near in the theoretical distributions are now much closer to the experimental ones (though small residual discrepancies are still visible in the rightmost panel).
Fig.13 depicts the experimental distributions for three different bins, as indicated in the figure. A “safe” limit of 1∘ was chosen.
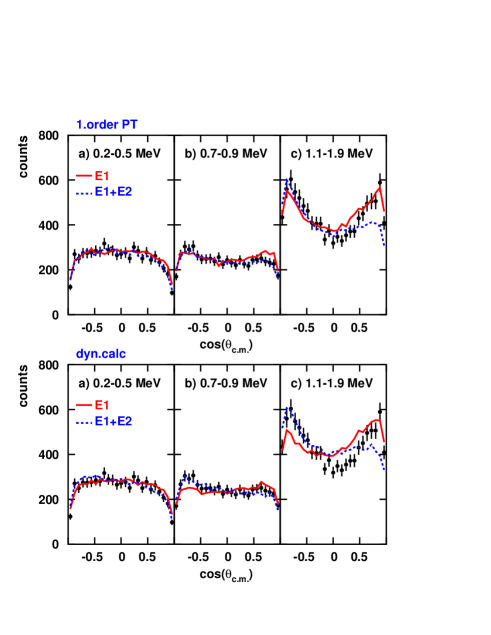
As expected, these distributions are mostly isotropic at low (indicative of -waves) and become increasingly anisotropic for larger values (contributions from higher orbital angular momenta). As in Fig.12, also for the distributions the calculations for pure E1 multipolarity fit all spectra well; inclusion of an E2 component may lead to a slightly better fit at low , but diverges clearly for the large- bin where E2 should play a major role. The calculations with a dynamical model will be discussed below.
IV.4.2 Comparison to dynamical calculations
As mentioned above, Esbensen et al. Esb04 ; Esb05 suggested that dynamical calculations are required to properly describe CD and to evaluate from the measured CD cross sections. A sensitive test if such a theory describes the experimental data better than first-order PT calculations is given by comparing the dynamical predictions (using the model described in subsect. II.B.2) to the same angular distributions (bottom part in Fig.13). In all three frames shown, our E1-only dynamical calculations do not agree well with the data points. Dynamical calculations with E1+E2 seem to introduce a slight improvement as long as the effect of E2 multipolarity is small, but a major discrepancy shows up when E2 should have a stronger influence (rightmost lower panel in Fig.13).
In general, one would expect that the more complete description of the Coulomb breakup within the semiclassical dynamical approach leads to a better agreement with the experimental data than the simpler perturbative treatment. However, in the dynamical calculation more model parameters that are not really constrained have to be specified than in the first-order approach. E.g., the results for the angular distribution in the dynamical calculation depend crucially on the assumed E2 strength, i.e. there is a considerable model dependence. With sufficicently precise experimental data it would be possible to determine this strength in a fitting procedure but this requires extensive calculations. Additionally, one has to keep in mind that a full quantal treatment of the breakup process could lead to different results.
We conclude that within the limits of our experimental conditions the simplest model (first-order PT with E1 multipolarity only) still gives the best agreement with the measured center-of-mass proton angular distributions. This is in line with conclusions drawn by Kikuchi et al. Kik98 and by Iwasa et al. Iwa99 from their respective distributions (which are, however, less sensitive to a small E2 component than the present angular correlations). Our findings contradict the conclusions of Davids et al. Dav01 that a substantial E2 cross section has to be subtracted from the total measured CD cross section.
What remains to be done is to find a physical explanation for the small E2 strength compared to the model calculations (both, the potential model and the cluster model, predict almost equal values). At the same time, one has to find a different way to explain the asymmetries found in inclusive longitudinal-momentum distributions Dav01 and attributed either to a quenched Dav01 or enhanced Dav03 ; Mor02 ; Sum05 E2 strength relative to the respective model calculations.
IV.5 Energy-differential dissociation yields
The measured momentum vectors of the outgoing p and 7Be particles allowed to calculate according to Eq.(1), from which we have constructed the energy-differential dissociation yields of the excited 8B∗ system prior to breakup (Fig.14).
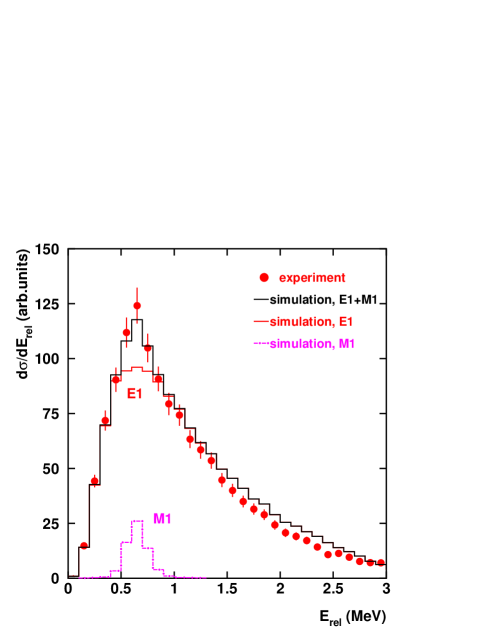
In line with our findings of a negligible E2 contribution discussed above, we compare this spectrum to a simulated one that contains contributions from E1 and M1 multipolarities only. The latter contribution was calculated using the M1 resonance parameters as determined by Filippone et al. Fil83 . As expected, M1 contributes only in a narrow energy range around the peak of the spectrum. In plotting Fig.14, we have restricted the Rutherford scattering angles to values below 1.0∘ to ensure both dominance of CD and reduction of the effect of any possible E2 contribution.
It should be noted that in CD, starting from the 8B ground state, both the ground state and the first excited state at 429 keV in 7Be can be observed as a result from first-order E1 excitation. The relative amount of these contributions to the CD are determined by the relative spectroscopic factors of the two 7Be states in the 8B ground state and the different photon spectra due to the different excitation energies. This component, which can be traced experimentally by observing the coincident 429 keV -rays, needs to be subtracted before calculating from differential CD cross sections. Numerical values for this branching have been kindly provided by Kikuchi et al. Kik98 and were scaled to the present bombarding energy using Weizsäcker-Williams theory.
Since the shape of the theoretical distribution is better defined than its absolute magnitude, we have normalized both distributions to each other; the resulting scaling factor is . With this renormalization, the experimental and simulated distributions agree rather well (Fig. 14). Small deviations between the data points and the histogram indicate discrepancies between the assumed factor from our potential model and the true one, as will be discussed in the next section.
V The astrophysical factor
The measured quantity in CD of 8B is the distribution of energy-differential cross sections, Fig.14. This distribution is related to via a theoretical model. We assume that at the high incident energy used in our experiment and for the low -value of the reaction, first-order perturbation theory is adequate to describe Coulomb dissociation. This has been investigated in detail in Ref. Typ02 . In analyzing our results, we also assume that the GEANT simulations describe all experimental effects quantitatively, in particular the feeding of neighboring bins due to the relatively bad resolution. We have verified this assumption by comparing data and simulations for several raw observables, e.g. the distribution of Fig.9 or the distribution of Fig.11. Based on the good agreement, we conclude that any remaining discrepancies between the two histograms in Fig.14 can be attributed to a deviation of the true E1 factor from the one used in our simulation. Thus, the true factor for each bin was obtained by multiplying the theoretical one (averaged over this bin width) by the ratio of observed and simulated counts. The bins were chosen in accordance with the resolution (Fig.6) to be roughly one FWHM wide, i.e. between 0.2 and 0.3 MeV. The resulting factors as a function of are visualized in Fig. 15 and listed in Table 1.
| (MeV) | (eV b) | (eV b) |
|---|---|---|
| 0.160 | 17.5 | 2.1 |
| 0.316 | 19.3 | 1.2 |
| 0.507 | 20.6 | 1.3 |
| 0.695 | 22.9 | 1.7 |
| 0.942 | 23.6 | 1.6 |
| 1.244 | 25.2 | 1.9 |
| 1.540 | 25.6 | 2.2 |
| 1.841 | 27.1 | 2.5 |
| 2.187 | 27.9 | 2.8 |
| 2.582 | 29.8 | 3.4 |
| 2.988 | 56.8 | 7.1 |
The error bars shown in Fig. 15 and listed in Table 1 contain all -dependent terms, resulting from counting statistics, from the error of the geometrical efficiency as determined by the GEANT simulations, and from the error of the feeding of the excited state in 7Be. In addition, uncertainties in determining and are included. An -independent systematic error of 5.6% has to be added for all data points, reflecting an estimated error of the dead-time correction (0.6%), of the number of incident 8B projectiles (1.4%), and of the analysis (5.4%). The analysis error consists of the combined errors related with choosing the appropriate gates to identify a 7Be fragment in the spectra (1.8%) and to identify a proton via the vertex reconstruction (5.1%). The latter contribution reflects the uncertainty in choosing the low-energy cutoff in the proton- spectra to remove the noise, which at the same time leads to the loss of some real proton events. More details can be found in Ref. Sch02 .
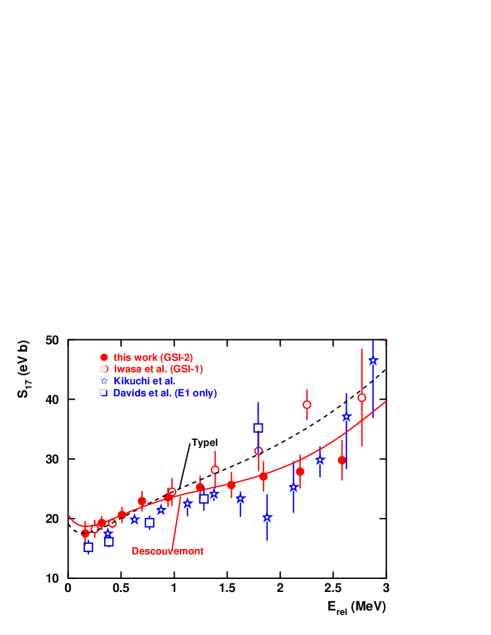
V.1 Comparison with other CD experiments
Fig.15 shows the astrophysical factors as deduced from the three other CD experiments published so far Kik98 ; Iwa99 ; Dav01 (the data of Ref.Dav01 represent their E1- factors after subtraction of the E2-contribution). The CD factors are in reasonable agreement with each other, though both the Kikuchi et al. Kik98 and the Davids et al. Dav01 data are systematically lower. We note that also our earlier CD experiment Iwa99 and the present one are in good agreement up to MeV, marked discrepancies occur only at higher values. Compared to our previous results given in Ref. Sch03 , the lowest three data points have been increased by 6.7%, 10%, and 5.8%, respectively. The remaining data points remain largely unaffected. As a consequence, the slope of our factors as a function of becomes smaller and fits much better than previously to the energy dependence of Descouvemont’s cluster model; we will discuss this aspect in more detail below.
In the above comparison with other published CD results, we have plotted values as deduced by the authors in their analyses. Other evaluations of the same data sets may lead to different results. As an example, we quote the recent re-analysis of the energy- and angle-differential cross sections, and , of the RIKEN-2 experiment Kik98 by Ogata et al. Oga05 . The former authors deduced a zero-energy factor of eV b based on first-order perturbation theory. Ogata et al. obtain eV b from the same experimental data, by taking into account interference of nuclear, E1 and E2 contributions and higher-order processes.
V.2 Comparison with direct-capture experiments
Fig. 16 compares our data to those of the recent 7Be(p,)8B measurements where the authors have subtracted the contribution from the M1 resonance (Refs. Ham01 ; Jun03 ; Bab03 ). (Since we do not intend to dwell on discrepancies among the results from direct-proton-capture experiments, we restrict ourselves to the three data sets shown).
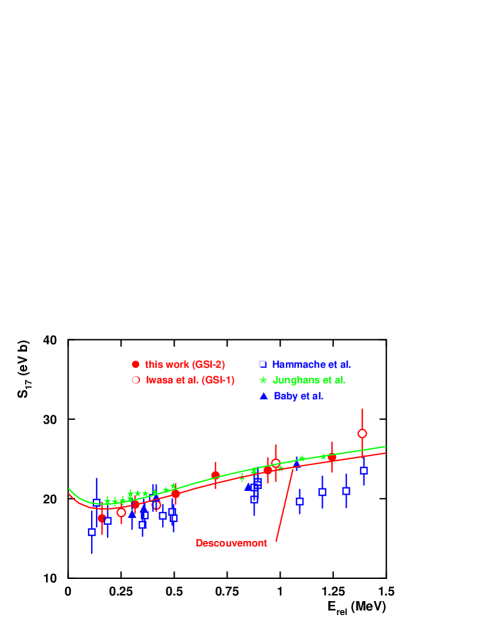
With the modifications of the lowest- data points discussed above, our dataset follows now closely the (p,) data of Junghans et al. Jun03 over their entire energy range. Previously Sch03 we noted good agreement with Refs.Jun03 ; Bab03 only for the data points above the resonance. This solves partly a puzzle that Junghans et al. claim to have observed, a systematic discrepancy between the slope of the CD factors and those from direct p-capture experiments. It also removes the experimental basis for recommendations by Esbensen et al. Esb05 to modify the deduced slope of on the basis of a fully dynamical calculation.
V.3 Extrapolation to zero relative energy
To extrapolate to zero energy, all recent (p,) experiments have chosen the cluster model of Descouvemont and Baye Des94 . As mentioned above, Descouvemont Des04 has recently refined the cluster-model description of 8B (we refer to this model below as D04). In this refined approach, the curve resulting from the Minnesota force (MN) is closer to the experimental data and has been used in Fig.16 to fit both the Seattle data Jun03 and our present results over the energy range up to MeV. The fits yield practically identical results within their respective errors. The D04 normalization factor for our data set is with a reduced of 0.40. Note that Descouvemont has investigated the error introduced by scaling the factor and found it negligible Des04 .
Our previous data set Sch03 was found to be best compatible with the potential-model calculation of Typel as discussed in subsect. II.B. of the present paper or in Davids and Typel Dav03 (referred to below as DT03). It is obvious that with the modified low-energy data points of the present paper, the agreement with this model is less satisfactory. The black dashed curve in Fig.15 visualizes a fit of this theory to our data. Though from a purely statistical point of view the fit with the DT03 curve is acceptable, we prefer to describe our data with the D04 theory for the following reasons:
-
1.
The two-cluster structure of 7Be is related to its intrinsic deformation, so that a model of 8B based on this feature should be more realistic;
-
2.
the energy dependence from all modern direct p-capture experiments can be described consistently and fitted with high confidence with the cluster model, thus corroborating the above conjecture;
-
3.
D04 allows to fit our lower 4 to 9 data points with practically equal results; i.e. the scaling factor does not depend on the fit range. In contrast, the DT03 scaling factor changes continuously with increasing fit range, reflecting the different shape of the curve;
-
4.
using D04, we find for a fit range up to 2 MeV; the DT03 fit yields already if the fit range is extended above 1.3 MeV.
When we fit our lowest 8 data points, up to = 2 MeV, to the D04 model, we obtain eV b. The same result within error bars is obtained if we use any number of data points between four and eight. As mentioned above, a systematic error of 5.6% has to be added, yielding eV b. Not included in these numbers is the theoretical uncertainty given by Descouvemont Des04 as about 5-10% depending on the relative energy.
This result overlaps perfectly with a fit of D04 to the full data set of Junghans et al. Jun03 which gives eV b. A fit of the Baby et al. (p,) data to the D04 model yields a very similar result, eV b. When fitting D04 to the Hammache et al. Ham01 data set, we obtain a smaller central value of eV b, but the error bar still overlaps with ours.
VI Conclusions
We conclude that at sufficiently high incident energy, a high-resolution exclusive Coulomb-dissociation experiment can provide a rather precise value for the low-energy 7Be(p,)8B cross section. Among other conditions to be fulfilled, the efficiency of the method as a function of proton-7Be relative energy has to be modelled precisely. By setting tight constraints to the scattering angle and analyzing proton-7Be angular correlations, a significant contribution from E2 multipolarity could be excluded. Compared to our first study of 8B Coulomb dissociation Iwa99 , we could base this conclusion on carefully measured angular distributions. In contrast to our earlier publication Sch03 , our re-analyzed results for the astrophysical factor follow closely the energy dependence as predicted by the refined cluster-model description of Descouvemont Des04 . This finding is in line with the most recent measurements of the 7Be(p,)8B reaction. The combined statistical and systematic errors of our fit value for amounts to 6.6%; a similar error contribution of about 5% comes from the model uncertainty Des04 .
Acknowledgements.
The authors wish to thank K.-H. Behr, K. Burkard, and A. Brünle for technical assistance. Vivid discussions with B. Davids, P. Descouvemont, M. Hass, and A. Junghans are gratefully acknowledged.References
- (1) Q.R. Ahmad et al., Phys. Rev. Lett. 89, 011301 and 011302 (2002).
- (2) SNO Collaboration, arXiv:nucl-ex/0502021(2005).
- (3) J.N. Bahcall and M.H. Pinsonneault, Phys. Rev. Lett. 92, 121301 (2004).
- (4) S. Turck-Chieze et al., Phys. Rev. Lett. 93, 211102 (2004).
- (5) F. Hammache et al., Phys. Rev. Lett. 86, 3985 (2001).
- (6) F. Strieder et al., Nucl. Phys. A696, 219 (2001).
- (7) L.T. Baby et al., Phys. Rev. Lett. 90, 022501 (2003).
- (8) A.R. Junghans et al., Phys. Rev. C 68, 065803 (2003).
- (9) P. Descouvemont and D. Baye, Nucl. Phys. A567, 341 (1994).
- (10) T. Kikuchi et al., Phys. Lett. B 391, 261 (1997); T. Kikuchi et al., Eur. Phys. J. A 3, 213 (1998).
- (11) B. Davids et al., Phys. Rev. C 63, 065806 (2001).
- (12) N. Iwasa et al., Phys. Rev. Lett. 83, 2910 (1999).
- (13) F. Schümann et al., Phys. Rev. Lett. 90, 232501 (2003).
- (14) A.M. Mukhamedzhanov, C.A. Gagliardi, and R.E. Tribble, Phys. Rev. C 63, 024612 (2001).
- (15) L. Trache, F. Carstoiu, C.A. Gagliardi, and R.E. Tribble, Phys. Rev. 69, 0322802(R) (2004).
- (16) D. Cortina-Gil et al., Nucl.Phys. A720, 3 (2003).
- (17) B. Davids and S. Typel, Phys. Rev. 68, 045802 (2003).
- (18) P. Descouvemont, Phys. Rev. C 70, 065802 (2004).
- (19) D.R. Tilley et al., Nucl. Phys. A745, 155 (2004).
- (20) L. Koester, K. Knopf, and W. Waschkowski, Z. Physik A 312, 81 (1983).
- (21) C. Angulo et al., Nucl. Phys. A 716, 211 (2003.)
- (22) F.M. Nunes, R. Crespo, and I.J. Thomson, Nucl. Phys. A 615, 69 (1997).
- (23) G. Baur, C.A. Bertulani, and H. Rebel, Nucl. Phys. A458, 188 (1986).
- (24) K. Alder, A. Bohr, T. Huus, B. Mottelson, and A. Winther, Rev. Mod. Phys. 28, 432 (1956).
- (25) C.A. Bertulani, Phys. Rev. C 49, 2688 (1994); Z. Physik A 356, 293 (1996).
- (26) S. Typel, H.H. Wolter, and G. Baur, Nucl. Phys. A 613, 147 (1997), implemented as code CDXS by S. Typel (2002).
- (27) A. Winther and K. Alder, Nucl. Phys. A319, 518 (1979).
- (28) C.A. Bertulani and M. Gai, Nucl. Phys. A636, 227 (1998).
- (29) E.O. Alt, B.F. Irgaziev, and A.M. Mukhamedzhanov, Phys. Rev. C 71, 024605 (2005).
- (30) H. Esbensen, Phys. Rev. C 70, 047603 (2004).
- (31) H. Esbensen, G.F. Bertsch, and K.A. Snover, Phys. Rev. Lett 94, 042502 (2005).
- (32) H. Geissel et al., Nucl. Instr. Methods Phys. Res., Sect. B 70, 286 (1992).
- (33) H. Kumagai et al., Nucl. Instr. Methods Phys. Res., Sect. A 470, 562 (2001).
- (34) P. Senger et al., Nucl. Instr. Methods Phys. Res., Sect. B 327, 393 (1993).
- (35) GEANT Detector Description and Simulation Tool, CERN Program Library Long Writeup W5013 (1993).
- (36) J. Mortimer, I.J. Thompson, and J.A. Tostevin, Phys. Rev. C 65, 064619 (2002).
- (37) N.C. Summers and F.M. Nunes, arXiv nucl-th/0410109 (2005).
- (38) B.W. Filippone, A.J. Elwyn, C.N. Davids, D.D. Koetke, Phys. Rev. C 28, 2222 (1983).
- (39) F. Schümann, Ph.D. Thesis, Ruhr-Universität Bochum (2002); http://www.ep3.ruhr-uni-bochum.de/schuemann/dissertation.htm (in German).
- (40) K. Ogata et al., nucl-th/0505007 (2005), submitted to Phys. Rev. C.