Experimental study of beta decay using CdZnTe detectors
Abstract
A search for the 4-fold forbidden beta decay of has been performed with CdZnTe semiconductors. With 0.86 kg d of statistics a half-life for the decay of yrs has been obtained. This is in good agreement with published values. A comparison of the spectral shape with the one given on the Table of Isotopes Web-page shows a severe deviation.
I Introduction
In past decades the investigation of -decay played a major role
in understanding the structure of weak interactions.
Nowadays, such studies seem to be a little bit out of fashion, but
there are still a lot of interesting problems to be investigated.
Among them is the measurement of higher order transitions like
4-fold forbidden non-unique decays.
Their log ft-values are larger than 20 and correspondingly half-lives
around yrs and longer have to be measured.
Only three isotopes of this type are known, ,
and . No beta spectrum measurement is reported for
and only two recent half-life determinations for Pfeiffer et al. (1979); Barabanov et al. (2004).
The transition is characterised as a
transition with a log ft-value estimated to be 23.2 Singh et al. (1998)
(Fig. 1).
A first attempt to measure this decay with a small CdTe device
resulted in a rather large half-life range of yrs
as reported in Mitchell and Fischer (1988). Two more recent measurements using exist.
One measurement using the material as a scintillator resulted in a half-life
of yrs Danevich et al. (1996).
The second experiment used as a cryogenic
bolometer and obtained a half-life of yrs Alessandrello et al. (1994).
Here, we report on a completely independent new experimental approach
by using room temperature CdZnTe semiconductor detectors.
The measurement has been performed within the programme of test measurements for the new
COBRA double beta decay experiment Zuber (2001).

II Experimental setup
The data presented are obtained with four 1 cm3 CdZnTe
detectors provided by eV-PRODUCTS based on coplanar grid technology,
i.e. reading out only the electron signal. Measurements have been
performed in the Gran Sasso Underground Laboratory (LNGS) in Italy
providing a shielding of about 3500 mwe. The four bare detectors are
mounted in a copper brick with all preamplifier electronics moved
to about 25 cm distance. This copper brick itself is part of a
cm)3 cube made out of electropolished copper and a further passive
shielding of 15 cm of lead. The whole setup is located in
a Faraday cage made from copper plates. The cage is surrounded by a neutron shield,
consisting of 7 cm thick boron-loaded polyethylene plates and
additional 20 cm of paraffin wax at the bottom. The full paraffin shielding
was finished at a later stage.
The energy resolution and stability of the detectors is calibrated regularly with the help of
, and sources. For the four detectors a CAMAC based
data acquisition system
is used. The signals are fed into four 13-bit peak sensing ADCs (types LeCroy 3511 and 3512).
III Data extraction
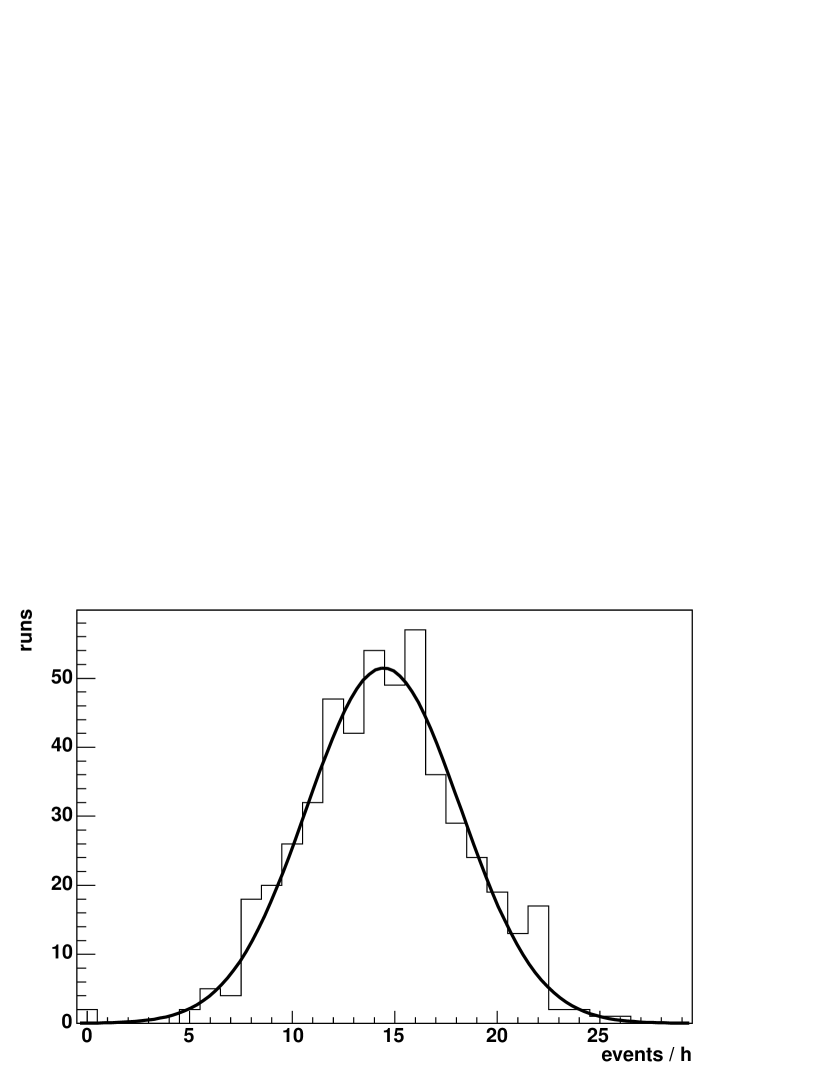
The total measuring period consists of 4781 h. Each individual run is limited to one hour. However, some data cleaning has been necessary for this low energy range. Due to noise problems several run periods had to be performed with rather high discriminator thresholds. As a consequence, one detector cannot be used for the low energy analysis presented here. Thus 25 % of the total data had to be rejected. In addition, some data sets had to be rejected because of short term distortions of the detectors. If the event rate per hour is histogramed, the distorted runs can easily be identified by having exceptional high event rates (Fig. 2). This has been done for every detector independently. In this way further 57 runs were discarded. An instability in the threshold leads to a loss of 12 days for one of the ADCs.
For this purpose rather high energetic calibration sources were used, thus the datasets have been checked independently for background lines in the region of the decay. It has been found that the 351.9 keV gamma line from the decay chain, which is located just next to the endpoint of the beta spectrum, gives a suitable handle on the quality of the calibration in the low energy region. The final set of good data has been selected by checking the position of this gamma line for each measurement period and taking its position into account for the final calibration. The final sample comprises a statistics of 0.86 kgd.
IV Results
IV.1 Half-life of decay
The spectral shape of the energy spectrum of electrons emitted in a 4-fold forbidden non-unique beta decay cannot be predicted by theory, hence we follow the procedure described in Danevich et al. (1996). A model spectrum is built using the form
| (1) |
with as the Fermi function, the endpoint energy of the beta spectrum, the electron momentum and the kinetic energy of the electron. The correction function is assumed to be a polynomial of the form
| (2) |
with as the neutrino momentum. Such a high order polynomial provides a reasonable fit and is motivated by theoretical arguments on 4-fold forbidden unique beta decay. However, the decay of is known to be non-unique and it is not obvious that this spectral shape is correct. The correction functions used in this analysis are based on the measurement of the coefficients given by Danevich et al. (1996).
The corresponding model spectrum is folded with the detection efficiency, calculated with a Monte Carlo simulation based on GEANT4. Due to the short range of low energy electrons in CdZnTe the effect on the spectrum is marginal and corresponds to only a modest shift of the maximum of 0.2 percent.
To get a more sophisticated energy resolution for the low energy regime, intensive post calibrations have been done using , , , , and sources. The measurements can be described well by a linear dependence of the energy resolution as a function of energy in the range of 100 keV - 1.4 MeV. For the collected data the energy resolution is extrapolated from the high energy calibrations done during the measurements resulting in an energy resolution (FWHM) averaged over the detectors of
| (3) |
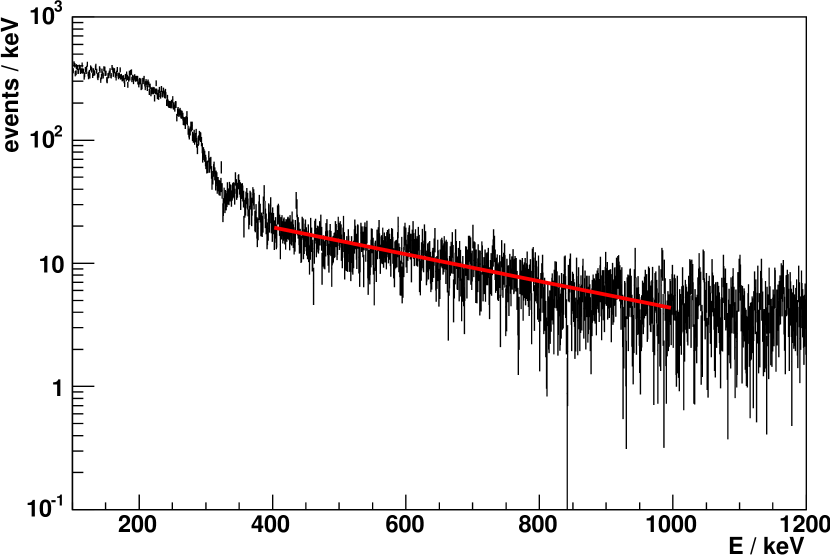
Before fitting the experimental data with the polynomial form, a background component is subtracted from the single spectra. Therefore, an exponential background of the form
| (4) |
is fitted first, well motivated by the observed data (Fig. 3). To avoid any contribution of the beta spectrum itself the background fit is done using the energy range from 400-1000 keV. The noise threshold is not included in the fit, it is well below the chosen boundaries for the spectral fit described below. Before performing the fit, the 351.9 keV gamma line with its Compton spectrum is removed for each detector independently. Again, this is based on a GEANT4 simulation of energy depostion of external 351.9 keV gammas in a CdZnTe detector, smeared with the measured energy resolution.
An absolute calibration of the detectors has been performed after the measurements. Here, a source has been used to determine the relative efficiency of the detectors. Normalising to the most efficient detector, the remaining two had an efficiency of 67 % and 80 % respectively Kiel (2005). The major additional uncertainty is the active volume. However, various information about the detectors provided by the supplier and the observation of alpha particles created at the surface lead to a conservative upper limit of regions with reduced signals of 10 %.
Finally, the three individual spectra are summed taking the efficiency of the three detectors into account. The fit interval ranges from 120 keV 310 keV, the endpoint of the expected spectrum using the latest number on atomic masses is keV Audi et al. (2003). The fit range contains a total of about 37000 events, 12.6 % can be ascribed to background.
Systematic effects have been checked by varying the ranges of the fits for the signal and the background regions, as well as the energy resolution which has been folded with the theoretical spectrum. All these variations cause an effect on the calculated half-life of less than 1%. The slight difference in spectral shape between the two best fit spectra of Danevich et al. (1996) and Alessandrello et al. (1994) is negligible, being washed out by the energy resolution. As the typical Zn admixture is between 7-11 %, the uncertainty in the amount of in the detector material is 1.8 %.
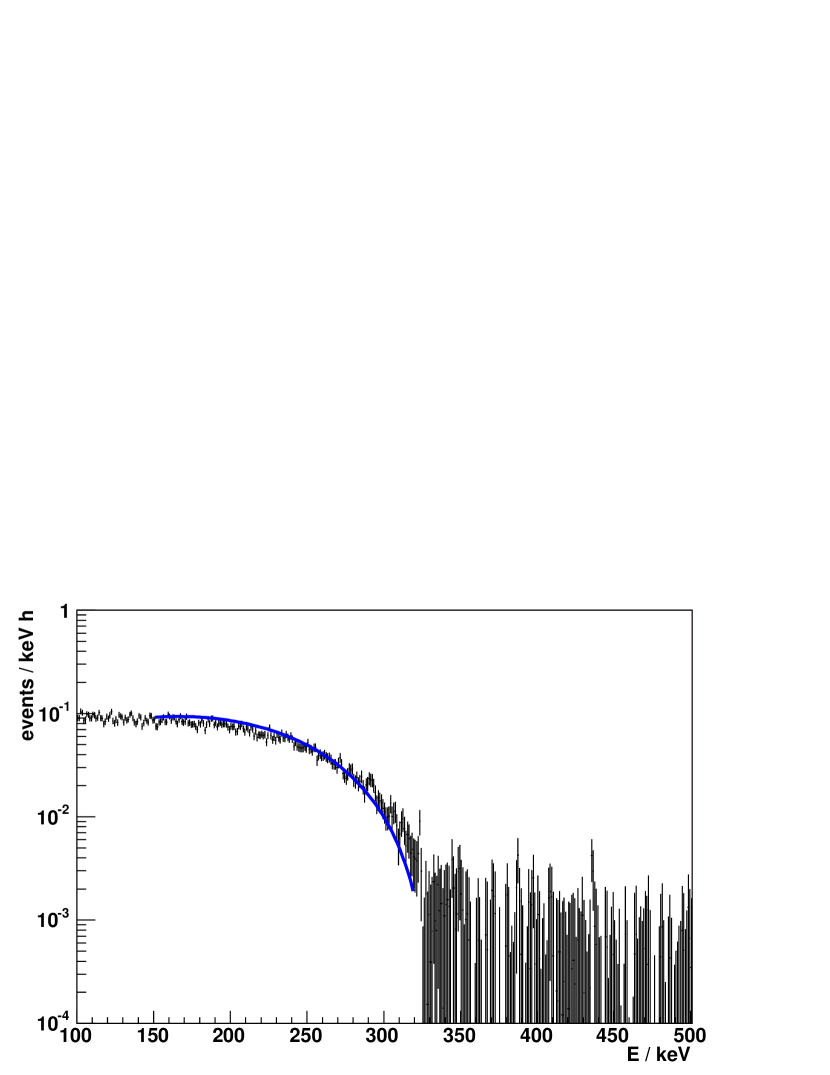
The combined energy spectrum is shown in Fig. 4. Using the spectral shape of Danevich et al. (1996) including their best fit values results in a decay rate of per hour and thus a half-life of
| (5) |
This half-life is in good agreement with the values quoted in Alessandrello et al. (1994); Danevich et al. (1996). Note that the half-life has not been determined by a real fit to the spectral shape, only the normalisation of the fixed spectral shape has been changed. The individual numbers including only statistical uncertainties are yrs, (Detector 1), yrs, (Detector 3) and yrs, (Detector 4).
IV.2 Spectral shape of the beta spectrum
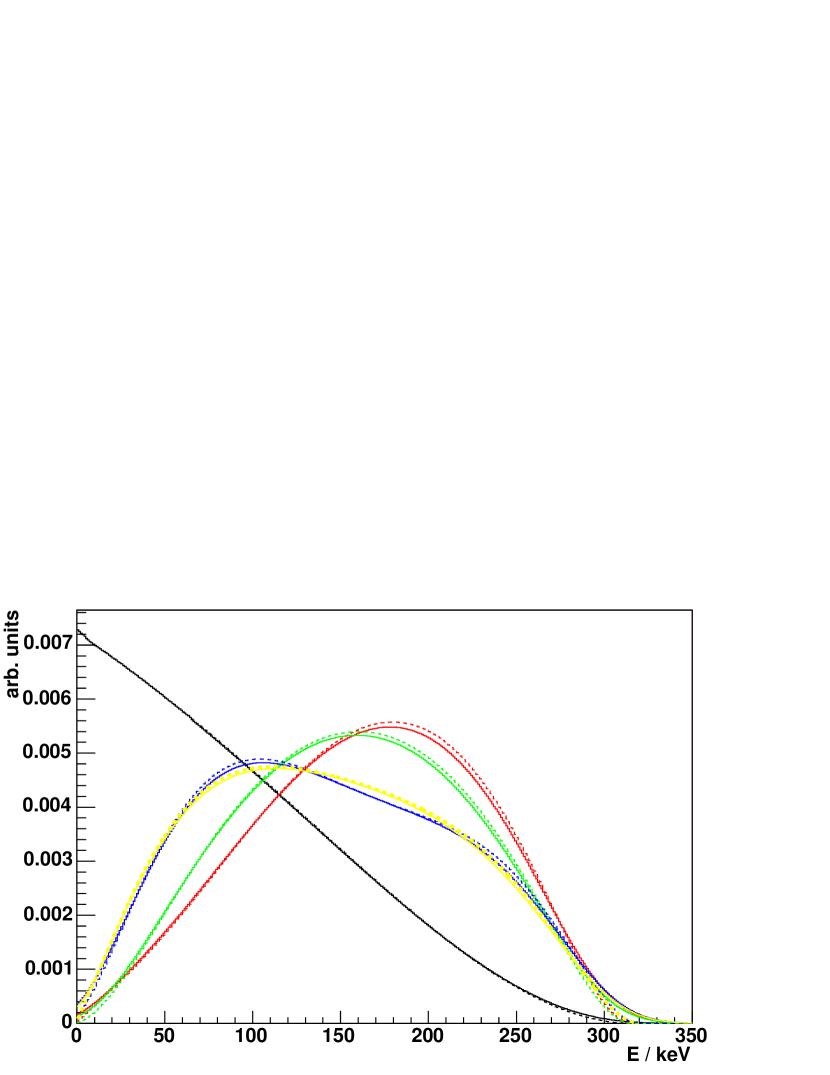
Trying a real fit to the data in order to determine a half-life suffers from a number of problems: Several options exist
to describe a 4-fold forbidden non-unique beta decay spectrum. They are compiled in Fig. 5 and
are already smeared with the energy resolution.
The spectra of Danevich et al. (1996) and Alessandrello et al. (1994) agree reasonably well. Another option is to compare the spectral shape with the one obtained
for the 4-fold forbidden non-unique -decay of and to rescale
it to the Q-value of . In Pfeiffer et al. (1979) a polynomial is introduced to describe
the spectrum. During the development of a low-energy solar neutrino detector based on
an In-loaded scintillator (LENS) the beta spectrum of has been remeasured and their
best fit values Schoenert and Pandola (2004)
were used to obtain the spectrum shown in Fig. 5. Last, but not
least, the spectrum from the Table of Isotopes Web-page can be used
http://ie.lbl.gov (2004).
The measured sum spectrum obtained with the CdZnTe detectors agrees reasonably well with the one expected
from . However, it would have a significant effect on the event number and thus the half-life,
if extrapolated below 120 keV, because the maximum is below 100 keV.
Additionally, in this energy region the noise threshold for
the measurement has to be considered. Approximating the threshold by an exponential function and subtracting
it from the total spectrum results in a residual which looks more like the spectrum from
Danevich et al. (1996) and Alessandrello et al. (1994). Thus, it was decided to use their spectral shape, because they have
already performed measurements of the spectrum below 100 keV.
To solve this issue of different spectral shapes completely, the spectrum has to be measured
down to at least 50 keV, which will be possible with the next step of COBRA, consisting of 64 detectors.
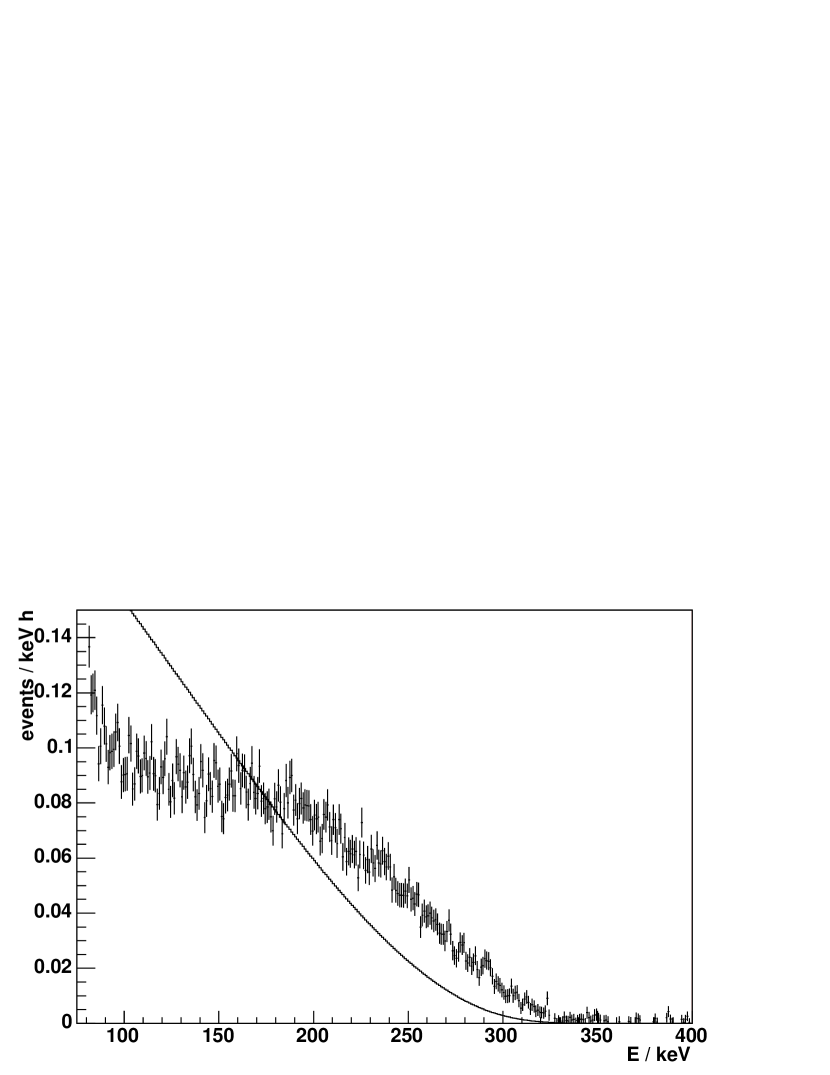
In addition to the polynomial approach, the
electron energy spectrum of the Table of Isotopes Web-page has
been applied http://ie.lbl.gov (2004). The efficiency correction and energy
folding is done analogously to the procedure described before.
This spectrum approaches zero only in the lowest energy bin.
As can be seen in Fig. 6 the spectral shape is not
reproduced in the data. The spectra are normalised to the total
number of events in the range of 100-320 keV.
V Summary
A new double beta decay experiment COBRA is planned using CdZnTe semiconductor detectors. As a side product of the test measurements for this project, the 4-fold forbidden non-unique -decay of has been measured. A first observation using four crystals clearly shows the signal, but only three of them could be used for a reliable half-life determination. The half-life measurements obtained from each of the detectors are in good agreement with each other and with published values. In the near future 64 CdZnTe detectors will be running, allowing a precision measurement and systematic studies of this decay by extracting single independent values for each detector. This will also include lower noise thresholds allowing the uncertainty which arises from the lack of knowledge of the spectral shape to be removed.
VI Acknowledgement
K. Zuber is supported by a Heisenberg-Fellowship of the Deutsche Forschungsgemeinschaft. We thank R. Firestone and J. Suhonen for useful discussions and comments. We are grateful to the LENS collaboration, especially S. Schoenert and L. Pandola for providing their new spectrum parameters. In addition, we thank the Forschungszentrum Karlsruhe, especially K. Eitel, for providing the material for the neutron shield. We thank the mechanical workshop of the University Dortmund for their support and the Laboratori Nazionali del Gran Sasso (LNGS) for offering the possibility to perform measurements underground.
References
- Pfeiffer et al. (1979) L. Pfeiffer et al., Phys. Rev. C 19, 1035 (1979).
- Barabanov et al. (2004) I. Barabanov et al., Poster at Neutrino 2004 (2004).
- Singh et al. (1998) B. Singh et al., Nucl. Data Sheets 84, 487 (1998).
- Mitchell and Fischer (1988) L. Mitchell and P. Fischer, Phys. Rev. D 38, 895 (1988).
- Danevich et al. (1996) F. Danevich et al., Phys. Atom. Nucl. 59, 1 (1996).
- Alessandrello et al. (1994) A. Alessandrello et al., Nucl. Phys. B Proc. Suppl. 35, 394 (1994).
- Zuber (2001) K. Zuber, Phys. Lett.B 519, 1 (2001).
- Kiel (2005) H. Kiel, http://hdl.handle.net/2003/21509 (2005).
- Audi et al. (2003) G. Audi et al., Nucl. Phys. A 729, 337 (2003).
- Schoenert and Pandola (2004) S. Schoenert and L. Pandola, private communication (2004).
- http://ie.lbl.gov (2004) http://ie.lbl.gov (2004).