Higher-twist analysis of moments of spin structure function
Abstract
Available analyses on moments of the spin structure function use different methods and are barely consistent with each other. We present a higher twist analysis of using a method consistent with the studies of and already published. The twist-4 coefficient is extracted. One result is that the higher twist coefficients seem to alternate signs: the relatively larger twist-6 contribution is partly suppressed by the twist-4 and twist-8 contributions. The size of twist-6 can be due to the elastic contribution to the moments.
High precision data on doubly polarized electron-nucleon scattering from Jefferson Lab (JLab) have been analyzed in the transition regime from asymptotically free to strongly interacting quarks [References,References,References,References]. Studying quark-gluon and quark-quark interactions is important to understanding quark confinement. Such study can be cast in the Operator Product Expansion (OPE) formalism, which describes in particular the evolution of structure functions and their moments. The Cornwall-Norton moment is the integral of the structure function over . Here, is the Bjorken variable, is the four-momentum transfer from the electron to the nucleon, is the energy transfer and is the nucleon mass. In OPE, the first moment of can be written as:
,
where the are sums of twist elements added up to twist . The twist is defined as the mass dimension minus the spin of an operator. Twist elements can be related to quark-quark and quark-gluon interactions. Hence they are important quantities for confinement study. The leading twist coefficient is:
where and are flavor non-singlet and singlet Wilson coefficients that represent the -dependence due to QCD radiations [References], is the triplet axial charge [References], is the octet axial charge [References] and is the singlet axial charge. In the renormalization scheme that will be used here, where is the contribution of the quarks to the nucleon spin. The next to leading order twist coefficient is:
() is a twist two (three) target mass correction that can be related to higher moments of (of and ), and is the twist four contribution [References].
OPE analysis can also be carried out using Nachtmann moments [References], in which the target mass corrections are done by an appropriate combination of and in the moment’s definition. Such an analysis of the new JLab EG1a data have been carried out on [References]. On the other hand, analysis of [References] and the flavor non-singlet [References] were done using Cornwall-Norton moments. The results at GeV2 for are (stat)(syst)(low )(), and (uncor.)(cor.) where uncor. (cor.) specifies the error due to the uncorrelated (correlated) experimental uncertainty. The results are (stat)(syst)(low )(), and (uncor.)(cor.) where the asterisk in recalls that this coefficient contains only a twist 6 term.
These results, while coming from the same set of data, barely agree. The disagreement could come from the fact that the low- extrapolation procedures differ in the three analyses, or the lower considered for the fits are different (1 GeV2 for p, 0.5 for n and 0.8 for p-n), or the target mass corrections are treated differently in the Nachtmann and Cornwall-Norton analyses: in the Nachtmann moments, target mass corrections are added to all orders while in the Cornwall-Norton analyses, only the first order is corrected for. The Cornwall-Norton analyses indicate that twist 4 and twist 6 terms are of similar magnitude (although twist 6 is larger) but opposite sign, leading to a partial cancellation of higher twist effects. This is not as clear from the Nachtmann analysis. To clarify this issue, it would be beneficial to provide consistent OPE analysis of the data. In that light, we have redone a Cornwall-Norton analysis of the data consistent with the and analyses.
The low extrapolation of the JLab and world data was redone, as in the and analyses, using the Thomas-Bianchi parametrization [References] up to the invariant mass squared GeV2. The uncertainty was estimated by varying all the parameters within their range given in [References]. A Regge form [References] was used beyond GeV2 on which an uncertainty of 100% was assumed. The elastic contribution to the moments was estimated using the parametrization of Mergell et al. [References]. A 2% uncertainty was assumed. The JLab EG1a experiment (that will mainly determine the higher twist magnitude) is dominated by systematic uncertainties. Its point to point uncorrelated systematic uncertainties were separated from its correlated ones, and added in quadrature to its statistical uncertainty. This error was used in the OPE fit. The effect of the point to point correlated uncertainty was accounted for by shifting the EG1a data set and using it as a new input in the fit.
Fitting the world data for GeV2 and assuming no higher twist effects above GeV2 yields . The target mass correction , where contains only a twist-2 contribution, was estimated with the parton distribution parameterization of J. Bluemlein and H. Boettcher [References]. The twist-3 contribution was obtain from the SLAC E155x experiment [References]. Although accounting for the dependence had little effect on the fit, a dependence of the form was assumed for and with and respectively. was used in computing .
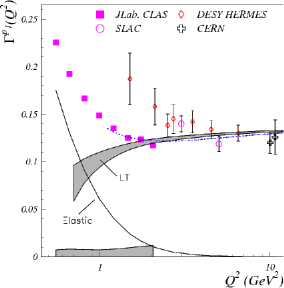
The world data together with the OPE leading twist evolution (LT) of and the elastic contribution to are shown in the figure below. The band at zero is the point to point correlated uncertainty on the JLab EG1a data. The dot-dashed line is the result of fit 1 (see table).
To check the convergence of the OPE series, the lowest value, was varied, as well as OPE series truncated to twist-8. The results are given in the table below. All the twist coefficient values are given for =1 GeV2. The first error represents the uncorrelated uncertainty, coming mainly from the statistical uncertainty, and the second is the point to point correlated uncertainty.
| fit | |||||
|---|---|---|---|---|---|
| 1 | 1.0 | -0.1380.024 | -0.0550.011 | 0.110 | - |
| 2 | 0.8 | -0.120 | -0.047 | 0.099 | - |
| 3 | 0.8 | -0.144 | -0.057 | 0.124 | -0.014 |
| 4 | 0.6 | -0.160 | -0.064 | 0.143 | -0.026 |
All the fit results are very consistent with each others. In fits 4 and 6, the smallness of tends to indicate the convergence of the OPE series. There is good agreement between the and analyses and our analysis, although the central values differ noticeably. Also, our results show the same trend as the results from the neutron [References] and Bjorken sum analysis [References]: The coefficient tends to display an opposite sign as the coefficient. The alternation of signs seems to continue with , which indicates that the overall effects of higher twist are suppressed. This would indicate that we should expect hadron-parton duality [References] to hold for at the scale at which the higher twist coefficients were extracted. The fact that stands out as the largest coefficient is, candidly, not surprising since in our ranges, the -behavior is dominated by the elastic contribution which roughly behaves as . This feature was also seen in the Bjorken sum analysis but not in the neutron analysis in which the elastic contribution is smaller.
These results can be compared to non-perturbative model predictions: [References], (QCD sum rules [References]), (MIT bag model [References]) and (instanton model [References]). As for the extracted and , all the predictions are negative. The MIT bag model and QCD sum rules agree best with the fit results, although the other predictions are not ruled out.
Although agreeing well within uncertainties, from the analyses [References] and [References]. This comes from the fact that the extracted from the proton and neutron analysis are very different: . This implies that the asymptotic values for the , and that anchor the OPE evolutions used in the fit are inconsistent. As an example, an offset of the Bjorken sum asymptotic value of changes the value of at GeV2 by a factor 2 and the value of by 50%.
From the result of fit 1, we can extract the proton color polarizabilities which are the responses of the color magnetic and electric fields to the spin of the proton [References,References]: and . As for the neutron, these are of opposite sign and compatible with zero.
The fact that the higher twist effects are small (at GeV2) is somewhat surprising and exciting. However, it implies that accurate measurements are more delicate: the size of the uncertainty is presently of the size of the central value itself. In particular, the high energy missing part, very substantial for the JLab data, introduces a significant uncertainty. The 12 GeV upgrade of JLab will improve on this issue and push the -coverage of the measurements. It will help in measuring the higher twist coefficients precisely.
Acknowledgments
This work was supported by the U.S. Department of Energy (DOE) and the U.S. National Science Foundation. The Southeastern Universities Research Association operates the Thomas Jefferson National Accelerator Facility for the DOE under contract DE-AC05-84ER40150.
References
- [1] R. Fatemi et al., Phys. Rev. Let. 91, 222002 (2003).
- [2] J. Yun et al., Phys. Rev. C67, 055204 (2003).
- [3] M. Amarian et al., Phys. Rev. Lett. 89, 242301 (2002)
- [4] M. Amarian et al., Phys. Rev. Lett. 92, 022301 (2004)
- [5] S.A. Larin, T. van Ritbergen and J. A Vermaseren, Phys. Lett. B404, 153 (1997)
- [6] K. Hagiwara et al., Phys. Rev. D 66, 010001 (2002)
- [7] E.V. Shuryak and A.I. Vanshtein, Nucl. Phys. B201, 141 (1982)
- [8] S. Wandzura, Nucl. Phys. B122, 412 (1977)
- [9] M. Osipenko et al., Phys. Lett. B609, 259 (2005)
- [10] Z-E Meziani et al., Phys. Lett. B613, 148 (2005)
- [11] A. Deur et al., Phys. Rev. Lett. 93, 212001 (2004)
- [12] N. Bianchi and E. Thomas, Phys. Lett. B450, 439 (1999)
- [13] S. D. Bass and M. M. Brisudova, Eur. Phys. J. A4, 251 (1999)
- [14] P. Mergell, Ulf G. Meissner, D. Drechsel, Nucl. Phys. A596, 367 (1996)
- [15] J. Bluemlein and H. Boettcher, Nucl. Phys, B636, 225 (2002)
- [16] P. L. Anthony et al., Phys. Lett. B553, 18 (2003)
- [17] E. Stein et al., Phys. Lett. B353, 107 (1995)
- [18] X. Ji, hep-ph/9510362
- [19] W. Melnitchouk, R. Ent and C. Keppel. Phys. Rept. 406, 127 (2005)
- [20] I.I. Balitsky, V. M. Braun and A.V. Kolesnichenko, Phys. Lett. B242, 245 (1990), 318 648(E) (1993)
- [21] X. Ji, W and Melnitchouk, Phys. Rev. D56 1. (1997)
- [22] N-Y. Lee, K. Goeke and C. Weiss, Phys. Rev. D65 054008 (2002)