Present address: ]Alix Partners, Dallas, TX
Present address: ]Argonne National Laboratory, Argonne, IL
Scattering of 7Be and 8B and the astrophysical S17 factor
Abstract
Measurements of scattering of 7Be at 87 MeV on a melamine (C3N6H6) target and of 8B at 95 MeV on C were performed. For 7Be the angular range was extended over previous measurements and monitoring of the intensity of the radioactive beam was improved. The measurements allowed us to check and improve the optical model potentials used in the incoming and outgoing channels for the analysis of existing data on the proton transfer reaction 14N(7Be,8B)13C. The results lead to an updated determination of the asymptotic normalization coefficient for the virtual decay 8B 7Be + . We find a slightly larger value, fm-1, for the melamine target. This implies an astrophysical factor, eVb, for the solar neutrino generating reaction 7Be(,)8B.
pacs:
24.10.Ht; 25.60.Bx; 25.60.Je; 26.65.+tI Introduction
Measurements of the energetic neutrinos produced in 8B beta decay have played a prominent role in our new understanding of neutrino properties (see Davis et al. (1968); S. Fukuda et al. (2001); S. N. Ahmed et al. (2003); Bahcall and Pinsonneault (2004); Haxton et al. (2005) and references therein). 8B is produced in the sun by the 7Be(,)8B reaction. A good understanding of this reaction rate is needed in order to calculate the expected neutrino flux in the standard solar model Bahcall and Pinsonneault (2004). The determination of the astrophysical S17 factor has, therefore, been the subject of intense experimental and theoretical effort over the past decade. This work has been summarized in several recent publications Davids and Typel (2003); Junghans et al. (2003); Cyburt et al. (2004). In spite of these efforts, there is no clear consensus on the value of S17(0) at the desired 5% precision. Consequently, several new experiments are under way or planned.
We previously reported measurements of the asymptotic normalization coefficients (ANC) for 8B using the proton transfer reactions 10B(7Be,8B)9Be Azhari et al. (1999a) and 14N(7Be,8B)13C Azhari et al. (1999b). The ANCs determine the amplitude of the tail of the overlap integral of the ground state wave function of 8B onto the two-body channel 7Be + . To find the ANCs with the 14N(7Be,8B)13C transfer reaction, a distorted wave Born approximation (DWBA) calculation is carried out and compared to the measured data. The DWBA calculation needs optical model parameters (OMP) for both the incoming 7Be+14N and outgoing 8B+13C channels. Here we report a measurement of 7Be elastic scattering on a melamine (C3N6H6) target, where we doubled the angular range and improved the monitoring of the intensity of the 7Be radioactive beam relative to our previous measurement Azhari et al. (1999b). The extension of the angular range was done to obtain a better determination of the optical potential in the incoming channel. We also measured the elastic scattering of a 8B beam on a C target with the aim of checking, for the first time, the OMP that were used in the outgoing channel 8B+13C.
Below we describe the radioactive beam production, the experimental setups, and the procedure for the data reduction. We then give results of calculations for optical potentials in both the incoming and outgoing channels based on a double folding procedure with an effective nucleon-nucleon interaction. We discuss the consequences of the improved secondary beam normalization, and compare revised DWBA calculations to the 14N(7Be,8B)13C data from Ref. Azhari et al. (1999b) in order to extract a new value for the ANCs and the corresponding astrophysical factor S17.
II The experiments
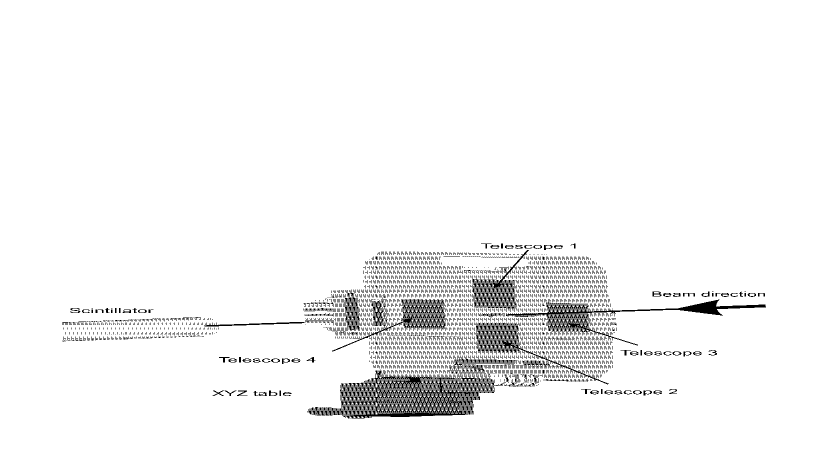
The 7Be radioactive beam was produced and separated using the Momentum Achromatic Recoil Spectrometer (MARS) Tribble et al. (2002). The primary beam was 7Li at 18.6 MeV/A delivered by the K500 superconducting cyclotron at Texas A&M University. It bombarded a liquid nitrogen cooled H2 gas target at a pressure of 2 atm, with entrance and exit windows of 12 m thick Havar. A secondary beam of 7Be at 12.5 MeV/A was filtered from other reaction products by MARS. The characteristics of the beam spot, which were measured with a 900 m thick two-dimensional Position Sensitive Silicon Detector (PSSD) placed at the MARS focal plane (the target detector), were a spot size of 2.5 mm 3.6 mm FWHM (horizontal vertical) and an angular spread of . The purity of the 7Be beam was 99% at an average rate of 80 kHz. Alpha particles were the primary contaminant. For a detailed description of radioactive beam production with MARS, see Ref. Azhari et al. (2001). Following beam tuning, the secondary target, a melamine foil with a thickness of 1.5 mg/cm2, was moved into the beam spot. Four cm2 PSSDs were placed symmetrically around the target on an aluminum plate, as shown in Fig. 1. Detectors 1 and 2 (110 m thick) covered a laboratory angular range from 4∘ to 19∘, and detectors 3 and 4 (65 m thick) covered 16∘ to 30∘. All four PSSDs were backed by 500 m thick silicon detectors providing particle identification spectra (). Each PSSD was position calibrated using a mask with 6 slots that were 0.8 mm wide and were spaced 8 mm apart. The detectors were cooled to approximately C with two electric thermocoolers fixed on the aluminum plate in order to decrease the inverse current in the detectors and minimize their noise. The assembly was placed on a XYZ optical table for precise positioning.
In our previous experiments with a 7Be beam Azhari et al. (1999a, b), the number of secondary beam particles was determined indirectly by measuring the intensity of the 7Li primary beam in a Faraday cup, and normalizing the yield at low primary beam intensities by counting the 7Be with the target detector. Periodically (typically once a day) the calibration procedure was repeated to check for any rate variations due to drifts in MARS power supplies. The primary 7Li beam intensity was substantially higher for the experiment on the melamine target Azhari et al. (1999b) than the experiment on the 10B Azhari et al. (1999a) target.
Following these two measurements, we modified the experimental setup by adding a monitor detector to count the radioactive beam particles directly. The beam monitoring system, which is shown in Fig. 1, used a wire mesh screen to reduce the secondary beam intensity and a plastic scintillator coupled with a photomultiplier tube to count the radioactive beam particles that passed through the target. In parallel, we ran the old monitoring system with a Faraday cup for the primary beam, and compared the results. In subsequent measurements with a high-intensity 11B primary beam, we observed a difference between the two normalization procedures. Beam heating reduced the density of the gas in the production target, causing a drop in the isotope production rate per nA of primary beam current and increasing the central beam energy.
By scaling the heat deposition of the beam in the gas target, we concluded that this effect may have produced a small but non-negligible shift in the beam normalization during the previous 14N(7Be,8B)13C experiment. The effect was to over estimate the number of secondary beam particles and hence reduce the cross section and the resulting ANC. In contrast, the primary beam intensity for the 10B(7Be,8B)9Be measurement was sufficiently low to have a negligible effect. For the present experiment, the monitor detector was a NE102A plastic scintillator coupled to a photomultiplier tube. To minimize rate-dependent effects in the photomultiplier tube, two screens with a transparency of 9% each were added to attenuate the beam intensity. The yield in the monitor detector was calibrated using the procedure described in Ref. Tang et al. (2003).
For the 8B elastic scattering measurement, the radioactive beam was produced via the 1H(10B,8B)3H reaction using a 27 MeV/A 10B primary beam on the same LN2-cooled gas cell. The cell contained H2 gas at 3 atm pressure, corresponding to a target thickness of 10.8 mg/cm2. Entrance and exit windows were made of 50 m (42 mg/cm Havar. A 137 mg/cm2 Al degrader was placed behind the gas cell to reduce the secondary beam energy. A 95 MeV radioactive beam of 8B was focused at the end of MARS with a rate of about 5 kHz. The beam purity was better than 95%, with particles being the primary contaminant. The full-width energy spread was limited to 1.6 MeV using momentum defining slits. Beam emittance was optimized using a pair of slits after the last quadrupole in MARS. The plastic scintillator behind the target was used for direct counting of the secondary beam particles, in this case without any wire mesh screen. Two telescopes, each consisting of a 110 m thick PSSD backed by a 500 m thick Si detector, observed the secondary reaction products. The telescopes covered the angular range . A 1.9 mg/cm2 C target was used for the elastic scattering measurement.
In both experiments, target properties such as thickness and uniformity were verified using the radioactive 7Be and 8B beams directly by detecting beam particles at with and without the target. The resultant energy loss measurements were compared to calculations with the computer code SRIM Ziegler et al. (1985) to extract the thicknesses.
III Results
III.1 7Be elastic scattering
There were two motivations for measuring elastic scattering of 7Be from melamine. The new detector geometry allowed us to extend the angular region for elastics which, in turn, helps to define optical model parameters. Further, it allowed us to normalize the elastic scattering yield directly by counting 7Be particles after the secondary target.
The kinematic reconstruction of the elastically scattered reaction products was performed using the energy and position information from the four detector telescopes. The events selected corresponded to elastic scattering of 7Be on 14N and 12C since the two contributions could not be separated. First, we identified all the events with () corresponding to 7Be, then we utilized the correlation of 7Be energy vs. scattering angle to select those that were consistent with elastic scattering off either 14N or 12C. This discriminated against scattering on H and inelastic scattering populating excited states in either 14N or 12C. However, it was not possible to separate the elastically scattered events from inelastic scattering leading to the first excited state in 7Be at = 0.429 MeV. We estimated this contribution using data obtained from inelastic scattering of 7Li on 13C at 63 MeV Trache et al. (2003) to the analog state at = 0.477 MeV. Assuming that the deformation lengths are equal for the analog states, we calculated the inelastic cross section for 7Be on 14N and 12C at the current energy and subtracted it from the data. The correction was negligible at all but the largest angles, where it amounted to a few percent. The solid angle calculation as a function of scattering angle was done using a Monte Carlo simulation that took the measured properties of the beam spot and the geometrical specifications of the detector assembly as input data. The procedure has been described in previous publications (e.g. see Ref. Azhari et al. (2001)). Figure 2 shows the resulting angular distribution corresponding to elastically scattered 7Be on 14N and 12C.
The angular distribution predicted from the optical model parameters used in Ref. Azhari et al. (2001) is compared to the data in Fig. 2. The Monte Carlo calculation was used to provide the proper angular distribution that takes into account the finite angular binning in the data.
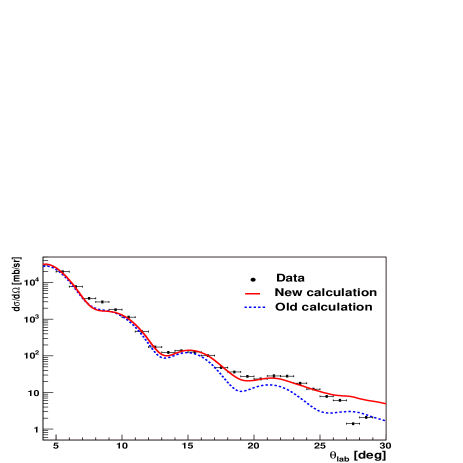
The results of our measurements are compatible with those reported in Ref. Azhari et al. (1999b) at small angles and with the predictions of the optical model calculations done at that time (dotted curve). However, the new experimental data fall above the predictions at larger angles, suggesting a smaller absorption than was assumed in Ref. Azhari et al. (1999b). In order to obtain a better description of the elastic scattering, calculations were carried out with a range of new parameters. These were also used for the entrance channel to generate DWBA predictions for the 14N(7Be,8B)13C proton transfer reaction.
The optical parameters used in Ref. Azhari et al. (1999b) were based on results from an analysis of elastic scattering of loosely bound -shell nuclei Trache et al. (2000), which demonstrated that the data can be described with double-folded potentials. The potentials quoted in Ref. Trache et al. (2000) were obtained from calculated nuclear matter densities folded with an effective nucleon-nucleon interaction (JLM, Jeukenne et al. (1977)), smeared (two range parameters, and ) and renormalized (two strength parameters, and ) to produce:
| (1) |
The calculations for previous 7Be studies were done using the JLM1 effective interaction with standard range parameters: =1.20 fm, =1.75 fm, and average renormalizations =0.37, =1.00 (for details see Ref. Trache et al. (2000) and references therein). These parameters served as the starting point for the new calculations. Elastic scattering of 7Be at 87.7 MeV on 14N and 12C were calculated in the center of mass frame, then transformed into the lab frame and added with weights 1.0 and 0.5, respectively, equal to the ratio of 14N to 12C nuclei in the melamine. The resulting curve was “smoothed” using the Monte Carlo code described above. The parameters for the folding potential were varied simultaneously and identically for both target nuclei. This approach is supported by the fact that both target nuclei are well bound and have similar densities in the surface region and by experiments we have carried out with melamine and C targets using other radioactive beams, such as 13N Tang et al. (2004), 8B (present experiment) and 17F Blackmon et al. (2004). The extended angular coverage of the present data was still not sufficient to attempt an optical model fit with free parameters. Rather, the two normalization and two range parameters were varied. The parameters for various calculations and the reduced values obtained by comparison to the data are presented in Table 1.
Four entries in the Table (A, B, C and H) were obtained by adjusting the renormalization of the real and imaginary parts of the potential. The smearing ranges of the interaction, and , were adjusted for three cases (D, E, F), and the density dependence was adjusted in one case (G) where the JLM2 interaction was used. The best results were obtained for cases D, E, G and H. The small differences between the values show that it is difficult to choose a “best solution”. Rather, we did DWBA calculations for the 14N(7Be,8B)13C transfer reaction for the four most promising potentials. The results are compared to the previous calculations in Table 1.
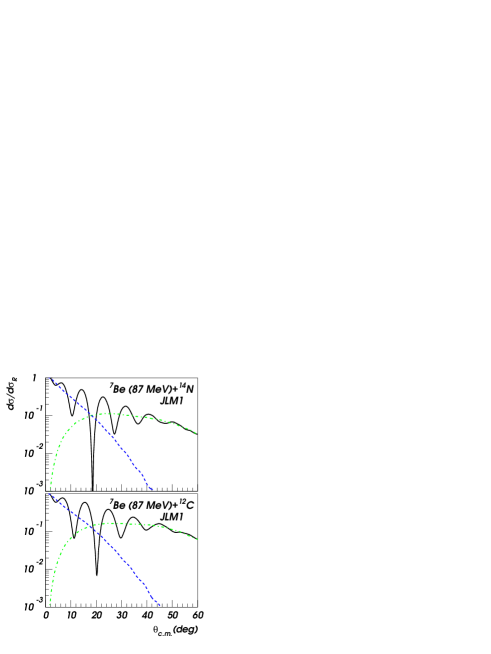
A far/near decomposition of the scattering amplitudes shows that the observed angular range covers the region of Fraunhofer oscillations generated by the interference of the two components (see Fig. 3). Their crossover is around 20∘, and at larger angles the far component becomes dominant. But in the region included in our measurements, the interference is still important. The calculations show that after about 60∘ the angular distributions develop a rainbow type pattern, typical for the cases found recently in our 6,7Li elastic scattering data F. Carstoiu and L. Trache and R. E. Tribble and C. A. Gagliardi (2004).
III.2 8B experiment
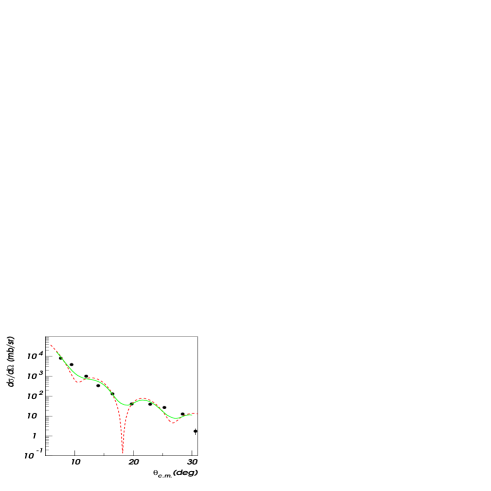
A similar analysis was used for the 8B elastic scattering on a natural C target. The resulting angular distribution is shown in Fig. 4 where it is compared to calculations made with the folded potentials using the average parameters fm, fm, and . The solid (dashed) line shows the results after (before) smoothing with the Monte Carlo calculation. The 8B density used in the folding procedure was that calculated in Trache et al. (2000) using the correct ANC for the last proton. Due to the limited angular range of the data, we did not attempt to produce a better fit by adjusting parameters. Based on the similar densities for 12C and 13C and on results found in cases where scattering on both 12C and 13C were measured, we assume that the parameters (, , , ) extracted for the natural C target are valid for the 8B+13C channel in DWBA calculations of the transfer reaction.
IV Implications for 14N(7Be,8B)13C
Based on the present analysis, the value of the 14N(7Be,8B)13C proton transfer reaction cross section from our previous measurement (Azhari et al. (1999b)) was increased, , to account for the difference of 5.5% found in the absolute normalization. Following the original publication the ratio between the ANCs for the and components in the wave function of the ground state of 8B was found to be from the mirror neutron transfer reaction 13C(7Li,8Li)12C Trache et al. (2003). The previous result had assumed based on theoretical calculations. The new cross section, the value of from experiment, and the new optical model parameters have been used to find revised values of the ANCs for 8B 7Be + from the 14N(7Be,8B)13C proton transfer reaction measurement Azhari et al. (1999b).
In order to extract the ANCs, four terms must be calculated to account for the possible proton transitions:
| (2) | |||||
where the ’s are the calculated DWBA differential cross sections for proton transfer from the and orbitals in 14N to the and orbitals in 8B, the ’s are the ANCs for the single particle orbitals used in the DWBA calculation, and the ’s and ’s are the ANCs for 14N 13C + and 8B 7Be + , respectively. The ANCs, =18.6(12) fm-1 and =0.93(14) fm-1, were measured in Trache et al. (1998); Bem et al. (2000). The calculations were done with the code PTOLEMY Rhoades-Brown et al. (1980). The results of the calculations are given in Table 1 where the value calculated and shown in column 7 is the quantity in the last square bracket in Eq. (2), , integrated over the angular region = 4∘- 25∘ to match the data. This quantity contains the DWBA cross sections weighted with the ANCs for 14N, the single particle ANCs calculated for the appropriate Woods-Saxon proton binding potentials in 8B and 14N and the mixing ratio in the ground state of 8B, . Since the reaction is peripheral, the results do not depend on the geometry assumed for the proton binding potentials, which are chosen to be Woods-Saxon shape with depths adjusted to reproduce the experimental proton binding energies in 8B and 14N, respectively. The results shown were calculated using the reduced radius fm and the diffuseness fm, and the same spin-orbit term as in Ref. Azhari et al. (1999b). The exit channel parameters were fixed to the previous values. Calculations were done at MeV, the energy of the previous experiment with the four optical model sets in Table 1 for the entrance channel that have the lowest , B, D, E, G, and H. In column 8 we give the ratio of the present calculations to the same quantity calculated in Ref. Azhari et al. (1999b). The average of the four results, weighted by the ’s, gives the ratio . The new ANC, calculated with the relation
| (3) |
is fm-1. The overall uncertainty contains contributions from statistics (2.6%), absolute normalization of the cross section (5%), input parameters in the Monte Carlo simulation of the experiment (1.4%), and uncertainties in the ANC for the 14N vertex (6.4%). The contribution of each of these factors remains the same as in the original analysis Azhari et al. (1999b). The uncertainty due to the optical model parameters was taken from the standard deviation of the calculated cross sections (column 7 or 8 in Table 1) and is 5% compared with the previous value of 8.1%.
The relation between the ANCs and the astrophysical factor (0), in eVb, is Xu et al. (1994)
| (4) |
Using the new value of the ANC we find eVb. This value is very close to the value obtained from the reaction 10B(7Be,8B)9Be in Ref. Azhari et al. (1999a) where we found eVb. The weighted average of the two results is eVb.
V Conclusion
Elastic scattering of 7Be at about 12 MeV/A has been measured over an extended angular range on a melamine target. The results provide a better determination of the optical model parameters used for the entrance channel of the 14N(7Be,8B)13C reaction. For the first time elastic scattering of 8B was measured on a C target, thus allowing for a check the optical model parameters used for the exit channel in the DWBA calculation. In the measurement of the 7Be elastic scattering, we directly counted the secondary beam particles. This resulted in a 5.5% increase of the transfer reaction cross section from Ref. Azhari et al. (1999b), which used an indirect method to obtain the secondary beam intensity. We also used the mixing ratio between the and components from a (7Li,8Li) measurement Trache et al. (2003), rather than a theoretical prediction. These improvements lead to the revised value of the ANC for 8B 7Be + from the 14N(7Be,8B)13C reaction of fm resulting in fm-1. This, in turn leads to a larger value for the astrophysical S factor for the 7Be(p,)8B reaction, eVb. This new value is very close to the one from the same reaction on the 10B target Azhari et al. (1999a). Averaging the two results, we obtain eVb from the proton transfer reactions.
Our result for is a bit over 2 lower than the extrapolation of the most recent and precise direct measurement of 7Be(p,)8B by Junghans et al. Junghans et al. (2003). Our central value is about 1.5 lower than the average central value obtained by Cyburt et al. Cyburt et al. (2004) in a recent analysis that uses all of the best available capture data, under the assumption that they are independent. Including the uncertainty quoted by Cyburt et al. our results are consistent at the 1 level. We do not understand the reason for the discrepancy between our ANC result and the extrapolated value from Junghans et al.. However, we note that direct measurements with both radioactive beams and targets and indirect measurements continue to be carried out on this important proton capture reaction.
Acknowledgements.
This work was supported in part by the U.S. Department of Energy under Grant No. DE-FG03-93ER40773, the U.S. National Science Foundation under Grant No. INT-459521-00001, the Romanian Ministry for Education, Research and Youth under contract no. 555/2000, and the Robert A. Welch Foundation. One of the authors (F.C.) acknowledges the support of the Cyclotron Institute, Texas A&M University for part of the time this work was done.References
- Davis et al. (1968) R. Davis, D. Harmer, and K. C. Hoffman, Phys. Rev. Lett 20, 1205 (1968).
- S. Fukuda et al. (2001) S. Fukuda et al. (Super-Kamiokande collaboration), Phys. Rev. Lett 86, 5651 (2001).
- S. N. Ahmed et al. (2003) S. N. Ahmed et al. (SNO collaboration), Phys. Rev. Lett 87, 071301 (2003).
- Bahcall and Pinsonneault (2004) J. Bahcall and M. Pinsonneault, Phys. Rev. Lett 92, 121301 (2004).
- Haxton et al. (2005) W. Haxton, P. Parker, and C. Rolfs, arxiv:nucl-th/0501020 (2005).
- Davids and Typel (2003) B. Davids and S. Typel, Phys. Rev. C 68, 045802 (2003).
- Junghans et al. (2003) A. R. Junghans, E. C. Mohrmann, K. A. Snover, T. D. Steiger, E. G. Adelberger, J. M. Casandjian, , H. E. Swanson, L. Buchmann, S. H. Park, et al., Phys. Rev. C 68, 065803 (2003).
- Cyburt et al. (2004) R. H. Cyburt, B. Davids, and B. K. Jennings, Phys. Rev. C 70, 045801 (2004).
- Azhari et al. (1999a) A. Azhari, V. Burjan, F. Carstoiu, H. Dejbakhsh, C. Gagliardi, V. Kroha, A. Mukhamedzhanov, L. Trache, and R. Tribble, Phys. Rev. Lett. 82, 3960 (1999a).
- Azhari et al. (1999b) A. Azhari, V. Burjan, F. Carstoiu, C. A. Gagliardi, V. Kroha, A. M. Mukhamedzhanov, X. Tang, L. Trache, and R. E. Tribble, Phys. Rev. C 60, 055803 (1999b).
- Tribble et al. (2002) R. E. Tribble, A. Azhari, C. A. Gagliardi, J. C. Hardy, A. M. Mukhamedzhanov, X. Tang, L. Trache, and S. J. Yennello, Nucl. Phys. A 701, 278C (2002).
- Azhari et al. (2001) A. Azhari, V. Burjan, C. Gagliardi, V. Kroha, A. Mukhamedzanov, F. Nunes, X. Tang, L. Trache, and R. Tribble, Phys. Rev. C 63, 055803 (2001).
- Tang et al. (2003) X. Tang, A. Azhari, C. Gagliardi, A. Mukhamedzhanov, F. Pirlepesov, L. Trache, R. Tribble, V. Burjan, V. Kroha, and F. Carstoiu, Phys. Rev. C 67, 015804 (2003).
- Ziegler et al. (1985) J. F. Ziegler, J. P. Biersack, and U. Littmark, The Stopping and Ranges of Ions in Matter, Vol I: The Stopping and Range of Ions in Solids (Pergamon Press, New York, 1985).
- Trache et al. (2003) L. Trache, A. Azhari, F. Carstoiu, H. L. Clark, C. A. Gagliardi, Y.-W. Lui, A. M. Mukhamedzhanov, X. Tang, N. Timofeyuk, and R. E. Tribble, Phys. Rev. C 67, 062801(R) (2003).
- Trache et al. (2000) L. Trache, A. Azhari, H. L. Clark, C. A. Gagliardi, Y.-W. Lui, A. M. Mukhamedzhanov, R. E. Tribble, and F. Carstoiu, Phys. Rev. C 61, 024612 (2000).
- Jeukenne et al. (1977) J. P. Jeukenne, A. Lejeune, and C. Mahaux, Phys. Rev. C 16, 80 (1977).
- Tang et al. (2004) X. Tang, A. Azhari, C. Fu, C. A. Gagliardi, A. M. Mukhamedzhanov, F. Pirlepesov, L. Trache, R. E. Tribble, V. Burjan, V. Kroha, et al., Phys. Rev. C 69, 055807 (2004).
- Blackmon et al. (2004) J. Blackmon, D. Bardayan, C. Brune, F. Carstoiu, A. Champagne, R. Crespo, T. Davinson, J. Fernandes, C. Gagliardi, and U. G. et al., Nucl. Phys. A 746, 365 (2004).
- F. Carstoiu and L. Trache and R. E. Tribble and C. A. Gagliardi (2004) F. Carstoiu and L. Trache and R. E. Tribble and C. A. Gagliardi, Phys. Rev. C 70, 054610 (2004).
- Trache et al. (1998) L. Trache, A. Azhari, H. L. Clark, C. A. Gagliardi, Y. W. Lui, A. M. Mukhamedzhanov, R. E. Tribble, and F. Carstoiu, Phys. Rev. C 58, 2715 (1998).
- Bem et al. (2000) P. Bem, V. Burjan, V. Kroha, J. Novak, S. Piskor, E. Simeckova, J. Vincour, C. A. Gagliardi, A. M. Mukhamedzhanov, and R. E. Tribble, Phys. Rev. C 62, 024320 (2000).
- Rhoades-Brown et al. (1980) M. Rhoades-Brown, M. H. Mcfarlane, and S. C. Pieper, Phys. Rev. C 21, 2417 (1980).
- Xu et al. (1994) H. M. Xu, C. A. Gagliardi, R. E. Tribble, A. M. Mukhamedzhanov, and N. K. Timofeyuk, Phys. Rev. Lett. 73, 2027 (1994).
| Calculation | [fm] | [fm] | Ratio | ||||
|---|---|---|---|---|---|---|---|
| Ref. Azhari et al. (1999b) | 0.37 | 1.00 | 1.20 | 1.75 | 35.19 | 2.469 | 1.000 |
| A | 0.45 | 0.90 | 1.20 | 1.75 | 10.72 | ||
| B | 0.40 | 0.92 | 1.20 | 1.75 | 15.02 | 2.385 | 0.966 |
| C | 0.42 | 0.92 | 1.20 | 1.75 | 12.84 | ||
| D | 0.42 | 0.90 | 0.80 | 1.75 | 10.31 | 2.408 | 0.975 |
| E | 0.42 | 0.90 | 0.80 | 1.55 | 7.97 | 2.538 | 1.028 |
| F | 0.52 | 0.78 | 0.12 | 2.59 | 25.72 | ||
| G | 0.40 | 0.85 | 1.20 | 1.75 | 7.49 | 2.375 | 0.962 |
| H | 0.40 | 0.85 | 1.20 | 1.75 | 9.22 | 2.137 | 0.900 |