Multifragmentation of very heavy nuclear systems (III): fragment velocity correlations and event topology at freeze-out
Abstract
Kinetic energy spectra and fragment velocity correlations, simulated by means of stochastic mean-field calculations, are successfully confronted with experimental data for single multifragmenting sources prepared at the same excitation energy per nucleon in 32 AMeV 129Xe+natSn and 36 AMeV 155Gd+natU central collisions. Relying thus on simulations, average freeze-out times of 200-240 fm/ are estimated The corresponding spatial distributions of fragments are more compact for the lighter system (3-4V0 vs 8V0).
keywords:
NUCLEAR REACTIONS: natSn(129Xe, ), = 32 AMeV; natU(155Gd, ), = 36 AMeV , measured fragment energies, charges and yields with a 4 array , central collisions , fragment energy spectra and velocity correlations , comparison to stochastic mean-field calculation , spatial topology at freeze-out.PACS:
25.70.-z , 25.70.Pq, , , , , , , , , , , , , , , , , , , , , , , , and
1 Introduction
A detailed investigation of multifragmentation in heavy-ion collisions at intermediate energies is of great interest at present time in connection with phase transition in finite nuclear systems [1, 2, 3, 4, 5, 6, 7]. Fused systems produced in central collisions between heavy nuclei allow to address rather large pieces of nuclear matter, of about 200-400 nucleons which undergo multifragmentation [8, 9]. The present paper, presenting intra-event correlations which are highly enlightening for the origin and the features of the process, enlarges and completes the comparison started in reference [9].
Two nuclear reactions, at similar available energy per nucleon were experimentally studied: 32 AMeV 129Xe+natSn and 36 AMeV 155Gd+natU. Single multifragmenting sources at the same excitation energy per nucleon are formed in central collisions. Their properties were examined in detail [9, 10, 11, 12]. The angular and average energy distributions of all fragments (), isotropic in the c.m., are compatible with those of a thermalised multifragmenting source. The two measured average fragment multiplicities are in the ratio of the total charges of the systems, while the charge distributions are identical [13]. This experimental observation can be taken as a signature either of a large exploration of phase space or of volume instabilities. Up to now all global reaction characteristics, except the widths of the individual or total kinetic energy distributions of charged products, were equally well described by statistical [10, 14, 15, 16] and dynamical [9] simulations. The two interpretations are not contradictory since one can suppose that the dynamics of the collisions is sufficiently chaotic to explore enough of the phase space, allowing a statistical description of the fragment production. Higher order charge correlations generated in the same dynamical approach were also successfully confronted with the data [17, 12] for the 32 AMeV 129Xe+natSn case. Both calculated and experimental results suggested an enhanced production of equal-size fragments, compatible with a multifragmentation induced by homogeneous density fluctuations in the liquid-gas coexistence region (spinodal decomposition).
We continue a step further by examining detailed properties of fragment kinetic energy spectra and their intra-event correlations. The validity of the dynamical simulation results versus the experiment will be tested through these observables. Fragment velocity correlations are supposed to bring space and time information concerning the multifragmentation source [18] and may thus put supplementary constraints on models. They may allow to trace back the event topology at “freeze-out”, when the fragments become free and feel only the Coulomb repulsion.
The method and the data are described after the experimental selection of events and the detailed presentation of kinetic energy properties of fragments. Then results of dynamical simulations are compared to the experimental patterns. The consequences on the fragment spatial distribution at the end of the elapsed time corresponding to their separation are discussed too. Conclusions are finally drawn.
2 Experimental selection and kinetic energy spectra
The data were collected, as largely described in ref. [8], by means of the 336 multilayer detection cells of the 4 multidetector INDRA [19]. Accurate fragment identification and energy calibration - crucial for this type of studies - were achieved by taking into account pulse height defects in the silicon detectors [20] and the influence of the quenching and of the -rays on the light output of the CsI(Tl) scintillators [21, 22]. The energy of the detected products is obtained with an accuracy of 4%. In the following, results relative to the kinetic properties of fragments are discussed in the centre of mass of the reactions and thus depend on the masses (not measured) attributed to the fragments. In all figures, a single mass close to that of the -stability valley was attributed to each fragment of charge Z. However recent studies on the de-excitation of hot heavy nuclei have shown that the cold residues have an average mass lying on the evaporation attractor line [23], corresponding to neutron deficient nuclei. The two mass formulae become different for nuclei with charges larger than 20-25; thus the chosen relation is only important for the heaviest fragments discussed in the present paper. It was verified that the average c.m. energy of these fragments changes at most by a few MeV when changing the hypothesis on their mass, which do not alter the conclusions given below.
Among the complete experimental events: total pseudo-momentum 75% of the entrance channel value (ZprojVproj), and total detected charge 80 (Xe+Sn) or 120 (Gd+U), compact single sources were selected with the constraint of flow angle [24, 25, 8, 9]; indeed it was shown in previous studies that while events present the topology of emission from two sources at small flow angles, they evolve towards a single-source configuration above (see figure 9 in ref [8] and figure 1 in ref [6]). A minimum number of three fragments (Z5) was additionally required. The measured average fragment multiplicities are 4.3 for Xe+Sn and 6.2 for Gd+U [9]. The reconstructed sources of both systems have an excitation energy per nucleon 6.5 MeV, and average charge and mass (estimated following the method described in [9]): 99, 236 and 150, 378: the missing charge, mass and energy relative to the entrance channel values are carried away by high energy particles (Z2) emitted backward and forward.
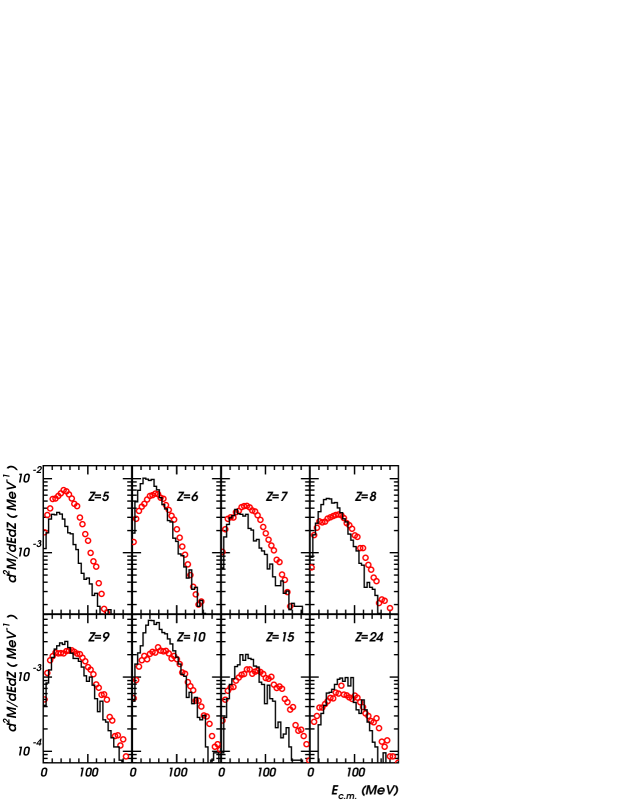
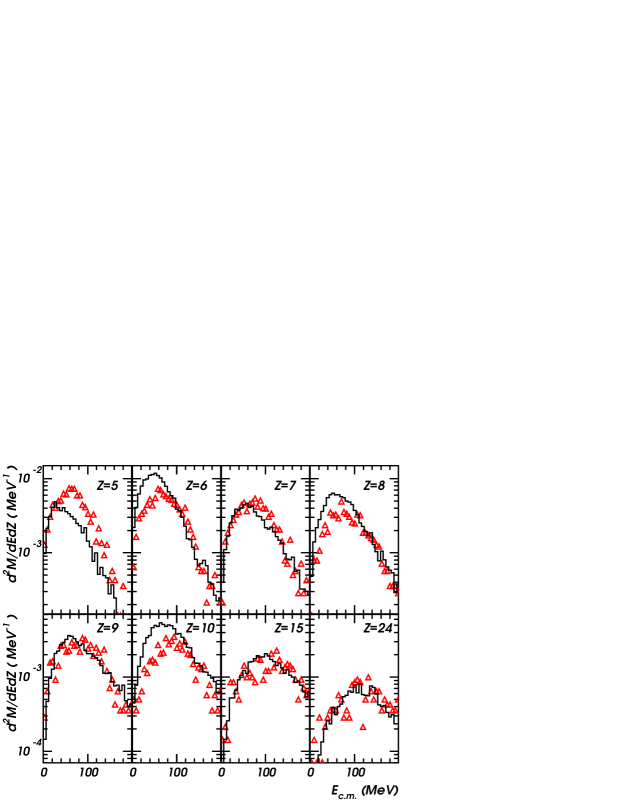
The c.m. kinetic energy spectra of various fragments emitted in these central collisions are shown in fig. 1. They present asymmetric shapes for the lighter fragments, and tend to become more symmetric for Z15, encoding information about the Coulomb repulsion, radial expansion and the temperature of the single source from which they originate.
More information on the kinematical characteristics of the fragments was accessed by sorting events according to the fragment multiplicity, Mf, and the rank of the fragment in the event (largest, Zmax, second largest, Zmax2, third largest, Zmax3, and so on).
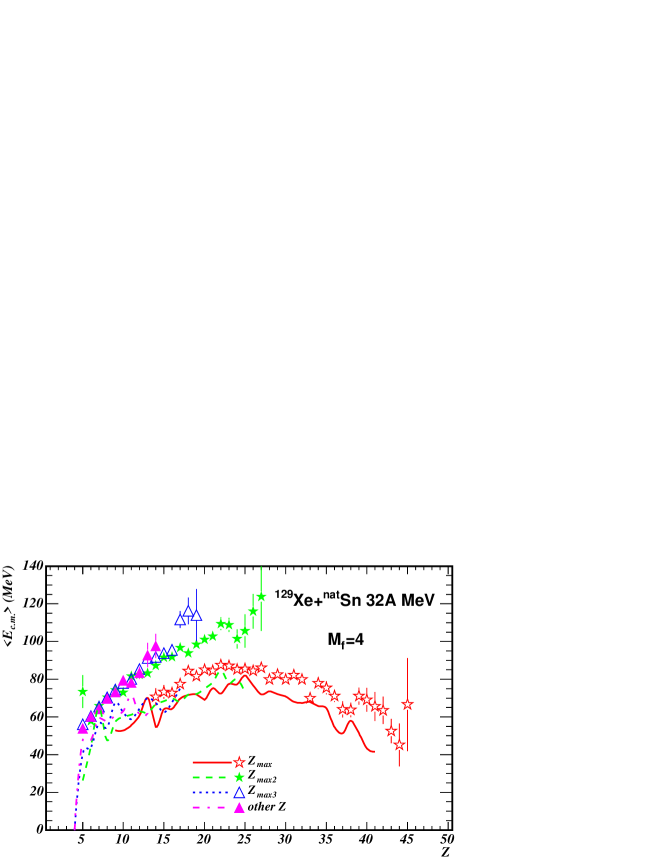
An example of the results is shown, for the Xe+Sn system, by the symbols in fig. 2. Events with four fragments are displayed, but we have observed that the experimental patterns and energy values are identical irrespective of the fragment multiplicity. Ref. [26] shows that, around 30AMeV, the fragment kinetic energy is essentially from Coulomb origin; this invariance is a good indication that events arise from sources with very similar charge, independently of the fragment multiplicity. The average kinetic energy of fragments first increases with the fragment charge, and then saturates and even decreases for charges Z20-25, independently of the fragment multiplicity. This evolution is a Coulomb effect. The most striking feature in fig. 2 is the particular role played by the largest fragment in each partition: in the region Z=15-25 the heaviest fragment, Zmax, has always the lowest average kinetic energy. Note that this behaviour was already observed for the same system at 50 AMeV in ref. [25]. This effect may be caused by an inhomogeneity of the system created by c.m. conservation constraints, positioning the largest fragment close to the centre [27]; thus Coulomb as well as radial expansion energies would be reduced for this largest fragment.
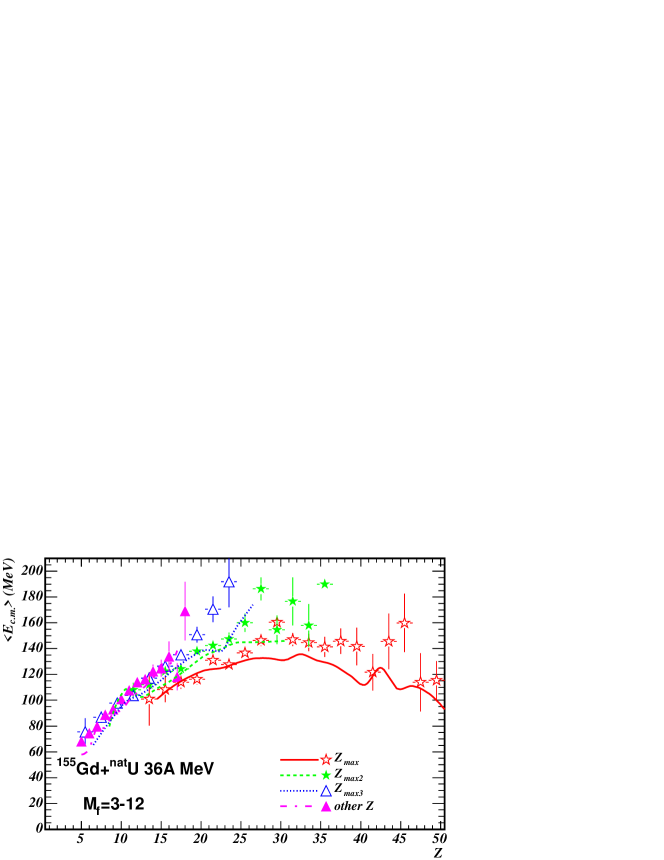
The same picture was drawn for the heavier system, Gd+U. Again one observes the same pattern whatever the fragment multiplicity. Because of the smaller number of events collected for this system, fig. 3 displays results without multiplicity selection. As expected from Coulomb effects, the average energies are larger for Gd+U than for Xe+Sn. Here again the average energy of the largest fragment is smaller than the energy of the other fragments, and shows a maximum for Z30-35 [9]. However the relative difference between the energies of the largest fragment and those of the others is smaller for Gd+U than for Xe+Sn.
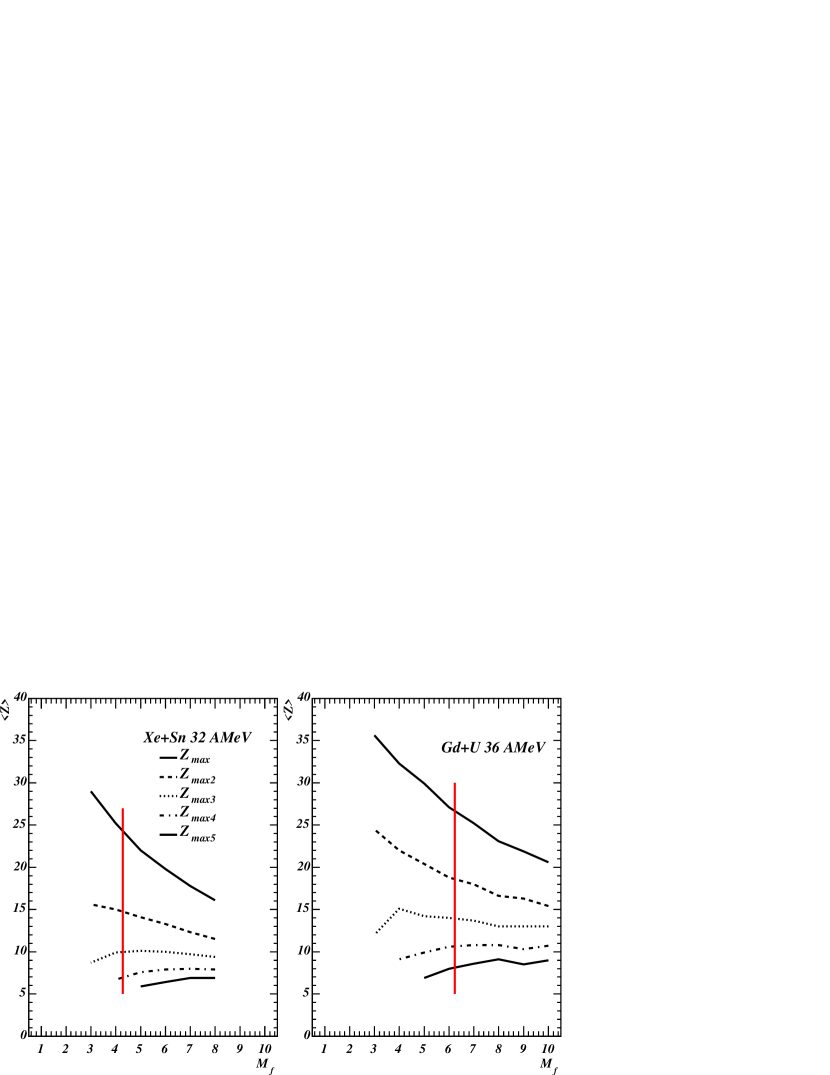
The evolution of these average energies gives first information on the topology of the events when nuclear interaction becomes ineffective; a connected observable is the average fragment charge as a function of their multiplicity and rank, as shown in fig. 4. Only Zmax strongly varies with Mf; the fragments of rank larger than 2 keep almost constant charge values. The largest fragment again presents a special behaviour. The observation of figs. 2, 3, 4 reminds of the classification of multifragmentation events [28] in “sun” (a large central fragment surrounded by small ones) for small Mf events and “soup” (a random spatial distribution of fragments of comparable sizes) for large Mf events. However, in this last case, one would expect that the largest fragment looses its specificity, which is not true here as it keeps a smaller average energy, even at large multiplicities. This above image is thus too simple, and one may hope to gain a deeper understanding from the velocity correlations presented in the next section. Several advanced analyses took advantage of the special behaviour of the largest fragment, for instance universal fluctuations [29] which indicate a transition from an ordered to a disordered phase, and bimodality [30, 31] which suggests the occurrence of a first order phase transition in the studied systems.
3 Velocity correlations
Relative velocity correlation functions between emitted products are tools to get information on emission time scales and on the disassembling source volume. Light charged particle correlation functions were heavily investigated in the past (see [32, 33] for reviews and [34, 35, 11]). A new technique, taking advantage of both the height and the width of the correlation functions was recently developed, allowing to disentangle fast and slow emission components [36]. Fragment correlation functions were obtained for very light fragments [37, 38], and over a much larger charge range [39, 40]. In this case energy and momentum conservation becomes important. The Coulomb interaction between the two fragments, and between the fragments and the source starts to dominate; one may thus expect to get information on the arrangement of the fragments inside the source volume [41]. Fragment velocity correlation functions are often presented as a function of a reduced velocity, , in order to increase the statistics, through mixing of fragments with different charges by scaling the Coulomb effects.
Fragment velocity values are derived from their energy using estimated masses (see sect 2). The emission polar and azimutal angles of a fragment are chosen randomly over those covered by the module which detected this fragment. For each couple of fragments with velocities and , in an event of multiplicity , ( and ), the reduced relative velocity is defined as [18]:
| (1) |
The formalism for two particle correlation depending on one variable was considered for intermediate mass fragments (IMF) emitted in multifragmentation [41, 42, 28]. We define the two fragment correlation function dependent on as:
| (2) |
where is the probability to find two fragments of atomic numbers with the reduced velocity in one event, while the product is the probability to find two fragments with the same reduced velocity, but in two different events. The sum at the numerator in eq. (2) spans all couples having in all real events and it accounts for correlated fragments, while the denominator accounts for the uncorrelated ones. The reduced velocity distribution function of the correlated fragments is built by taking into account all two-fragment combinations: in one event and all the experimental selected events. For the uncorrelated case, we have proceeded as follows. For a given real event, twenty pseudo-events were generated by associating to each fragment another one with the same charge, randomly found in one of the other experimental events of the same sample. The fragment multiplicity and the sum of the fragment charges of the initial event are thus conserved. A pseudo-event is validated only if all its fragments come from different real events and were detected in different INDRA modules. This procedure reduces the biases due to Coulomb effects. The ratio of the two distribution functions: real over pseudo-events, in each reduced velocity bin, leads to the correlation function defined in eq. (2). No normalisation factor but the factor 20 coming from the number of uncorrelated events is used. Since only fragments from the selected sample are used to construct the uncorrelated events, their reduced velocity distribution essentially reflects the two-fragment phase-space population of the detection array in the absence of any final state interaction.
Several correlation functions are proposed here, depending on the size of the fragments considered in the procedure:
-
i)
all fragments considered ();
-
ii)
intermediate mass fragments (IMF) ;
-
iii)
reduced velocity correlation of the heaviest fragment with each of the others in the event .
In the absence of correlation the value of the correlation function should be equal to 1. At small reduced velocities momentum conservation as well as Coulomb repulsion influence the correlation functions.
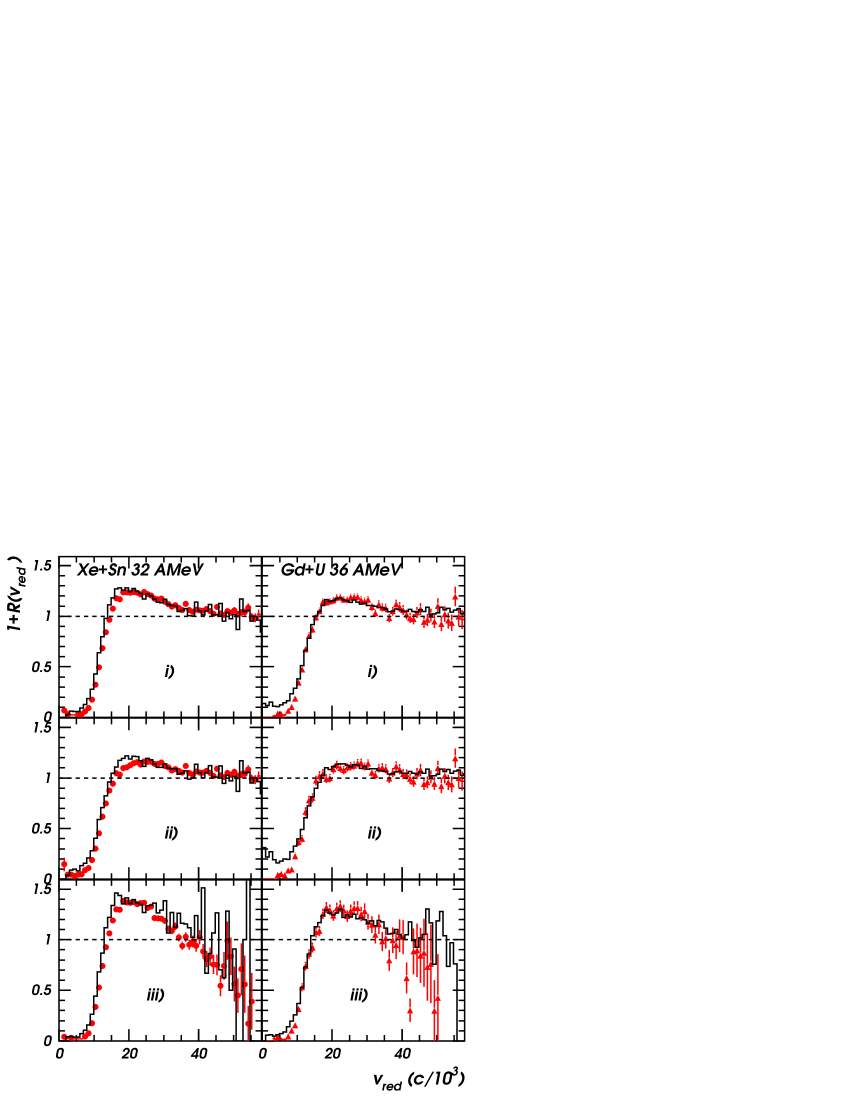
The three types of experimental correlation functions are shown as symbols in fig. 5, for 32 AMeV Xe+Sn on the left side and for 36 AMeV Gd+U on the right side. It was verified with the help of the simulation described in the next section that the correlation functions are negligibly affected by the granularity of the INDRA array. In the six panels one observes a dip in the vicinity of , followed by an enhancement in the intermediate reduced velocity region (0.015-0.035). The width of the hole, independent of the charges of the two fragments considered (see fig.5.14 of ref. [10]), reflects the distances between fragments at freeze-out. Its depth, with a minimum value very close to zero, indicates that fragments are not emitted independently, as assumed in sequential decay models [28]. Indeed it was shown in [43], for a system similar to Xe+Sn, that the Coulomb interaction effect for two fragments is negligible when the time between their emission is long: fm/. The height of the bump at intermediate is expected to be connected to the distribution of the nuclear matter inside the source volume at freeze-out, for instance, as mentioned above, “sun events” - evidenced by a very pronounced peak, or “soup events” for which the peak is diminished and the distribution is flatter [28].
The shape of the correlation function evolves, for each system, with the size of the correlated fragments. The height of the bump at intermediate is small when all the fragments are considered - case i), it becomes flatter when only small fragments are treated - case ii). Then, it increases - case iii) - when the heaviest fragments are isolated in the procedure.
In each of the three cases, the width of the hole at a value of the correlation function equal to 0.5 is very similar for the two systems. The shortest intra-fragment distances seem thus to be quite independent of the system size. For a given system, the width of the Coulomb hole is slightly narrower and the peak more pronounced for cases iii), testifying about a stronger Coulomb interaction of the heavy fragments with the others, in relation with their position in the source. This effect is especially visible for the system Xe+Sn. In fact, a more pronounced peak for this system is manifest in all three cases, proving may be simply that, at smaller average multiplicities, the centre of mass is closer to the heaviest fragment and the distances between this fragment and all the others are on average shorter. While for cases i) and ii) it was verified that the correlation function remains at 1 up to the maximum range populated by the reduced velocity distribution (0.09), for case iii) the correlation function strongly decreases below 1 above 0.04, particularly for Xe+Sn. Indeed the range of the reduced velocity distributions (both correlated and uncorrelated) are shorter in that case (0.05); it was claimed in [42] that energy and momentum conservation implies that at very large reduced velocities, the correlation function will tend to zero; it is not clear why this trend would apply only to correlation functions of type iii). The reason of the decrease must probably be found in the uncorrelated distributions; it is indicated in [40] that the shape of the correlation function is very sensitive to the background constraints when the heavier fragment is isolated.
Quantitative information on the source sizes and fragment emission times will be derived from the confrontation with full dynamical simulations of collisions in the next section.
4 Comparisons with collision simulations
4.1 BOB simulations
One way to explain multifragmentation in heavy ion collisions at Fermi energies is to correlate it with a phase transition of liquid-gas type, due to the specific form of the nucleon-nucleon interaction. After a compression stage, the nuclear system enters an expansion phase, during which it cools down and evolves in the spinodal region (of negative compressibility) of the phase coexistence domain, where multifragmentation occurs through the growth of density fluctuations [44]. Stochastic mean field simulations of nucleus-nucleus collisions, based on the Boltzmann-Langevin equation, allow for the treatment of unstable systems [45, 46, 47]. Nevertheless applications to 3D nuclear collisions are prohibited by computational limitations. The dynamical path through the spinodal region has been instead simulated by means of a Brownian force [48, 49] - Brownian One Body (BOB) dynamics - grafted, at the instant of maximum compression, 40 fm/, on the one-body density evolution calculated in a Boltzmann-Nordheim-Vlasov (BNV) approach. The chosen self-consistent mean field potential gives a soft equation of state. The ingredients of the BOB simulations are presented in detail in [9], as well as the comparison between average observables concerning filtered simulated events and experimental ones. In the simulations of head-on collisions, both systems form a single source which expands with time and breaks-up into several fragments (as shown by the time evolution of the densities, figure 1 of ref [50]). At 100 fm/, at low density inside the spinodal zone, the systems are already thermalised, with a temperature of 4 MeV and a small radial velocity at the surface (), and the first fragments appear. An algorithm for reconstructing fragments is applied at intervals of 20 fm/, based on minimum density cut-off 0.01 fm-3.
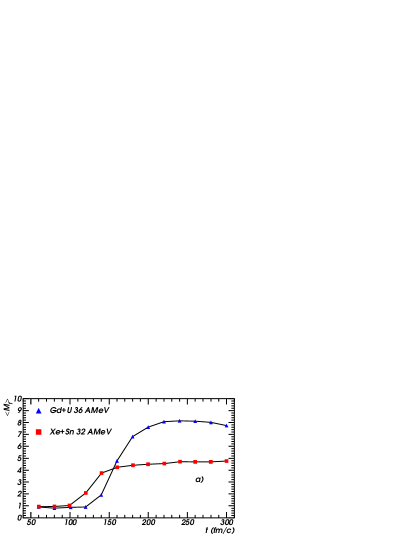
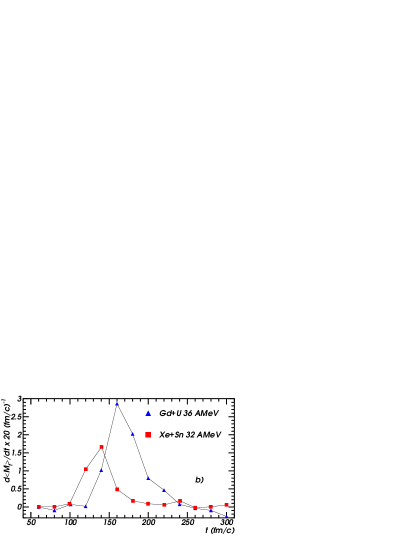
The calculation is stopped at the time, different for each system, when the average fragment multiplicity becomes a constant, as shown in fig. 6a). For a given system, this multiplicity is independent of the value of [9]. The variation rate of the fragment multiplicity shows in fig. 6b) that any dramatic change in the average number of fragments ends at 200 fm/ for 129Xe+natSn and at 240 fm/ for 155Gd+natU. These values can be considered as reasonable average freeze-out times [50].
At the end of a BOB calculation, the fragments, still hot ( 3 AMeV), de-excite via secondary particle emission, treated by means of the suitable part of the code SIMON [51]. Global observables, like , , and distributions are very well reproduced by BOB calculations, while the average fragment kinetic energy is underestimated by about 20% over all the Z range for Xe+Sn, and for Z20 for Gd+U [9]. Part of the discrepancy might come from the semi-classical treatment of BOB which underestimates the radial energy - by about 50% - as compared to a quantal treatment [7].
4.2 Average energies and correlation functions
After filtering the calculated events through a software replica of the INDRA array, the average calculated kinetic energies of fragments were sorted following the fragment multiplicity and rank, as done for experimental data. The results are displayed by the lines in figs. 2 and 3. As mentioned above, the calculated energies underestimate the experimental values for Xe+Sn while they agree with data for the lighter elements in Gd+U. Besides a drawback in the calculation mentioned above, this may sign a more compact shape of the experimental configuration with respect to the calculated one for Xe+Sn. In agreement with experiment the average energy for a given charge is independent of the fragment multiplicity (not shown) and the average energy of the largest fragment decreases when its charge becomes larger than 25 (Xe+Sn) or 30-35 (Gd+U). For the heavier system, the calculated energies show the same hierarchy with the fragment rank, namely the energy of a given charge is smaller when the fragment is the heavier of the partition. Conversely, the calculated energies are independent of the fragment rank for Xe+Sn. This may indicate that the topology of the simulated events reflects well the real one for Gd+U while it is slightly different for Xe+Sn. A different topology also influences the calculated values of the fragment energy: as stated in [7] Coulomb acceleration is more effective for a uniform distribution than for a hollow configuration as that obtained in BOB [50]. Thus both the larger absolute values of the fragment energies, and the smaller energy of the largest fragment may indicate that, for Xe+Sn, the experimental freeze-out configuration is more compact, more uniformly filled, with the largest fragment closer to the centre, than the calculated configuration.
We have also confronted the simulated kinetic energy spectra of the
final fragments with the experimental ones. Fig. 1 shows that,
for Xe+Sn, the calculated spectra are narrower than the experimental ones,
and more so for higher charges. For the heavier system the agreement
between calculated and measured spectra is better:
both the average values and the widths of the spectra are reproduced
to within a few percents for odd charges and about 10% for even
charges, while the differences on these quantities lie between 10 and
20% for Xe+Sn. A calculated odd-even effect can be noted: not
only is the production of even charge fragment favoured, but both the
average values and the widths of their spectra are farther from the
experimental values than those of the odd-charge fragments.
Note that for both systems fragments with charge Z=5 are
strongly underestimated in the calculation.
While the odd-even effect has to be attributed to the de-excitation
process, as no such effect is seen in the primary
distributions, the disagreement between calculation and experiment,
besides the above mentioned differences in topology, may originate
from
i) the dropping-out of the light charged particles in the last step of
the calculation: only fragments are input to the SIMON code, the
particles already free (27% of the initial charge for Xe+Sn,
22% for Gd+U) do not participate to the Coulomb propagation.
This contributes to the underestimation of the energy.
ii) the spatial distribution of these primary particles: placed
mainly in the centre of the source instead of being uniformly
distributed, they would increase the Coulomb effect.
To summarize, these dynamical calculations fit rather well the
individual experimental energy spectra - a difficult task,
scarcely reported up to now for other models.
The method of reduced velocity correlations, as described in the previous section, is applied in the following to fragments from BOB simulated events. A good agreement between the simulated (histograms) and experimental (symbols) correlation functions is observed in fig. 5. The depth and the width of the Coulomb hole are well reproduced by the present dynamical simulations for the different correlation functions. Note that the decrease below 1 of the correlation functions of type iii) is present also in the simulations. For Gd+U, the agreement between the experimental and calculated correlation functions is excellent; the small filling-up at low reduced velocity is introduced by the filtering step. For Xe+Sn, the three calculated functions are slightly narrower than the experimental ones and the peak is displaced towards smaller reduced velocities. This discrepancy confirms the difference between the experimental and calculated event topology already mentioned. However it should be stressed that, for both systems, the correlation functions generated by the BOB simulations account better for the experimental ones than statistical models like SMM or MMM [10, 52, 16].
4.3 Freeze-out configuration: volume estimate and topology
The agreement between calculated and experimental kinetic properties, especially for the heavier system, encouraged us to give signification to the positions of the fragments just after their formation.
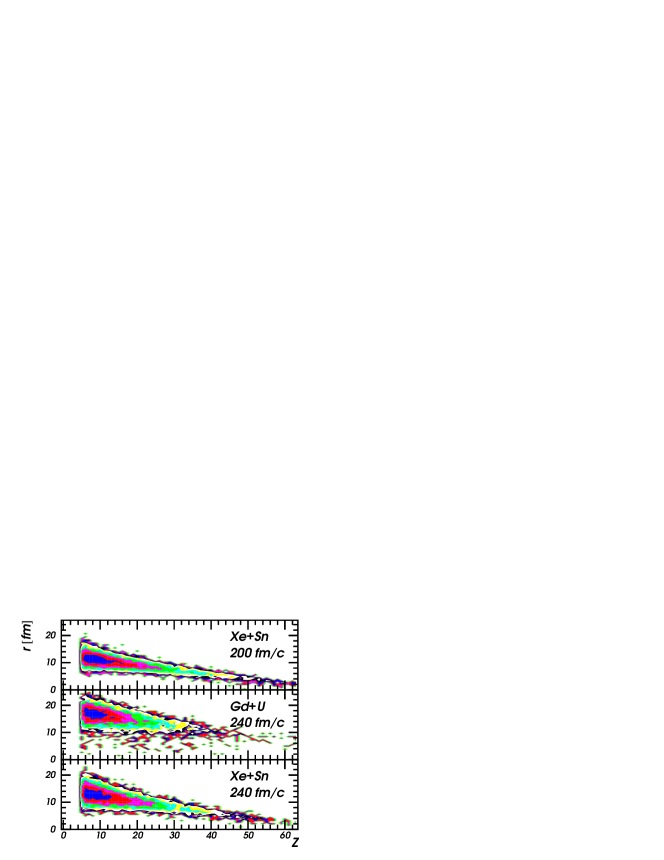
We analysed the calculated events at the moment when their multiplicity variation rate vanishes: at 200 fm/ from the beginning of the calculation for Xe+Sn and at 240 fm/ for Gd+U (see fig. 6b). At the moment of the fragment separation, the values of their distances from the source c.m. or of their relative distances give information concerning the topology of events and associated freeze-out volumes.

The position radii of the fragments relative to the c.m - fig. 7 - are shorter in the Xe+Sn reaction at 200 fm/ (upper panel) than in Gd+U at 240 fm/ (middle panel), which may be attributed to the shorter propagation time on one hand, and to the Coulomb interaction () and the radial expansion (), both inferior for the smallest source [9]. The effect of the time difference is shown on the lower panel of the figure. The ridge lines of the plots for the two systems have the same slope [53], decreases when increases. These observations explain the behaviour of the fragment-fragment correlation functions shown in fig. 5: the heavier fragments take more central positions, at least at the end of the fragment separation time. In case of Xe+Sn system the heavier fragments are moreover very close to the centre of mass (2-3 fm), while they are farther away for Gd+U. Correlatively the peak in the correlation functions increases when the heavier fragments are involved and is more pronounced for the lighter system.
| system | t (fm/) | ||||
|---|---|---|---|---|---|
| 129Xe+119Sn | 238 | 100 | 200 | 5.1 | 2.8 |
| 155Gd+238U | 360 | 142 | 240 | 8.1 | 7.9 |
| 129Xe+119Sn | 238 | 100 | 240 | 5.1 | 4.2 |
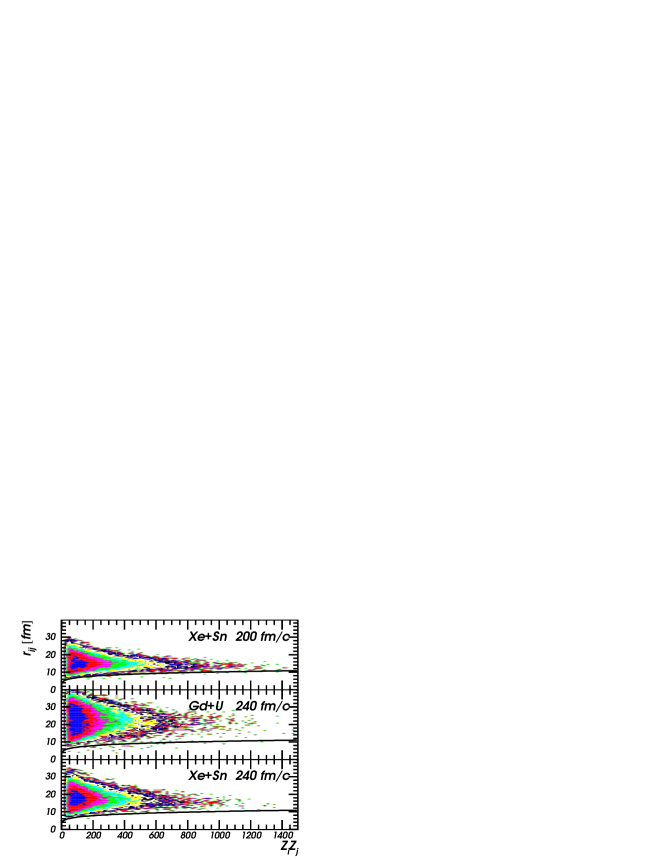
The local charge concentration per unit volume, d/d, plotted in fig. 8 as a function of the distance from the c.m. for both systems, summarizes well what was discussed all along the paper: the configuration for Xe+Sn is more compact (and one derives from the experiment a configuration even more uniformly filled) than the one observed for Gd+U. This is also well illustrated by the relative distances between two fragment centres , shown in fig. 9. The shortest distances concern the closest neighbours, the longest ones are representative of the size of the sources. Relative distances are shorter for the reaction Xe+Sn at 200 fm/ and also at 240 fm/ - fig. 9 (upper and lower panels) than for Gd+U at 240 fm/ (middle panel). The profile of each distribution is horizontal, showing that the average distance between fragment centres is the same, irrespective of their size. The minimum distance ( 8 fm for the smallest neighbour fragments) is the same in all cases. The points corresponding to big fragments () are close to the limit line (calculated for two equal touching spheres at normal nuclear density) for the lighter system. It is not the case for the heavier system (middle panel).
Moreover fig. 8 can also provide a rough estimate of the freeze-out volume. d is the infinitesimal number of charges in the volume element d. The upper panel in fig. 8 corresponds to Xe+Sn single source at 200 fm/. The distribution has a nearly Gaussian shape, of mean and full width at half maximum FWHM. A sphere of radius , indicated by the arrow in the figure, englobes most of the fragment centres and has a volume of 2.8 ; the middle panel concerns the Gd+U single source at 240 fm/: the volume of the sphere of radius is 7.9 . Volumes at normal density fm-3 are calculated for the masses of the sources given in table 1. The large difference between the volumes of the two systems, which may look surprising, is coherent with the influence of the system size on the Coulomb and radial expansion [50], as already suggested by the average kinetic energies of the fragments (figs. 2 and 3). It might even be more pronounced, taking into account the underestimation of the compactness of the Xe+Sn system visible in the small discrepancy between the calculated and experimental correlation functions. The difference in the volume of the Xe+Sn source within 40 fm/ around the average freeze-out instant (figure 8 and table 1) gives an estimate of the uncertainty on the determination of this volume. Note that the volume obtained at 240 fm/ for Xe+Sn compares well with that estimated by a simpler simulation using the measured charge partitions [54].
5 Conclusions
Energy spectra of different fragments, issued from central collisions of 32 AMeV 129Xe projectile on a natSn target and 36 AMeV 155Gd projectile on a natU target were presented. A detailed study of the evolution of the average energy versus fragment charge, and of the average sizes of the ordered fragments versus fragment multiplicity evidences the particular role of the largest fragment in each event. Experimental relative velocity correlation function of different types were built. Similarities between the two systems were inferred for the intra-fragment distances, while the position of the larger fragments relative to the centre of mass seemed to depend on the size of the multifragmenting source.
All experimental results were satisfactorily well described by a stochastic mean-field model calculation, proving the capability of this dynamical approach to reproduce in detail the experimental data and not only global, average observables. The observed differences noted for the Xe+Sn system may reveal that the topology of the events at freeze-out is not identical to the experimental one: fragmentation products seem to be more uniformly distributed in space in the experimental configuration. Conversely the agreement between simulation and experiment is excellent for Gd+U, allowing to state that the simulation provides plausible reaction scenario and freeze-out topology. In the BOB image, involving the spinodal decomposition of the source (about 100 fm/ after the beginning of the collision), the freeze-out instant may be seen as the end of a time interval in which all the fragments are well separated, i.e. that moment where the last two closest fragments move away at 2 fm. This fact is on average accomplished at 200 fm/ from the beginning of the simulations for the lighter system and at 240 fm/ for the heavier one. At the same moment: 240 fm/, when the fragment multiplicity is definitively stable in both reactions, the radial fragment distribution reflects the influence of the system size on the Coulomb and radial expansion. The freeze-out volumes estimated at this moment are several times bigger than the volume of the single source calculated at normal nuclear density. The higher compactness of the lighter system was quantitatively confirmed, as well as the more central position of the larger fragments.
References
- [1] D. H. E. Gross, Phys. Rep. 279 (1997) 119.
- [2] J. Richert et al., Phys. Rep. 350 (2001) 1.
- [3] L. Beaulieu et al., Phys. Rev. C 64 (2001) 064604.
- [4] J. B. Elliott et al., Phys. Rev. Lett. 88 (2002) 042701.
- [5] J. B. Natowitz et al., Phys. Rev. Lett 89 (2002) 212701.
- [6] B. Borderie, J. Phys. G: Nucl. Part. Phys. 28 (2002) R217.
- [7] P. Chomaz et al., Phys. Rep. 389 (2004) 263.
- [8] J. D. Frankland et al. (INDRA Collaboration), Nucl. Phys. A 689 (2001) 905.
- [9] J. D. Frankland et al. (INDRA Collaboration), Nucl. Phys. A 689 (2001) 940.
- [10] S. Salou, thèse de doctorat, Université de Caen (1997), http://tel.ccsd.cnrs.fr/documents/archives0/00/00/36/88/.
- [11] S. Hudan et al. (INDRA Collaboration), Phys. Rev. C 67 (2003) 064613.
- [12] G. Tăbăcaru et al., Eur. Phys. J. A 18 (2003) 103.
- [13] M. F. Rivet et al. (INDRA Collaboration), Phys. Lett. B 430 (1998) 217.
- [14] R. Bougault (INDRA collaboration), H. Feldmeier et al. (eds.) Proc. XXVII Int. Workshop on Gross Properties of Nuclei and Nuclear Excitations, Hirschegg, Austria, 1999, 24.
- [15] N. Le Neindre, thèse de doctorat, Université de Caen (1999), http://tel.ccsd.cnrs.fr/documents/archives0/00/00/37/41/.
- [16] A. H. Raduta et al., Phys. Rev. C 65 (2002) 054610.
- [17] B. Borderie et al. (INDRA Collaboration), Phys. Rev. Lett. 86 (2001) 3252.
- [18] Y. D. Kim et al., Phys. Rev. C 45 (1992) 338.
- [19] J. Pouthas et al., Nucl. Instr. and Meth. in Phys. Res. A 357 (1995) 418.
- [20] G. Tăbăcaru et al. (INDRA Collaboration), Nucl. Instr. and Meth. in Phys. Res. A 428 (1999) 379.
- [21] M. Pârlog et al. (INDRA Collaboration), Nucl. Instr. and Meth. in Phys. Res. A 482 (2002) 693.
- [22] M. Pârlog et al. (INDRA Collaboration), Nucl. Instr. and Meth. in Phys. Res. A 482 (2002) 674.
- [23] R. J. Charity, Phys. Rev. C 58 (1998) 1073.
- [24] J. F. Lecolley et al., Phys. Lett. B 325 (1994) 317.
- [25] N. Marie et al. (INDRA Collaboration), Phys. Lett. B 391 (1997) 15.
- [26] M. Colonna et al., Nucl. Phys. A 742 (2004) 337.
- [27] A. H. Raduta et al., Nucl. Phys. A 724 (2003) 233.
- [28] O. Schapiro et al., Nucl. Phys. A 576 (1994) 428.
- [29] J. D. Frankland et al. (INDRA and ALADIN collaborations), Phys. Rev. C 71 (2005) 034607.
- [30] M. Pichon, thèse de doctorat, Université de Caen (2004), http://tel.ccsd.cnrs.fr/documents/archives0/00/00/74/51/.
- [31] M. Pichon et al. (INDRA and ALADIN collaborations), Nucl. Phys. A 749 (2005) 93.
- [32] W. Bauer et al., Ann. Rev. Nucl. Part. Sci. 42 (1992) 77.
- [33] D. Ardouin, Int. J. Mod. Phys. E 6 (1997) 391.
- [34] N. Marie et al. (INDRA Collaboration), Phys. Rev. C 58 (1998) 256.
- [35] R. Ghetti et al. (CHIC collaboration), Nucl. Phys. A 674 (2000) 277.
- [36] G. Verde et al., Phys. Rev C 65 (2002) 054609.
- [37] Y. D. Kim et al., Phys. Rev. C 45 (1992) 387.
- [38] D. R. Bowman et al., Phys. Rev. Lett. 70 (1993) 3534.
- [39] T. C. Sangster et al., Phys. Rev. C 47 (1993) 2457.
- [40] T. C. Sangster et al., Phys. Rev. C 51 (1995) 1280.
- [41] O. Schapiro et al., Nucl. Phys. A 573 (1994) 143.
- [42] O. Schapiro et al., Nucl. Phys. A 568 (1994) 333.
- [43] R. Trockel et al., Phys. Rev. Lett. 59 (1987) 2844.
- [44] G. F. Bertsch et al., Phys. Lett. B 126 (1983) 9.
- [45] J. Randrup et al., Nucl. Phys. A 514 (1990) 339.
- [46] P. Chomaz et al., Phys. Lett. B 254 (1991) 340.
- [47] G. F. Burgio et al., Nucl. Phys. A 529 (1991) 157.
- [48] P. Chomaz et al., Phys. Rev. Lett. 73 (1994) 3512.
- [49] A. Guarnera et al., Phys. Lett. B 403 (1997) 191.
- [50] M. Pârlog et al., Eur. Phys. J. A (2005) in press, nucl-ex/0503004.
- [51] Anh-Dung Nguyen, thèse de doctorat, Université de Caen (1998), LPCC T 98-02.
- [52] G. Tăbăcaru et al. (INDRA collaboration), G. Bonsignori et al. (eds.) Proc. of the International Conference on Structure of the Nucleus at the Dawn of the Century, Bologna, Italy, World Scientific, 2001, Vol. 1, Nucleus-Nucleus collisions, 321, nucl-ex/010215.
- [53] G. Tăbăcaru, thèse de doctorat, Université Paris-XI Orsay (2000), http://tel.ccsd.cnrs.fr/documents/archives0/00/00/79/12/.
- [54] S. Piantelli et al. (INDRA Collaboration), submitted to Phys. Lett. B (2005).